| Param | Original file | Final file |
|---|---|---|
| Filename | modeM0/AS1A14_057T04_9000006508_53854cztM0_level2.fits | modeM0/AS1A14_057T04_9000006508_53854cztM0_level2_quad_clean.evt |
| Size (bytes) | 693,912,960 | 99,169,920 |
| Size | 661.8 MB | 94.6 MB |
| Events in quadrant A | 4,429,583 | 693,603 |
| Events in quadrant B | 4,955,866 | 724,193 |
| Events in quadrant C | 9,829,962 | 483,730 |
| Events in quadrant D | 5,901,182 | 588,870 |
| Mode M0 | |||
|---|---|---|---|
| Quadrant | BADHDUFLAG | Total packets | Discarded packets |
| A | 0 | 18010 | 0 |
| B | 0 | 19718 | 0 |
| C | 0 | 34251 | 6 |
| D | 0 | 22549 | 0 |
| Mode SS | |||
|---|---|---|---|
| Quadrant | BADHDUFLAG | Total packets | Discarded packets |
| A | 0 | 148 | 0 |
| B | 0 | 148 | 0 |
| C | 0 | 148 | 0 |
| D | 0 | 148 | 0 |
| Quadrant | Total seconds | Saturated seconds | Saturation percentage |
|---|---|---|---|
| A | 7355 | 232 | 3.154317% |
| B | 7355 | 380 | 5.166553% |
| C | 7355 | 2202 | 29.938817% |
| D | 7355 | 644 | 8.755948% |
Noise dominated data is calculated using 1-second bins in cleaned event files. If a bin has >2000 counts, and if more than 50% of those come from <1% of pixels, then it is considered to be noise-dominated and hence unusable.
| Quadrant | # 1 sec bins | Bins with >0 counts | Bins with >2000 counts | High rate bins dominated by noise | Noise dominated (total time) | Noise dominated (detector-on time) | Marked lightcurve |
|---|---|---|---|---|---|---|---|
| A | 7354 | 7354 | 201 | 201 | 2.73% | 2.73% | 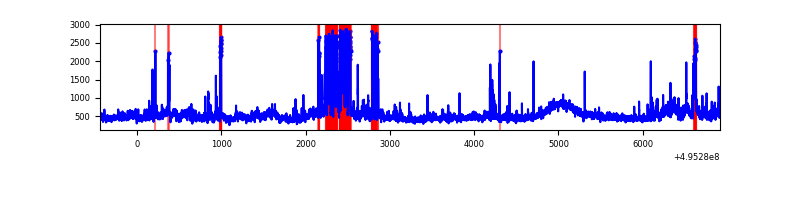 |
| B | 7354 | 7354 | 235 | 235 | 3.20% | 3.20% | 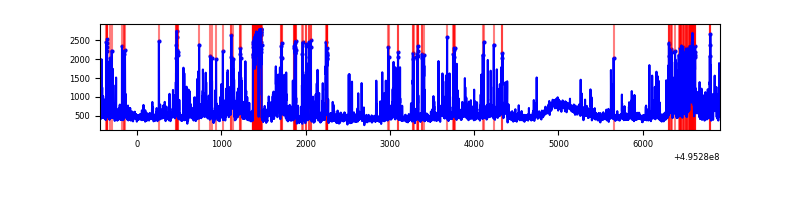 |
| C | 7354 | 7354 | 2095 | 2095 | 28.49% | 28.49% | 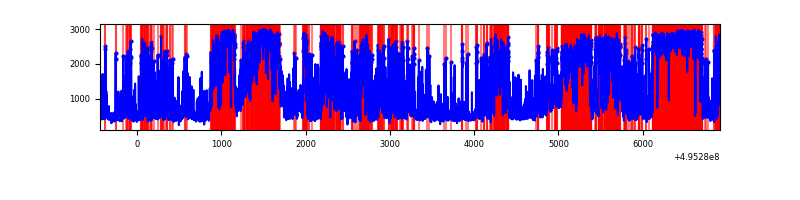 |
| D | 7354 | 7354 | 631 | 631 | 8.58% | 8.58% | 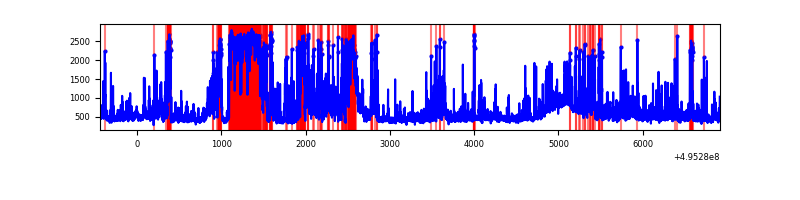 |
Top three noisy pixels from each quadrant. If the there are fewer than three noisy pixels in the level2.evt file, extra rows are filled as -1
| Pixel properties | Quadrant properties | ||||||
|---|---|---|---|---|---|---|---|
| Quadrant | DetID | PixID | Counts | Sigma | Mean | Median | Sigma |
| A | 8 | 249 | 471905 | 2351.73 | 809 | 787 | 200.3 |
| A | 0 | 8 | 411293 | 2049.17 | 809 | 787 | 200.3 |
| A | 15 | 174 | 206545 | 1027.1 | 809 | 787 | 200.3 |
| B | 0 | 213 | 576283 | 3334.6 | 788 | 761 | 172.6 |
| B | 5 | 185 | 424191 | 2453.37 | 788 | 761 | 172.6 |
| B | 10 | 245 | 232988 | 1345.53 | 788 | 761 | 172.6 |
| C | 1 | 241 | 3284440 | 17432.77 | 669 | 662 | 188.4 |
| C | 15 | 224 | 2619450 | 13902.5 | 669 | 662 | 188.4 |
| C | 15 | 158 | 649164 | 3442.74 | 669 | 662 | 188.4 |
| D | 10 | 172 | 1928355 | 8869.11 | 764 | 730 | 217.3 |
| D | 3 | 12 | 211963 | 971.9 | 764 | 730 | 217.3 |
| D | 3 | 224 | 132265 | 605.2 | 764 | 730 | 217.3 |
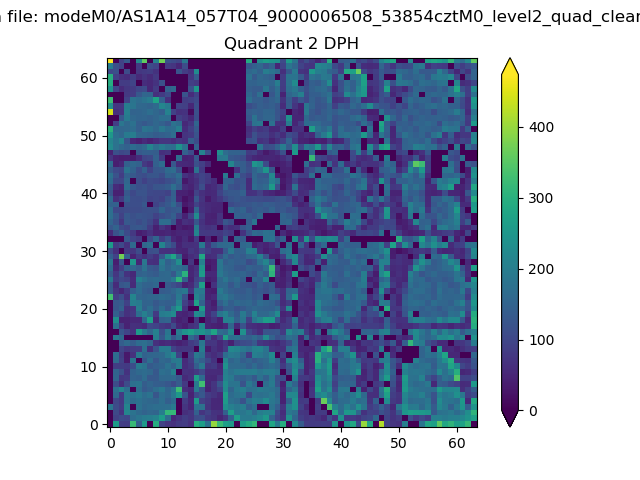
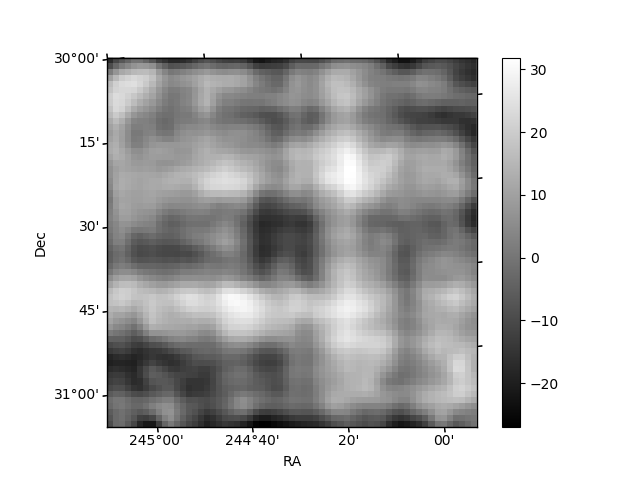
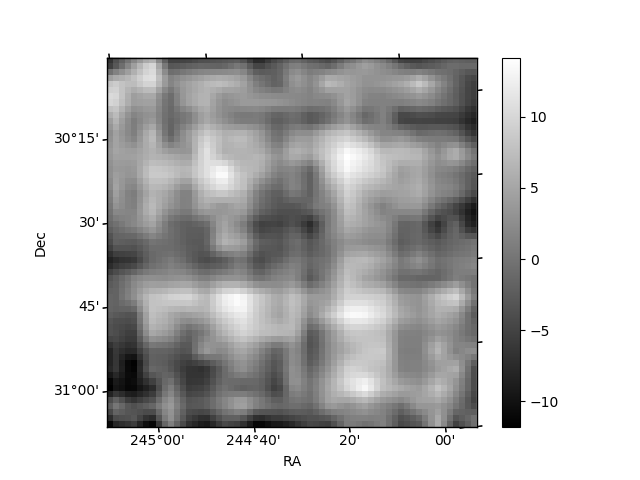
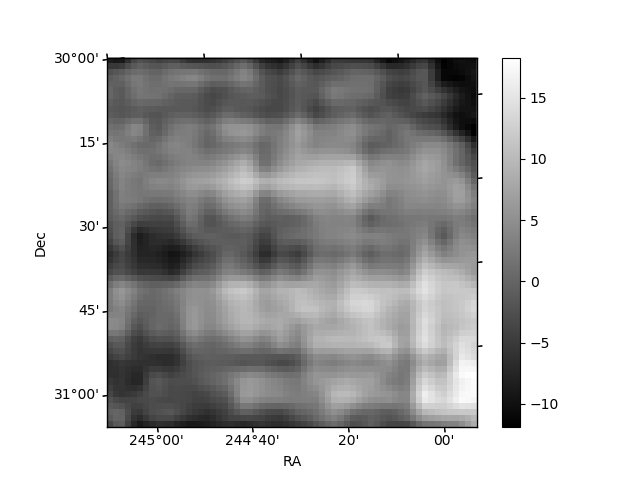
Histogram calculated using DETX and DETY for each event in the final _common_clean file
| Quadrant A | 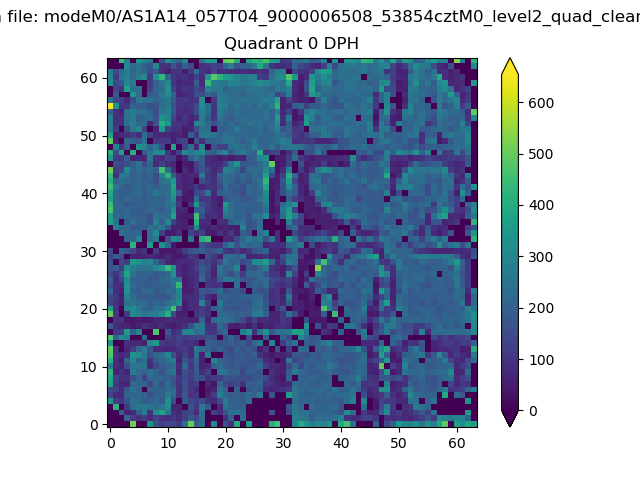 |
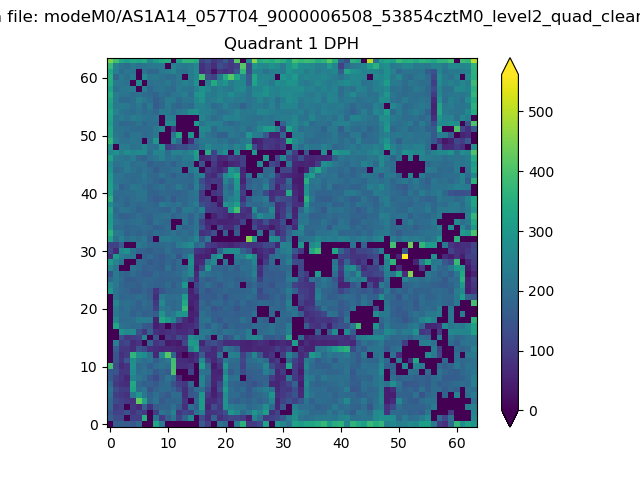 |
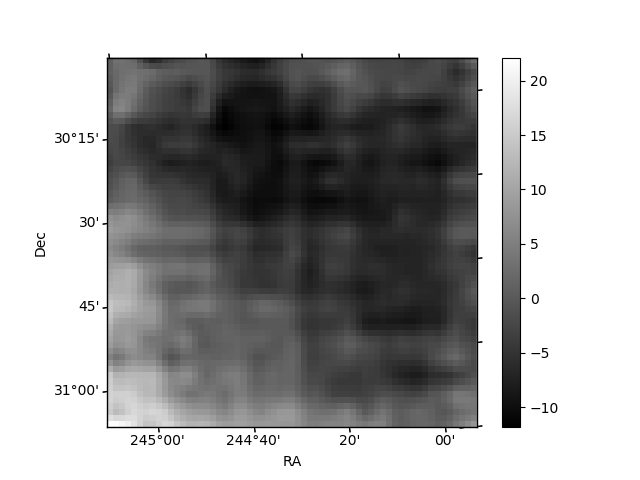
Quadrant B |
|---|---|---|---|
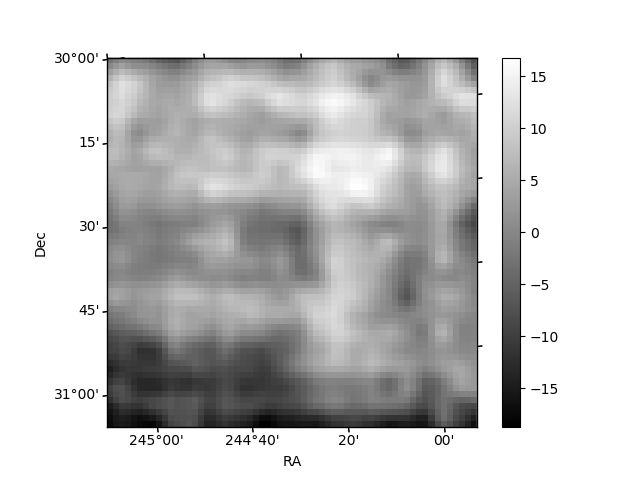
| Quadrant D | 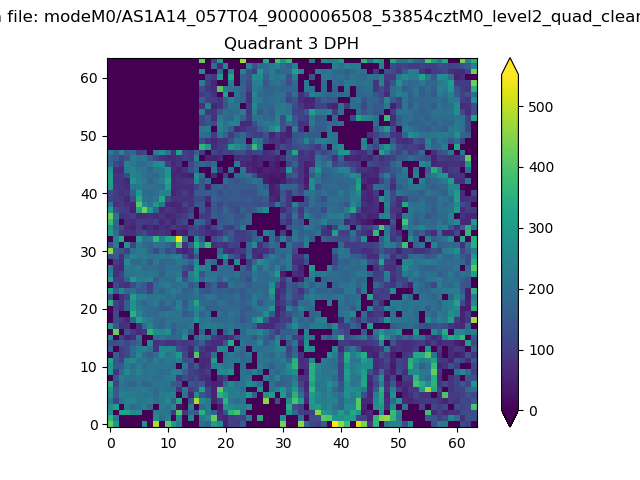 |
 |
Quadrant C |
| Plot type | Count rate plots | Images |
|---|---|---|
| Comparison with Poisson distribution Blue bars denote a histogram of data divided into 1 sec bins. Red curve is a Poisson curve with rate = median count rate of data. |
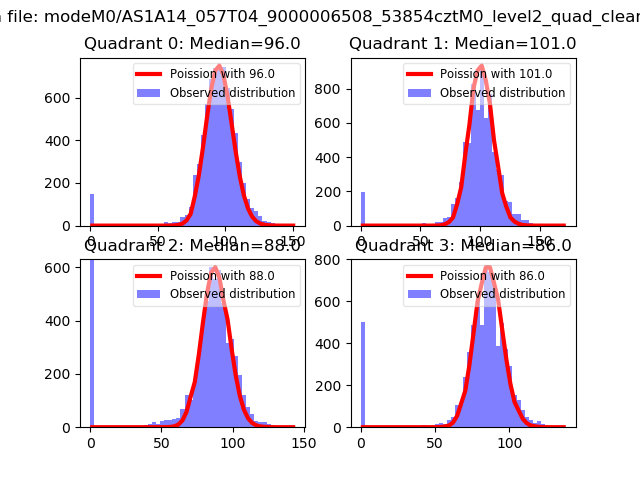 |
 |
| Quadrant-wise count rates Data is divided into 100 sec bins |
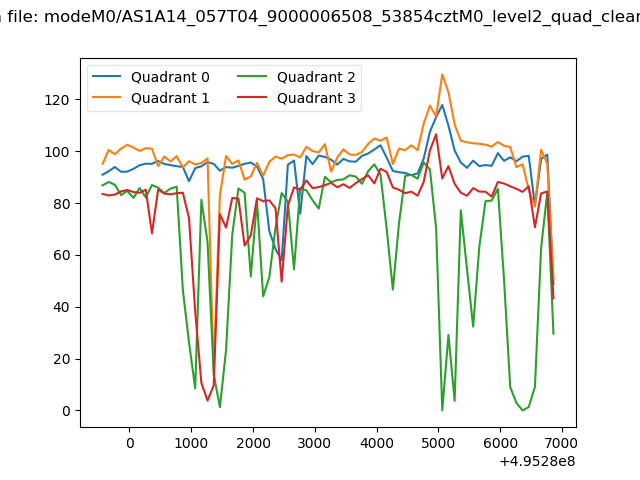 |
|
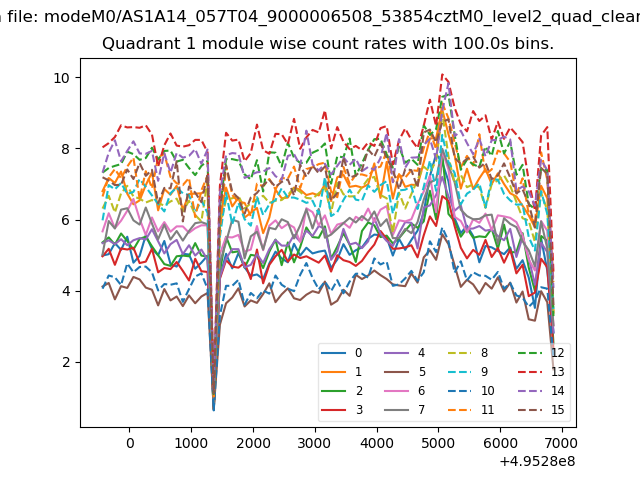
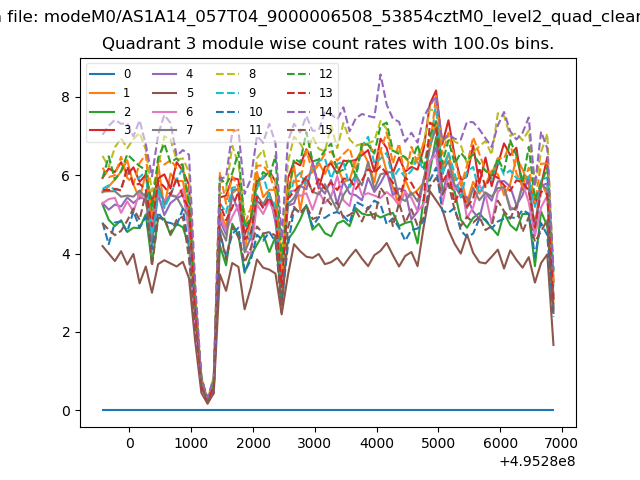
| Module-wise count rates for Quadrant A Data is divided into 100 sec bins |
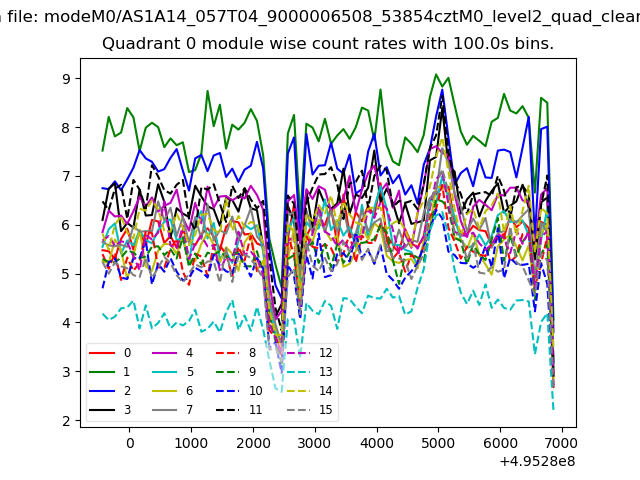 |
 |
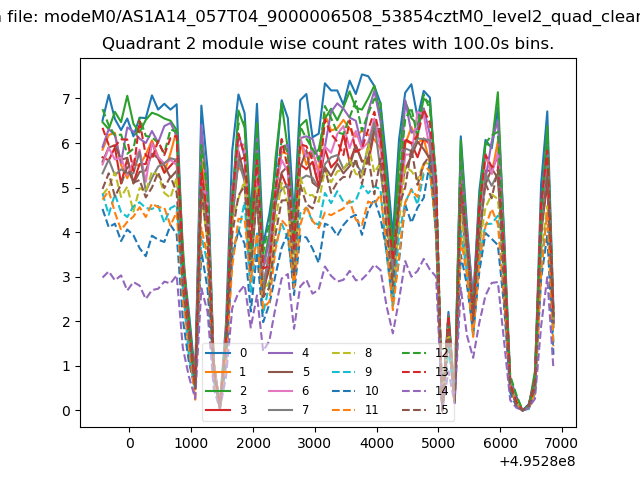
| Module-wise count rates for Quadrant B Data is divided into 100 sec bins |
 |
 |
| Module-wise count rates for Quadrant C Data is divided into 100 sec bins |
 |
 |
| Module-wise count rates for Quadrant D Data is divided into 100 sec bins |
 |
 |
| Parameter | Plot |
|---|---|
| CZT HV Monitor | 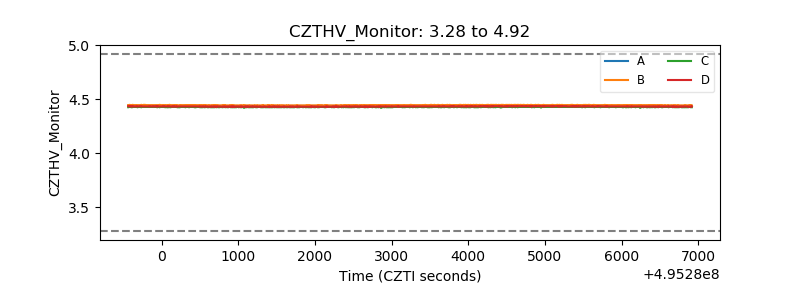 |
| D_VDD | 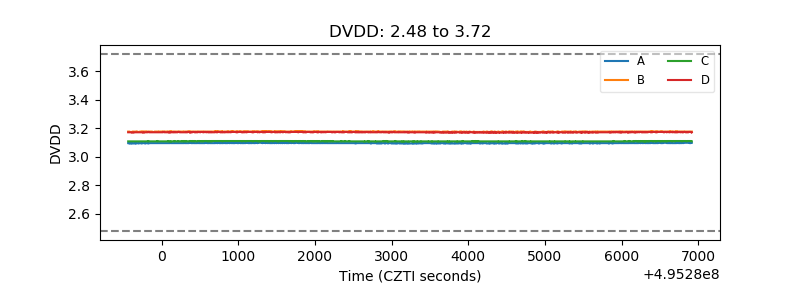 |
| Temperature 1 | 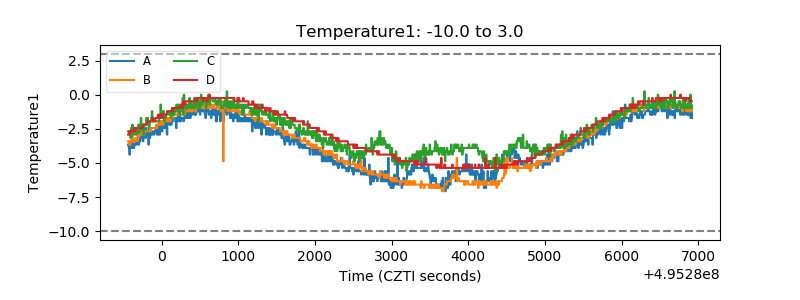 |
| Veto HV Monitor | 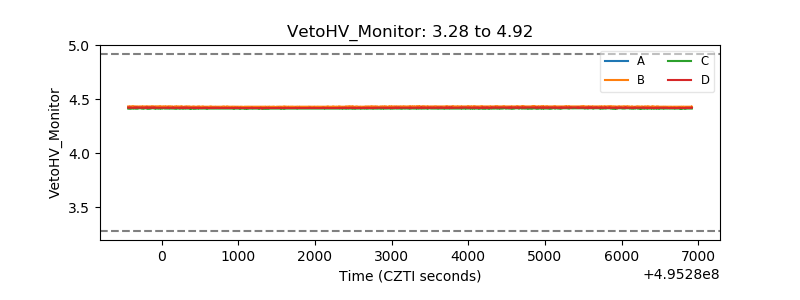 |
| Veto LLD | 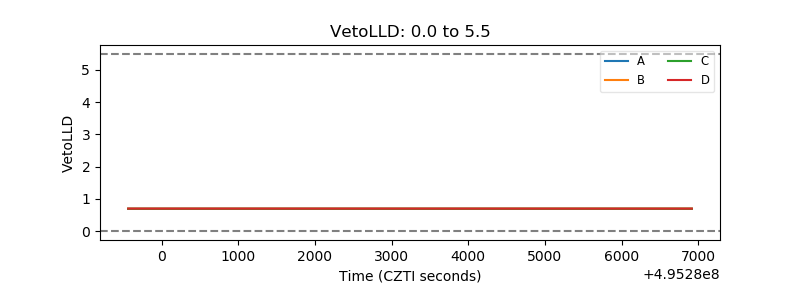 |
| Alpha Counter | 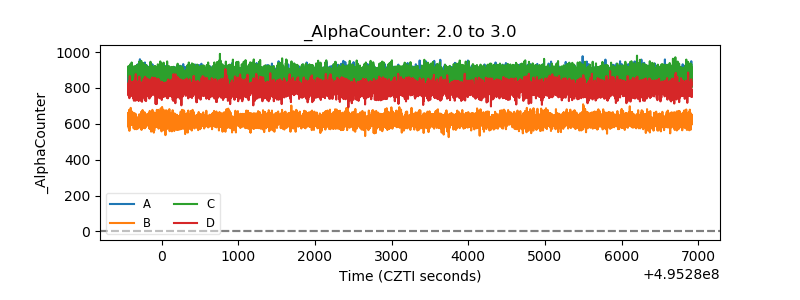 |
| _CPM_Rate | 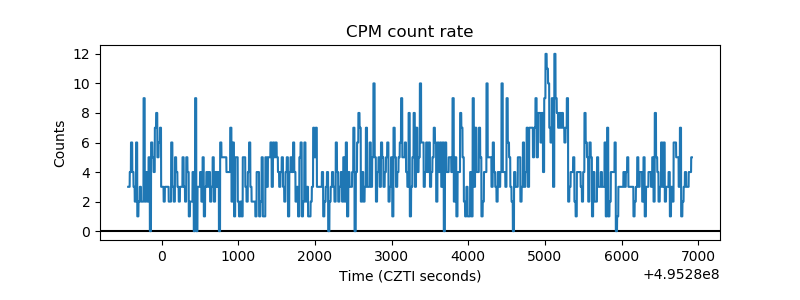 |
| CZT Counter | 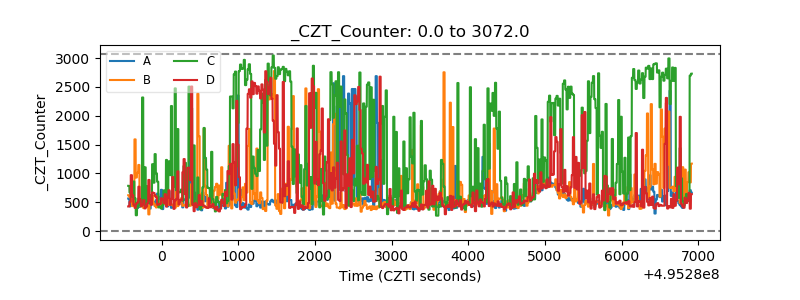 |
| +2.5 Volts monitor |  |
| +5 Volts monitor | 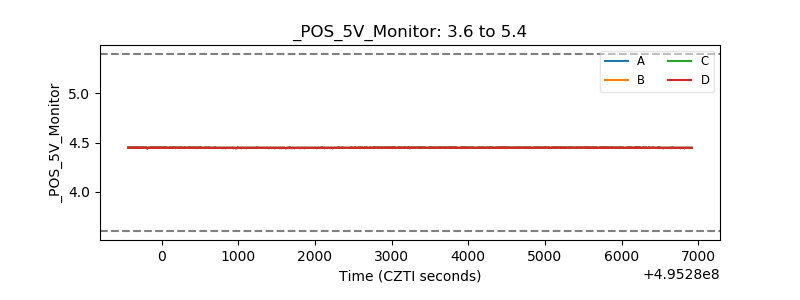 |
| _ROLL_ROT | 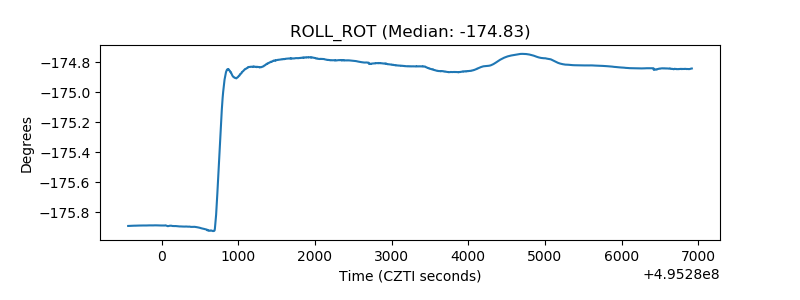 |
| _Roll_DEC | 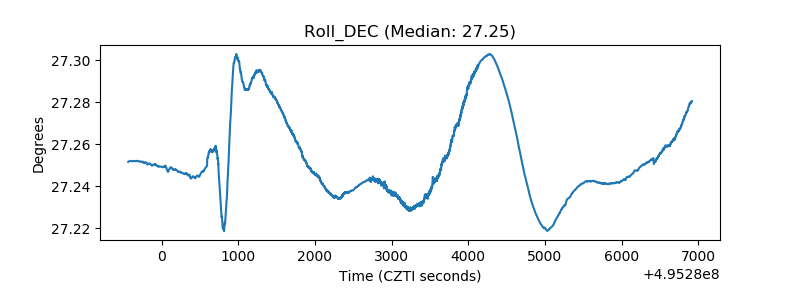 |
| _Roll_RA | 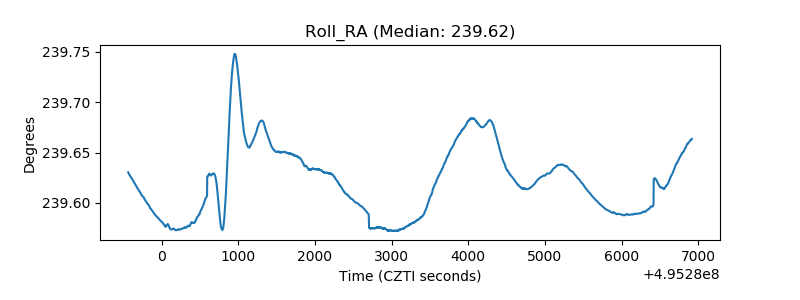 |
| Veto Counter |  |