| Param | Original file | Final file |
|---|---|---|
| Filename | modeM0/AS1A14_057T04_9000006508_53858cztM0_level2.fits | modeM0/AS1A14_057T04_9000006508_53858cztM0_level2_quad_clean.evt |
| Size (bytes) | 526,991,040 | 94,305,600 |
| Size | 502.6 MB | 89.9 MB |
| Events in quadrant A | 3,455,615 | 640,972 |
| Events in quadrant B | 3,945,799 | 666,439 |
| Events in quadrant C | 7,111,646 | 519,108 |
| Events in quadrant D | 4,480,223 | 566,762 |
| Mode M0 | |||
|---|---|---|---|
| Quadrant | BADHDUFLAG | Total packets | Discarded packets |
| A | 0 | 14661 | 1 |
| B | 0 | 16302 | 1 |
| C | 0 | 25705 | 1 |
| D | 0 | 17803 | 1 |
| Mode SS | |||
|---|---|---|---|
| Quadrant | BADHDUFLAG | Total packets | Discarded packets |
| A | 0 | 134 | 0 |
| B | 0 | 134 | 0 |
| C | 0 | 134 | 0 |
| D | 0 | 134 | 0 |
| Mode M9 | |||
|---|---|---|---|
| Quadrant | BADHDUFLAG | Total packets | Discarded packets |
| A | 0 | 10 | 0 |
| B | 0 | 10 | 0 |
| C | 0 | 10 | 0 |
| D | 0 | 10 | 0 |
| Quadrant | Total seconds | Saturated seconds | Saturation percentage |
|---|---|---|---|
| A | 6625 | 45 | 0.679245% |
| B | 6625 | 136 | 2.052830% |
| C | 6625 | 1128 | 17.026415% |
| D | 6626 | 188 | 2.837308% |
Noise dominated data is calculated using 1-second bins in cleaned event files. If a bin has >2000 counts, and if more than 50% of those come from <1% of pixels, then it is considered to be noise-dominated and hence unusable.
| Quadrant | # 1 sec bins | Bins with >0 counts | Bins with >2000 counts | High rate bins dominated by noise | Noise dominated (total time) | Noise dominated (detector-on time) | Marked lightcurve |
|---|---|---|---|---|---|---|---|
| A | 7610 | 6626 | 28 | 28 | 0.37% | 0.42% | 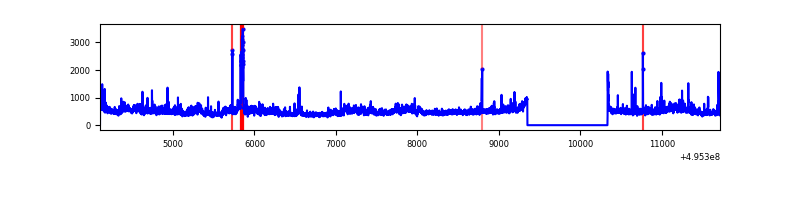 |
| B | 7610 | 6626 | 69 | 69 | 0.91% | 1.04% | 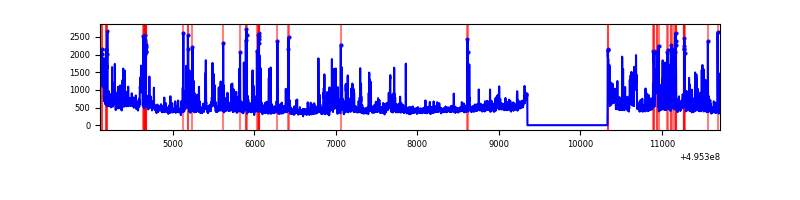 |
| C | 7610 | 6626 | 1050 | 1050 | 13.80% | 15.85% | 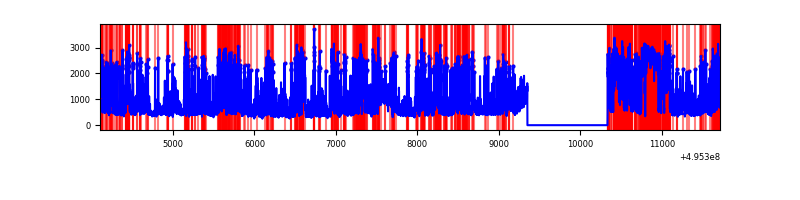 |
| D | 7611 | 6627 | 190 | 190 | 2.50% | 2.87% | 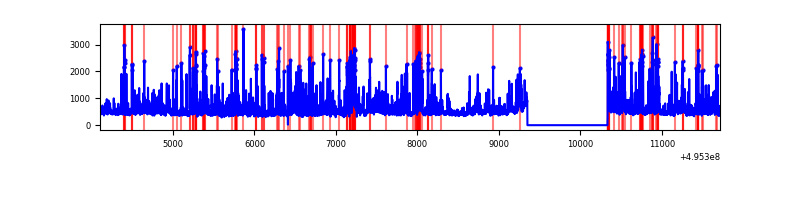 |
Top three noisy pixels from each quadrant. If the there are fewer than three noisy pixels in the level2.evt file, extra rows are filled as -1
| Pixel properties | Quadrant properties | ||||||
|---|---|---|---|---|---|---|---|
| Quadrant | DetID | PixID | Counts | Sigma | Mean | Median | Sigma |
| A | 8 | 249 | 449686 | 2565.26 | 706 | 688 | 175.0 |
| A | 15 | 174 | 111999 | 635.95 | 706 | 688 | 175.0 |
| A | 10 | 253 | 27142 | 151.14 | 706 | 688 | 175.0 |
| B | 0 | 213 | 321489 | 2162.13 | 697 | 673 | 148.4 |
| B | 5 | 185 | 320343 | 2154.41 | 697 | 673 | 148.4 |
| B | 5 | 172 | 276090 | 1856.16 | 697 | 673 | 148.4 |
| C | 15 | 224 | 2948609 | 16648.06 | 636 | 629 | 177.1 |
| C | 1 | 241 | 1229024 | 6937.09 | 636 | 629 | 177.1 |
| C | 15 | 158 | 159232 | 895.67 | 636 | 629 | 177.1 |
| D | 3 | 224 | 437492 | 2288.32 | 678 | 650 | 190.9 |
| D | 15 | 46 | 369192 | 1930.54 | 678 | 650 | 190.9 |
| D | 10 | 199 | 189705 | 990.33 | 678 | 650 | 190.9 |
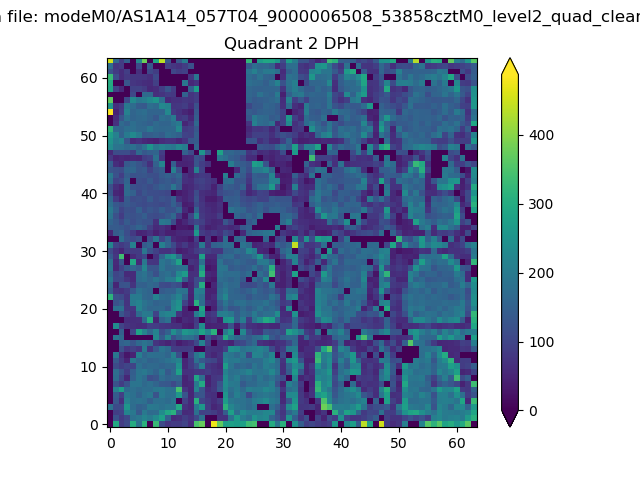
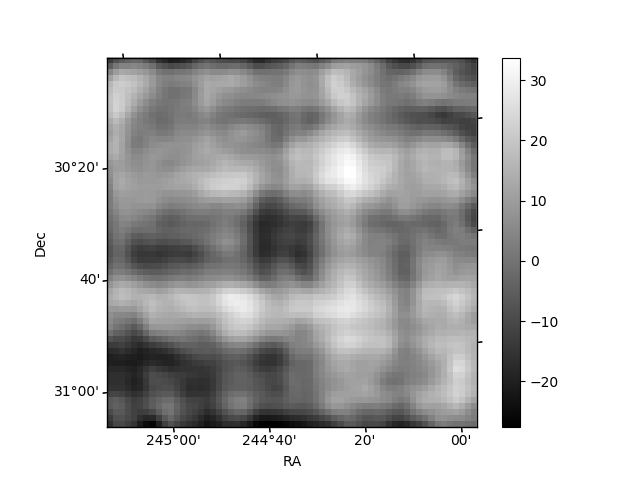
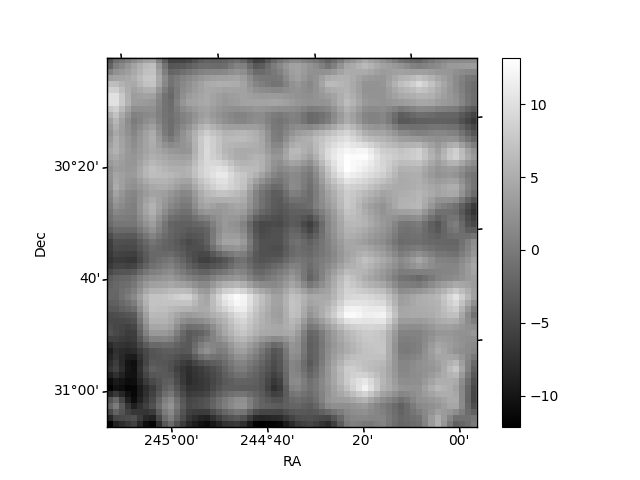
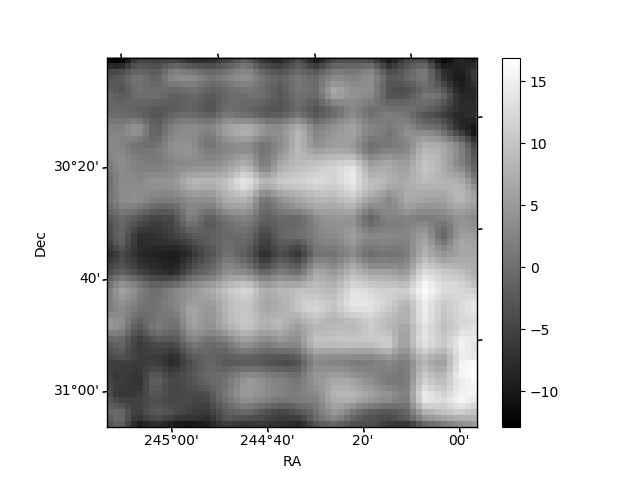
Histogram calculated using DETX and DETY for each event in the final _common_clean file
| Quadrant A | 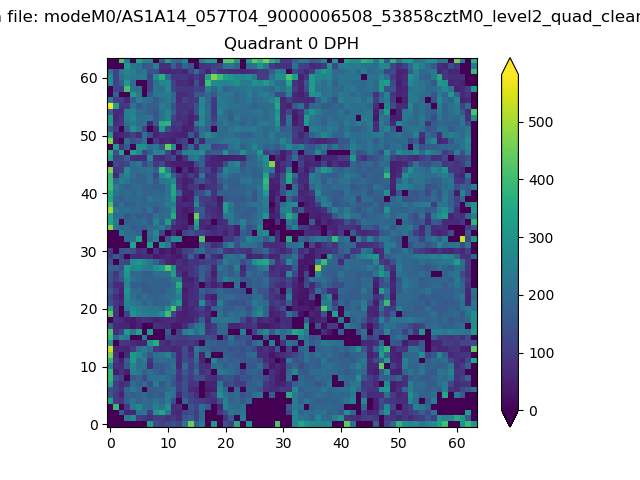 |
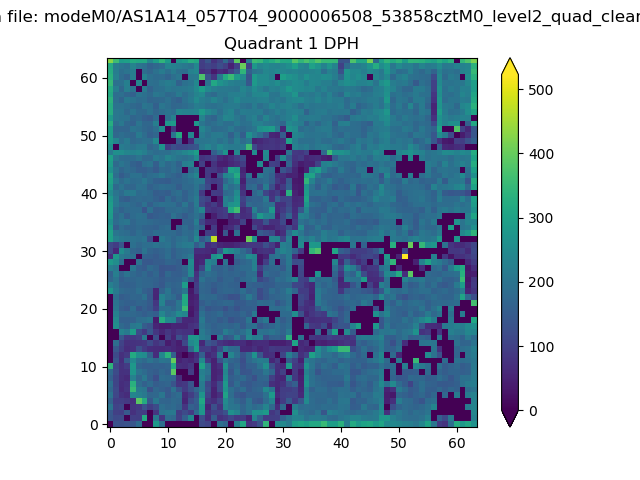 |
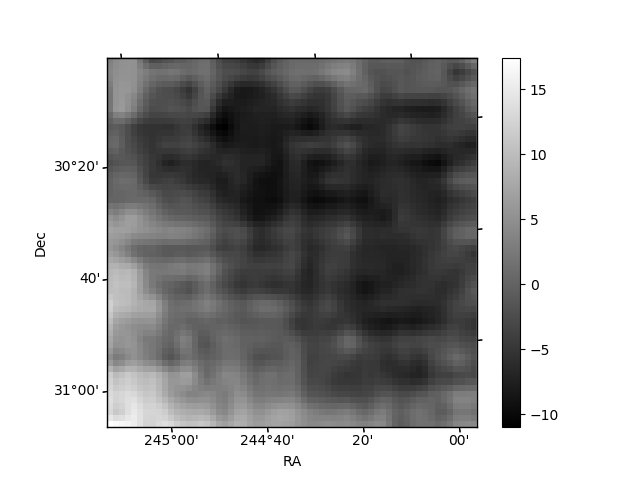
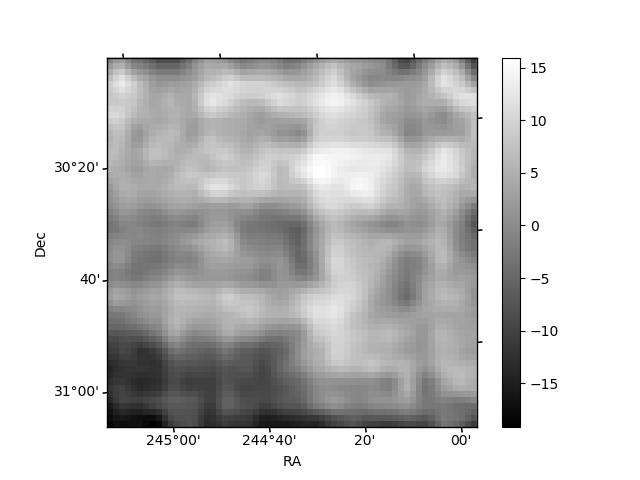
Quadrant B |
|---|---|---|---|
| Quadrant D | 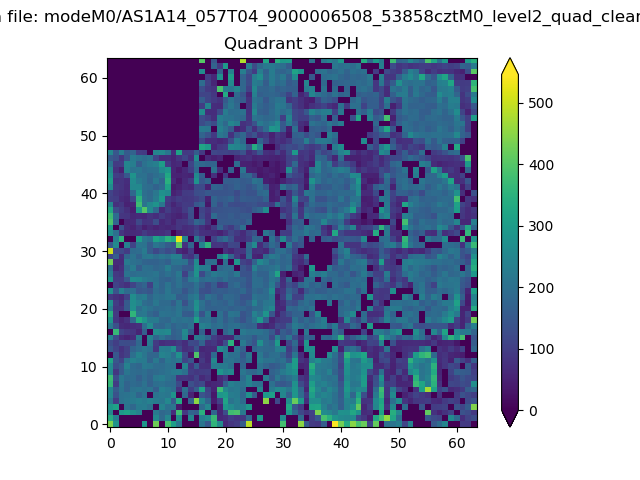 |
 |
Quadrant C |
| Plot type | Count rate plots | Images |
|---|---|---|
| Comparison with Poisson distribution Blue bars denote a histogram of data divided into 1 sec bins. Red curve is a Poisson curve with rate = median count rate of data. |
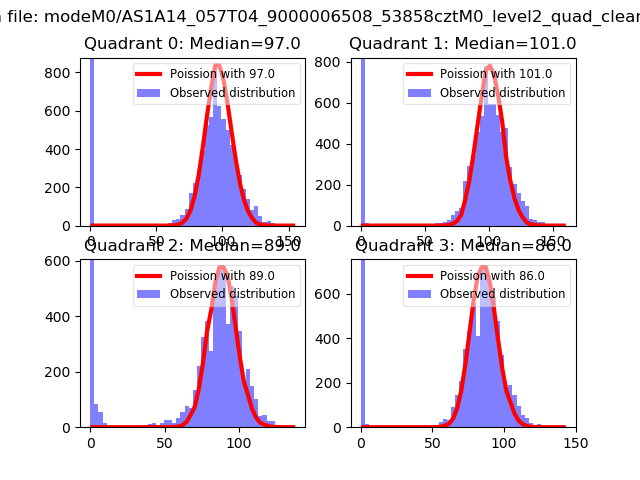 |
 |
| Quadrant-wise count rates Data is divided into 100 sec bins |
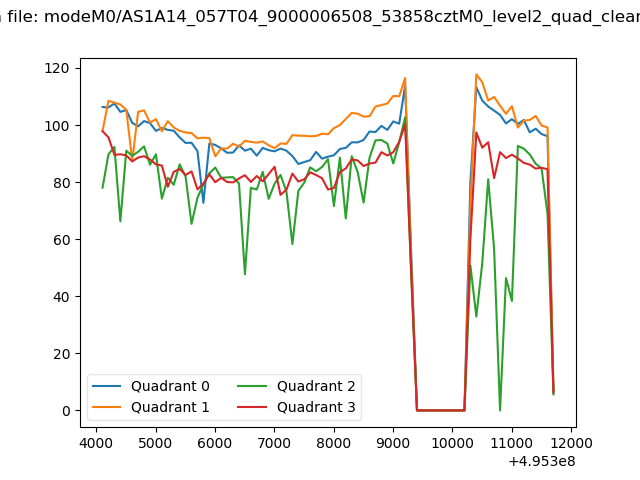 |
|
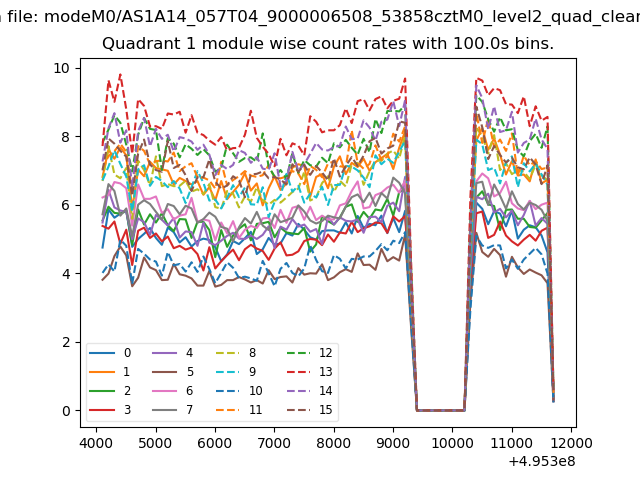
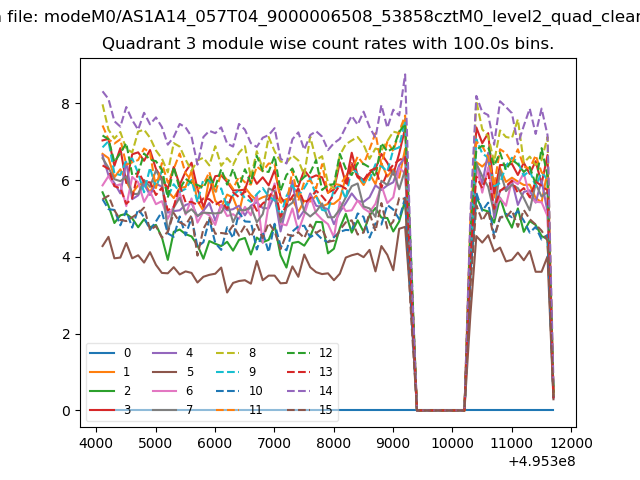
| Module-wise count rates for Quadrant A Data is divided into 100 sec bins |
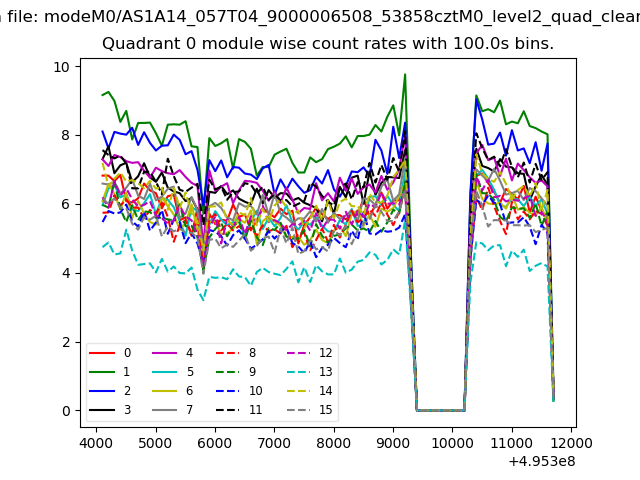 |
 |
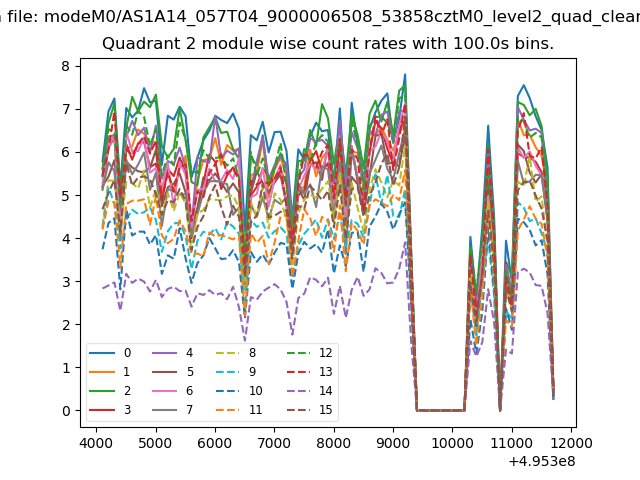
| Module-wise count rates for Quadrant B Data is divided into 100 sec bins |
 |
 |
| Module-wise count rates for Quadrant C Data is divided into 100 sec bins |
 |
 |
| Module-wise count rates for Quadrant D Data is divided into 100 sec bins |
 |
 |
| Parameter | Plot |
|---|---|
| CZT HV Monitor | 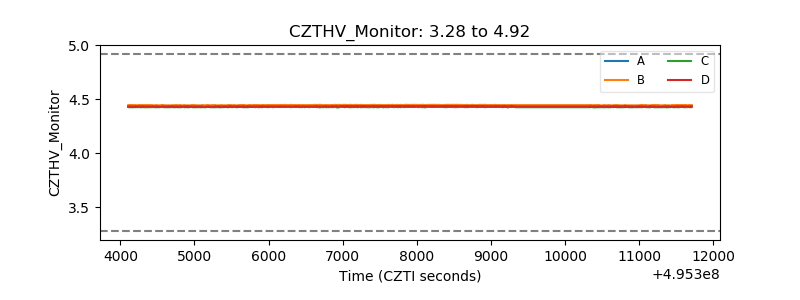 |
| D_VDD | 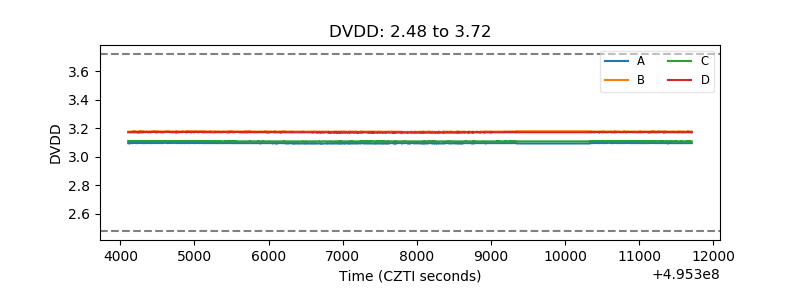 |
| Temperature 1 | 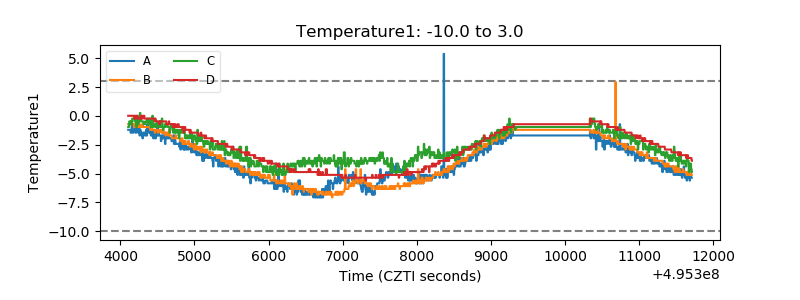 |
| Veto HV Monitor |  |
| Veto LLD | 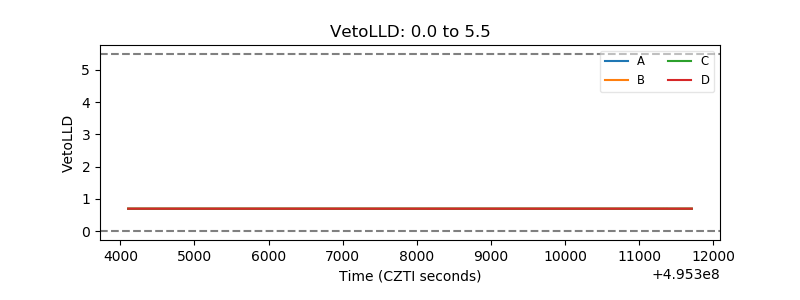 |
| Alpha Counter | 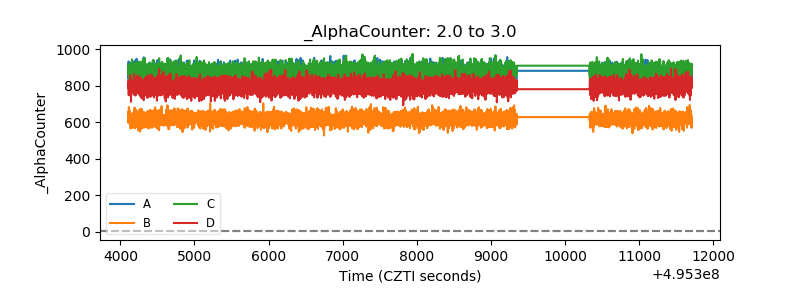 |
| _CPM_Rate | 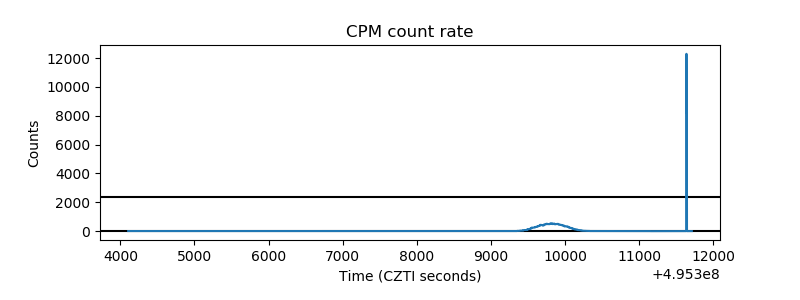 |
| CZT Counter | 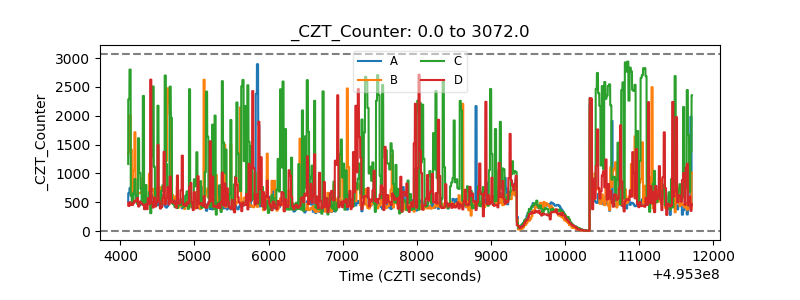 |
| +2.5 Volts monitor | 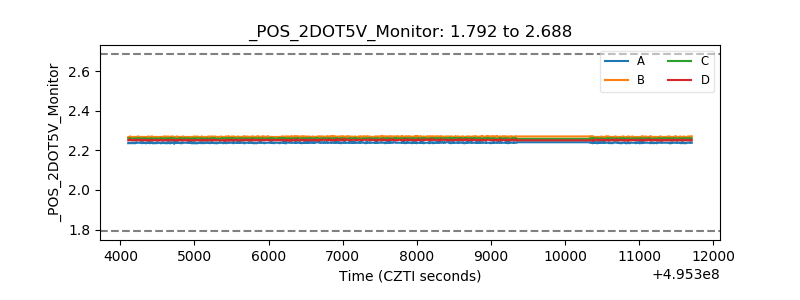 |
| +5 Volts monitor | 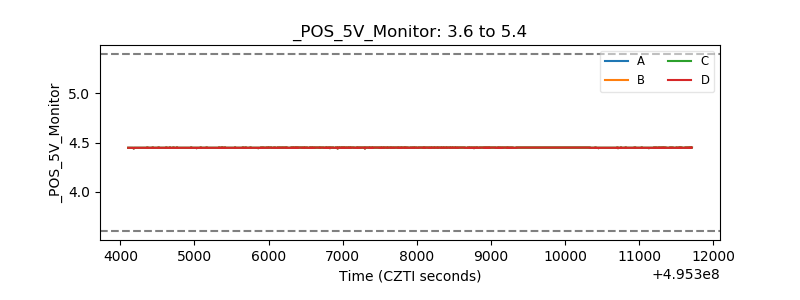 |
| _ROLL_ROT | 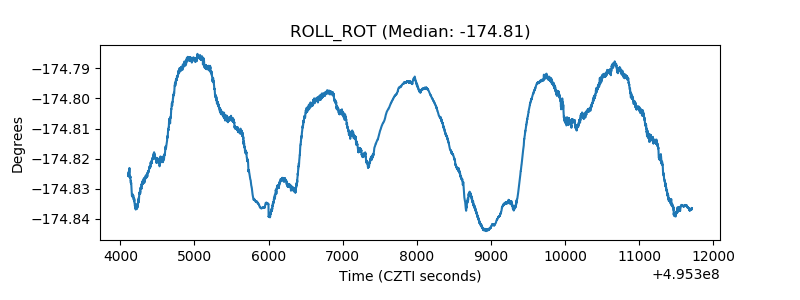 |
| _Roll_DEC | 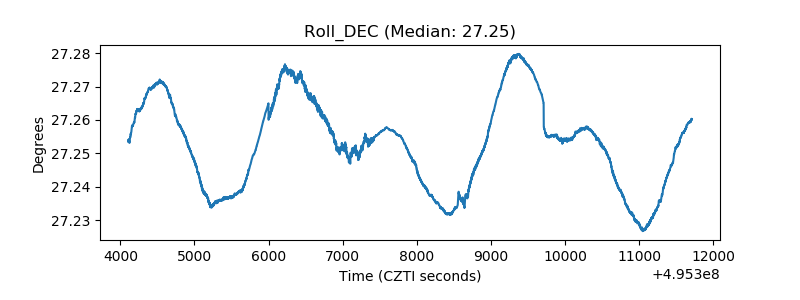 |
| _Roll_RA | 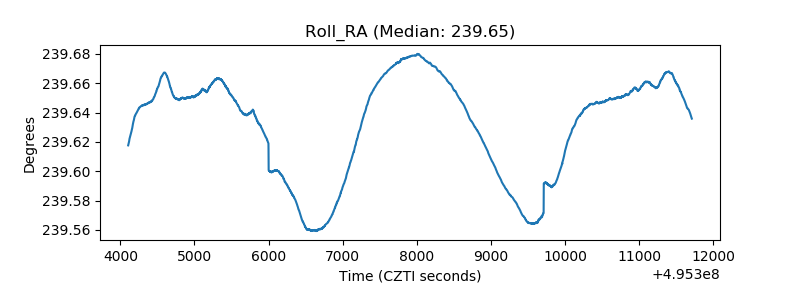 |
| Veto Counter | 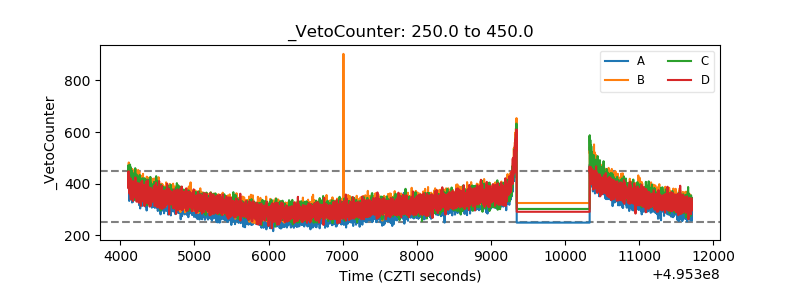 |