| Param | Original file | Final file |
|---|---|---|
| Filename | modeM0/AS1A14_057T04_9000006508_53860cztM0_level2.fits | modeM0/AS1A14_057T04_9000006508_53860cztM0_level2_quad_clean.evt |
| Size (bytes) | 549,633,600 | 89,153,280 |
| Size | 524.2 MB | 85.0 MB |
| Events in quadrant A | 3,755,806 | 615,135 |
| Events in quadrant B | 3,761,881 | 649,527 |
| Events in quadrant C | 8,349,681 | 442,494 |
| Events in quadrant D | 3,985,461 | 549,356 |
| Mode M0 | |||
|---|---|---|---|
| Quadrant | BADHDUFLAG | Total packets | Discarded packets |
| A | 0 | 15349 | 1 |
| B | 0 | 15587 | 1 |
| C | 0 | 29220 | 5 |
| D | 0 | 16222 | 1 |
| Mode SS | |||
|---|---|---|---|
| Quadrant | BADHDUFLAG | Total packets | Discarded packets |
| A | 0 | 128 | 0 |
| B | 0 | 128 | 0 |
| C | 0 | 128 | 0 |
| D | 0 | 128 | 0 |
| Mode M9 | |||
|---|---|---|---|
| Quadrant | BADHDUFLAG | Total packets | Discarded packets |
| A | 0 | 11 | 0 |
| B | 0 | 11 | 0 |
| C | 0 | 11 | 0 |
| D | 0 | 11 | 0 |
| Quadrant | Total seconds | Saturated seconds | Saturation percentage |
|---|---|---|---|
| A | 6348 | 113 | 1.780088% |
| B | 6349 | 141 | 2.220822% |
| C | 6348 | 1782 | 28.071834% |
| D | 6348 | 149 | 2.347196% |
Noise dominated data is calculated using 1-second bins in cleaned event files. If a bin has >2000 counts, and if more than 50% of those come from <1% of pixels, then it is considered to be noise-dominated and hence unusable.
| Quadrant | # 1 sec bins | Bins with >0 counts | Bins with >2000 counts | High rate bins dominated by noise | Noise dominated (total time) | Noise dominated (detector-on time) | Marked lightcurve |
|---|---|---|---|---|---|---|---|
| A | 7433 | 6349 | 94 | 94 | 1.26% | 1.48% | 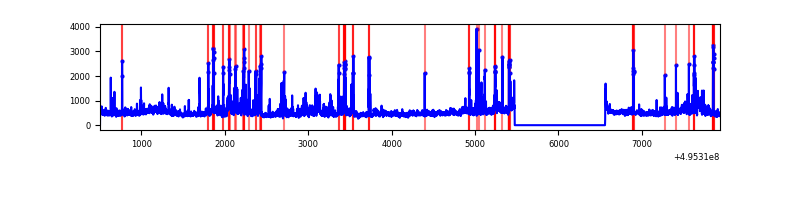 |
| B | 7434 | 6350 | 107 | 107 | 1.44% | 1.69% | 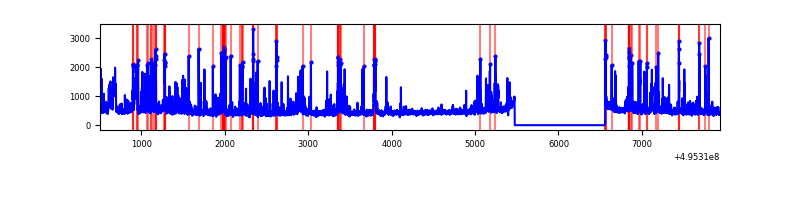 |
| C | 7433 | 6349 | 1805 | 1805 | 24.28% | 28.43% | 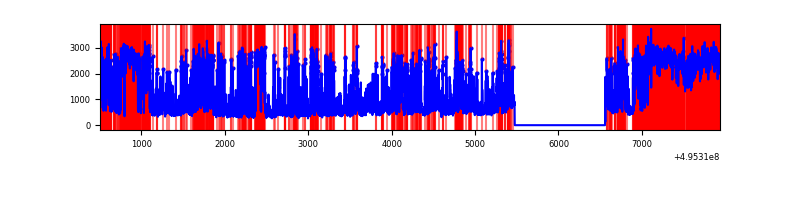 |
| D | 7433 | 6349 | 147 | 147 | 1.98% | 2.32% | 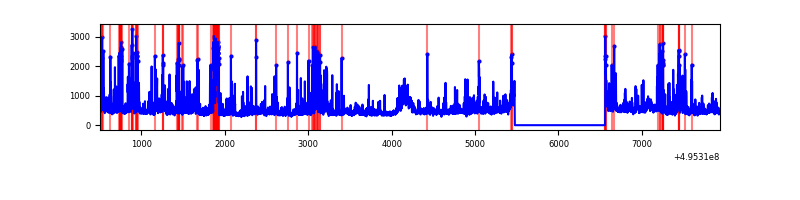 |
Top three noisy pixels from each quadrant. If the there are fewer than three noisy pixels in the level2.evt file, extra rows are filled as -1
| Pixel properties | Quadrant properties | ||||||
|---|---|---|---|---|---|---|---|
| Quadrant | DetID | PixID | Counts | Sigma | Mean | Median | Sigma |
| A | 8 | 249 | 479804 | 2862.55 | 676 | 659 | 167.4 |
| A | 0 | 8 | 315669 | 1881.96 | 676 | 659 | 167.4 |
| A | 15 | 174 | 163738 | 974.28 | 676 | 659 | 167.4 |
| B | 5 | 185 | 352720 | 2485.04 | 672 | 652 | 141.7 |
| B | 0 | 213 | 291247 | 2051.14 | 672 | 652 | 141.7 |
| B | 0 | 171 | 123791 | 869.17 | 672 | 652 | 141.7 |
| C | 1 | 241 | 3285586 | 20210.46 | 584 | 578 | 162.5 |
| C | 15 | 224 | 2328975 | 14325.07 | 584 | 578 | 162.5 |
| C | 13 | 3 | 191150 | 1172.46 | 584 | 578 | 162.5 |
| D | 3 | 224 | 394808 | 2124.35 | 653 | 624 | 185.6 |
| D | 3 | 12 | 224265 | 1205.26 | 653 | 624 | 185.6 |
| D | 2 | 249 | 185226 | 994.87 | 653 | 624 | 185.6 |
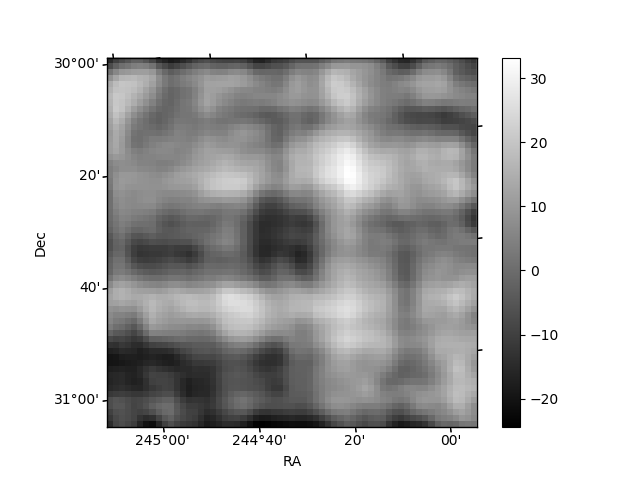
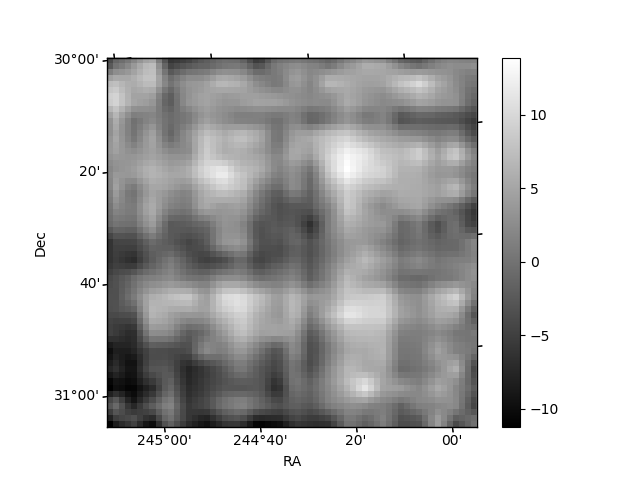
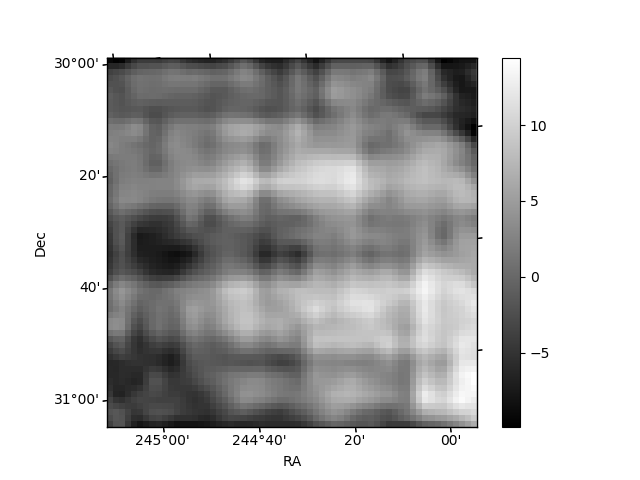
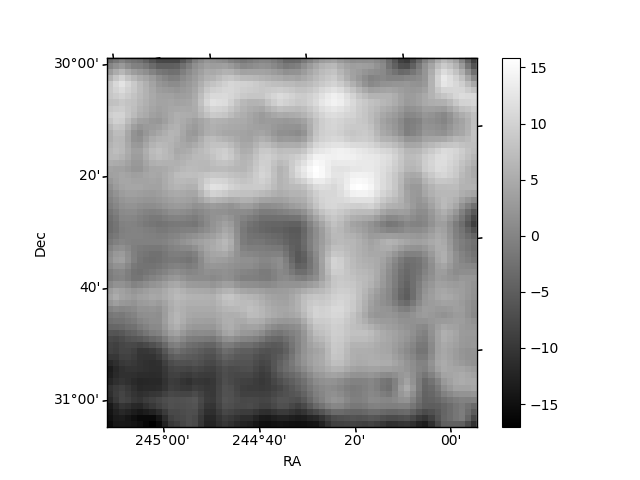
Histogram calculated using DETX and DETY for each event in the final _common_clean file
| Quadrant A | 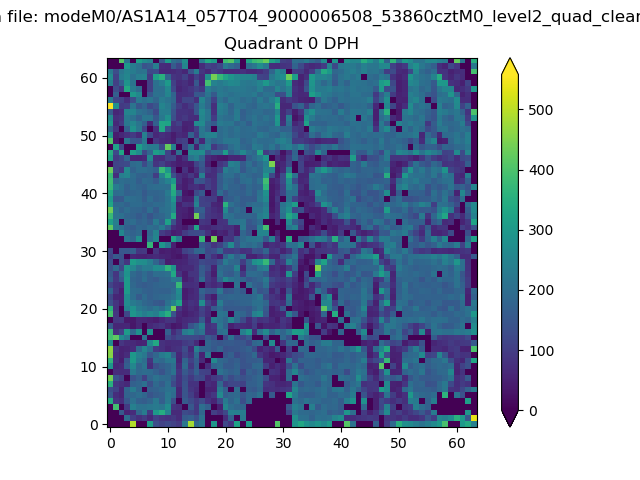 |
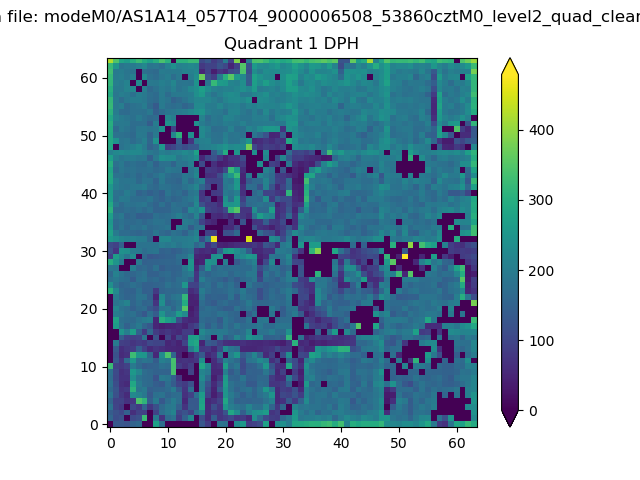 |
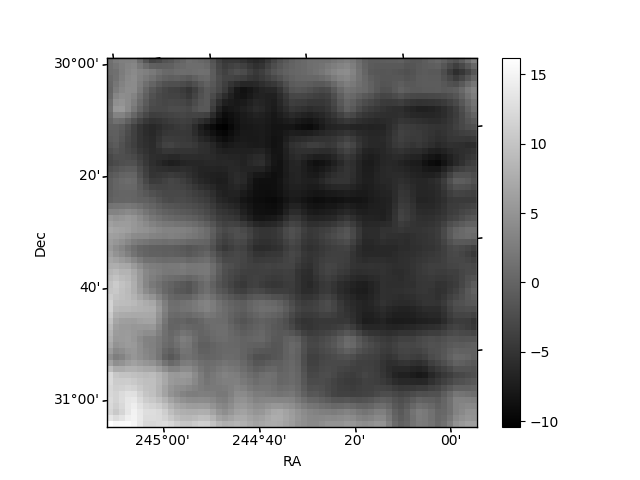
Quadrant B |
|---|---|---|---|
| Quadrant D | 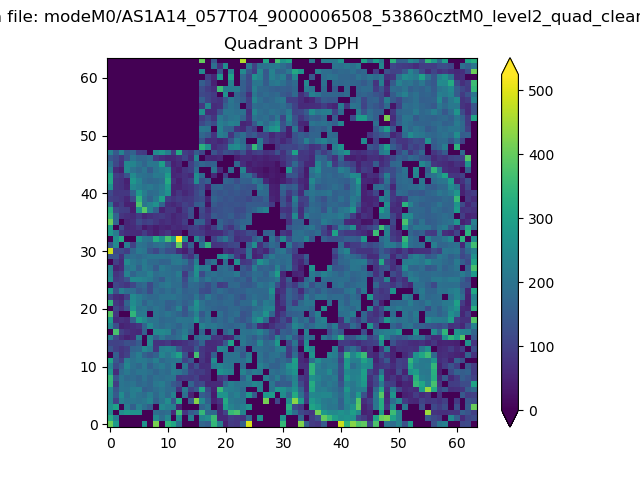 |
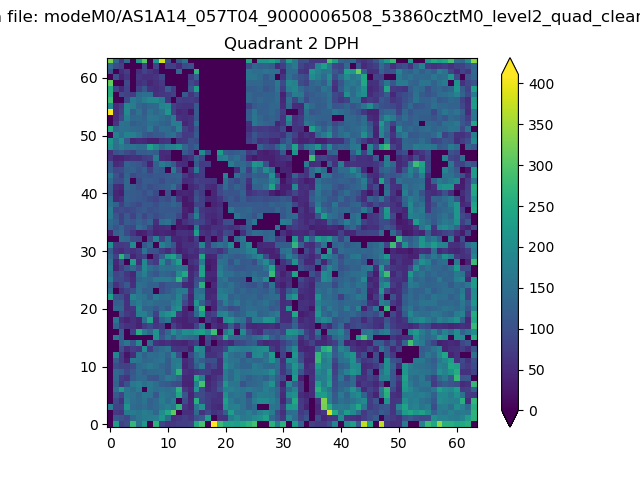 |
Quadrant C |
| Plot type | Count rate plots | Images |
|---|---|---|
| Comparison with Poisson distribution Blue bars denote a histogram of data divided into 1 sec bins. Red curve is a Poisson curve with rate = median count rate of data. |
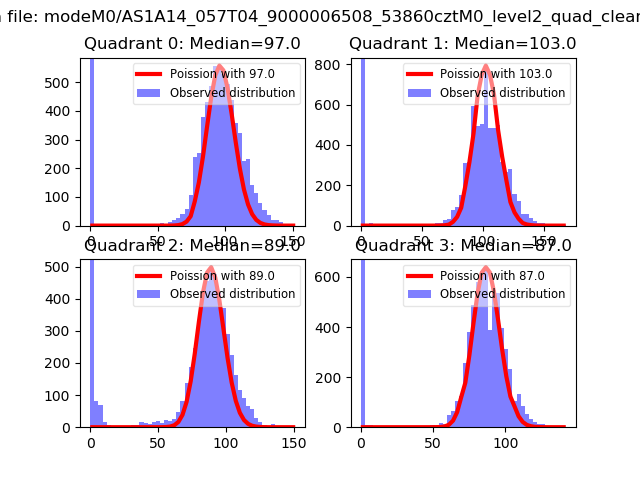 |
 |
| Quadrant-wise count rates Data is divided into 100 sec bins |
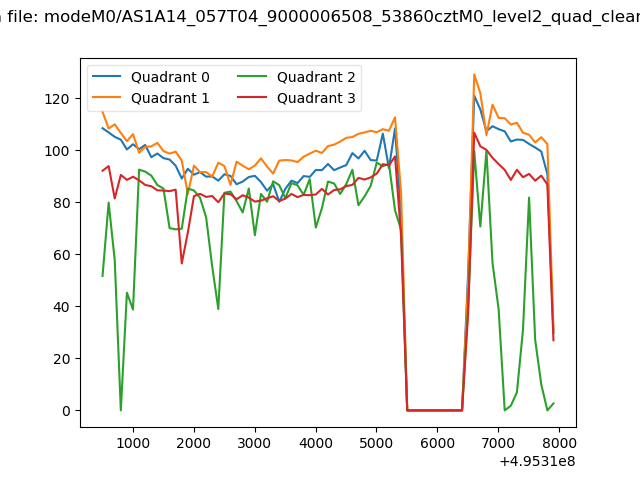 |
|
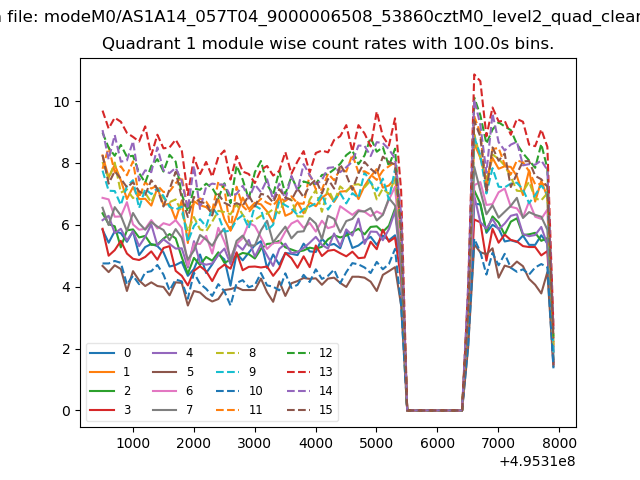
| Module-wise count rates for Quadrant A Data is divided into 100 sec bins |
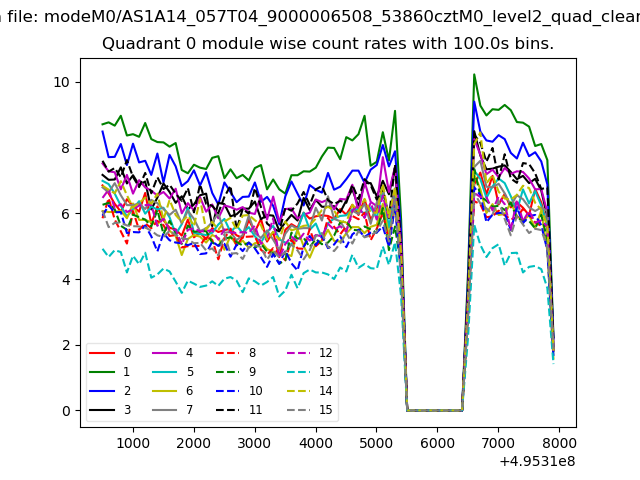 |
 |
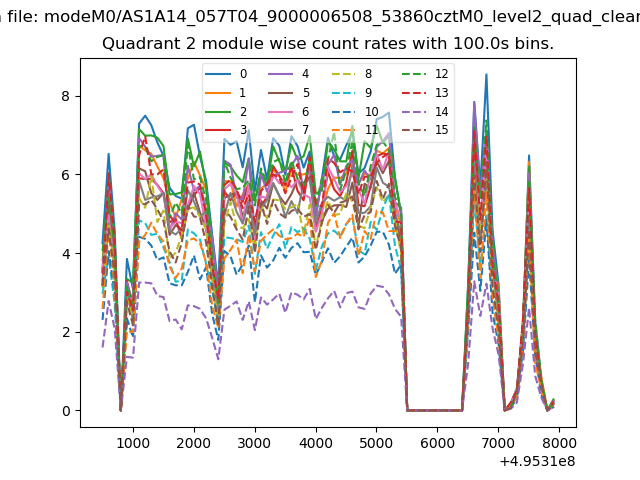
| Module-wise count rates for Quadrant B Data is divided into 100 sec bins |
 |
 |
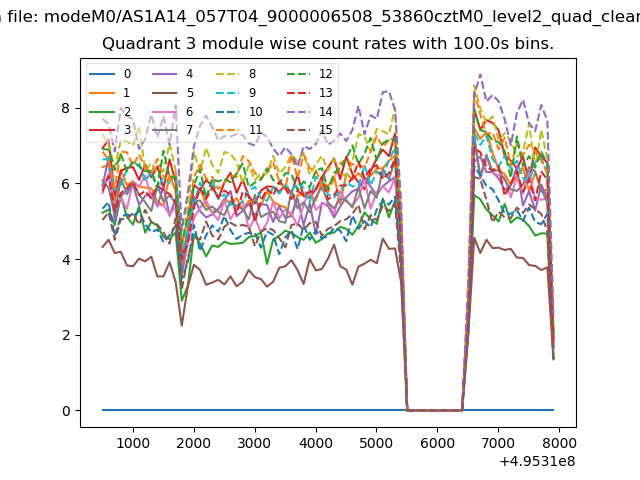
| Module-wise count rates for Quadrant C Data is divided into 100 sec bins |
 |
 |
| Module-wise count rates for Quadrant D Data is divided into 100 sec bins |
 |
 |
| Parameter | Plot |
|---|---|
| CZT HV Monitor | 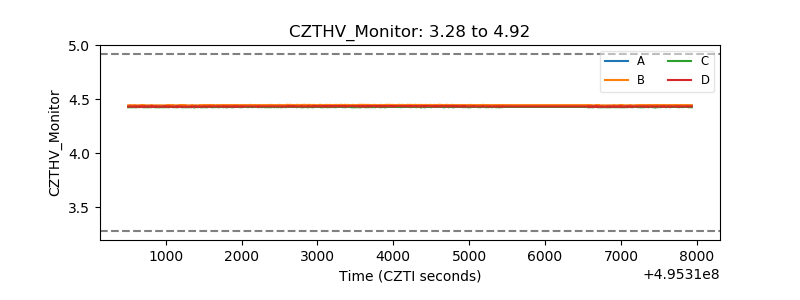 |
| D_VDD | 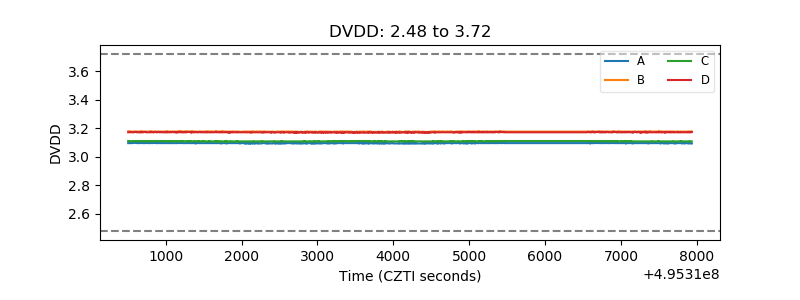 |
| Temperature 1 | 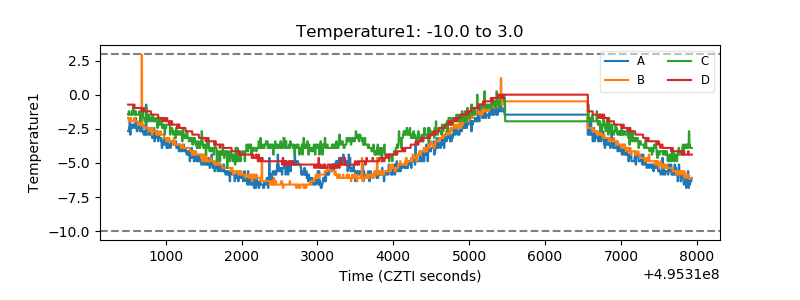 |
| Veto HV Monitor | 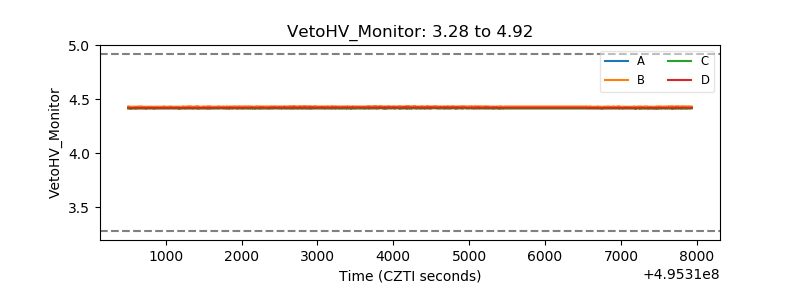 |
| Veto LLD | 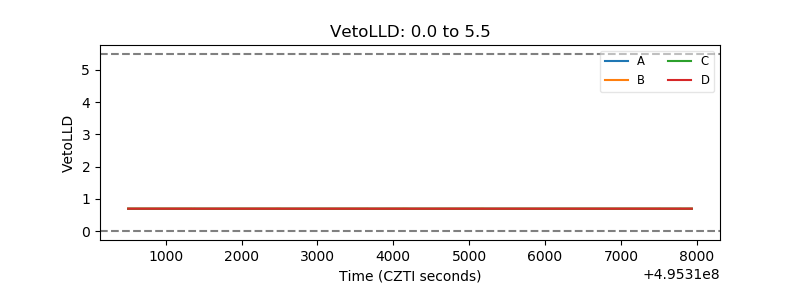 |
| Alpha Counter | 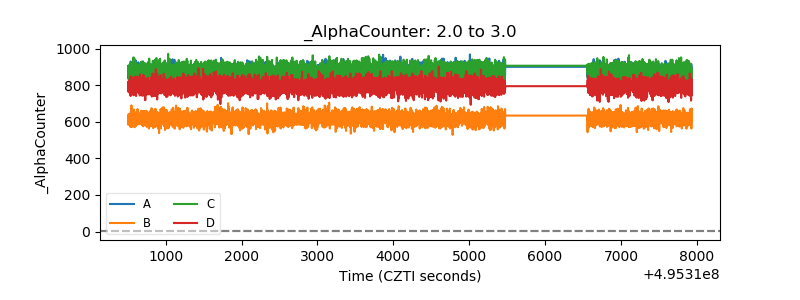 |
| _CPM_Rate | 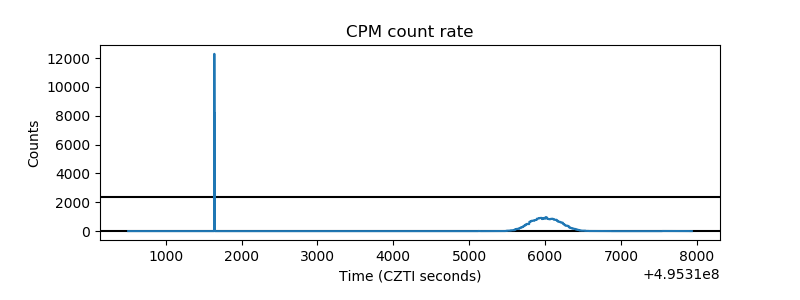 |
| CZT Counter | 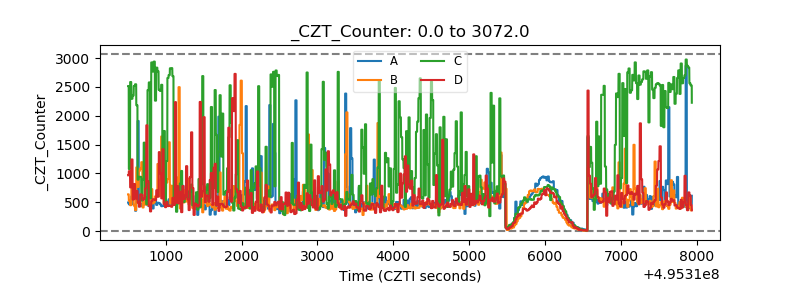 |
| +2.5 Volts monitor | 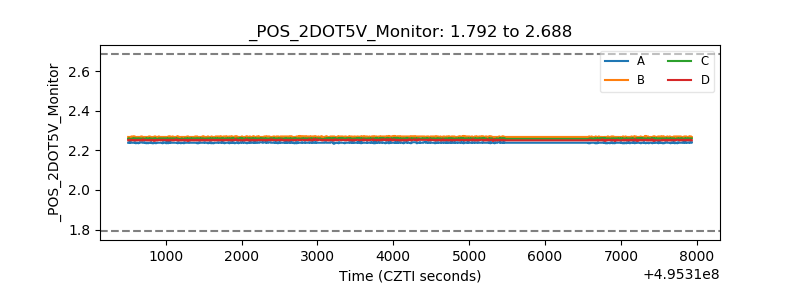 |
| +5 Volts monitor | 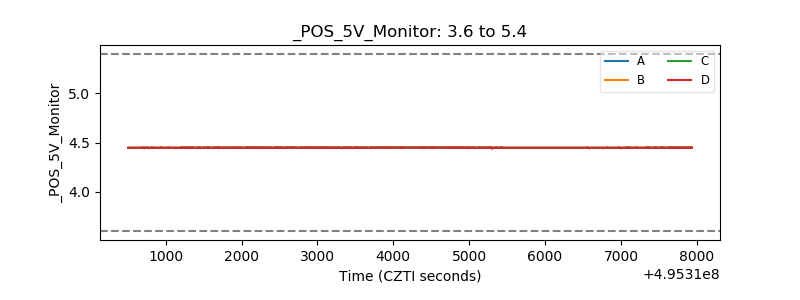 |
| _ROLL_ROT | 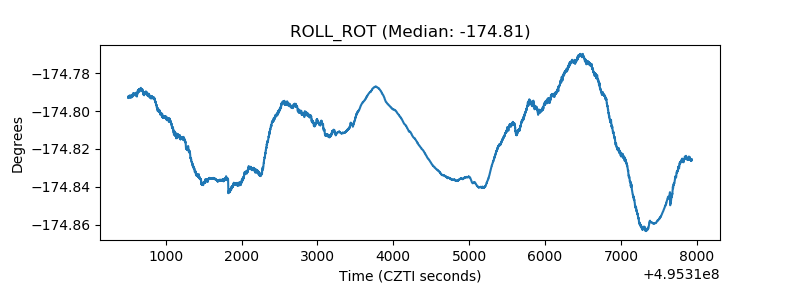 |
| _Roll_DEC | 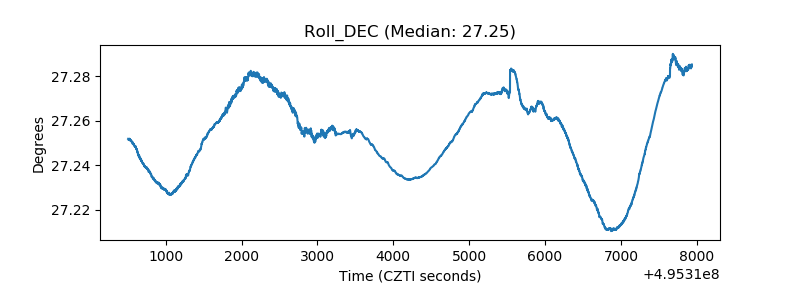 |
| _Roll_RA | 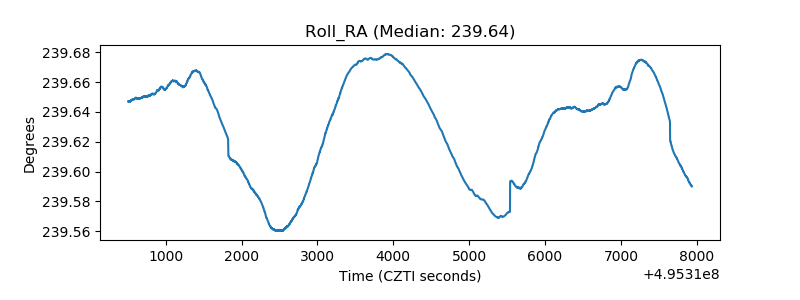 |
| Veto Counter | 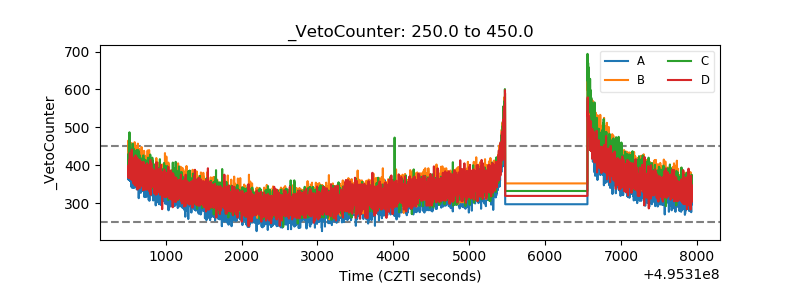 |