| Param | Original file | Final file |
|---|---|---|
| Filename | modeM0/AS1A14_057T04_9000006508_53862cztM0_level2.fits | modeM0/AS1A14_057T04_9000006508_53862cztM0_level2_quad_clean.evt |
| Size (bytes) | 610,234,560 | 95,728,320 |
| Size | 582.0 MB | 91.3 MB |
| Events in quadrant A | 3,805,464 | 669,375 |
| Events in quadrant B | 3,814,071 | 725,769 |
| Events in quadrant C | 7,924,733 | 513,410 |
| Events in quadrant D | 6,525,742 | 523,172 |
| Mode M0 | |||
|---|---|---|---|
| Quadrant | BADHDUFLAG | Total packets | Discarded packets |
| A | 0 | 15829 | 2 |
| B | 0 | 15855 | 2 |
| C | 0 | 28137 | 2 |
| D | 0 | 24223 | 3 |
| Mode SS | |||
|---|---|---|---|
| Quadrant | BADHDUFLAG | Total packets | Discarded packets |
| A | 0 | 138 | 0 |
| B | 0 | 138 | 0 |
| C | 0 | 138 | 0 |
| D | 0 | 138 | 0 |
| Mode M9 | |||
|---|---|---|---|
| Quadrant | BADHDUFLAG | Total packets | Discarded packets |
| A | 0 | 20 | 0 |
| B | 0 | 21 | 0 |
| C | 0 | 21 | 0 |
| D | 0 | 21 | 0 |
| Quadrant | Total seconds | Saturated seconds | Saturation percentage |
|---|---|---|---|
| A | 6690 | 214 | 3.198804% |
| B | 6690 | 112 | 1.674141% |
| C | 6690 | 1543 | 23.064275% |
| D | 6689 | 1042 | 15.577814% |
Noise dominated data is calculated using 1-second bins in cleaned event files. If a bin has >2000 counts, and if more than 50% of those come from <1% of pixels, then it is considered to be noise-dominated and hence unusable.
| Quadrant | # 1 sec bins | Bins with >0 counts | Bins with >2000 counts | High rate bins dominated by noise | Noise dominated (total time) | Noise dominated (detector-on time) | Marked lightcurve |
|---|---|---|---|---|---|---|---|
| A | 7880 | 6691 | 159 | 159 | 2.02% | 2.38% | 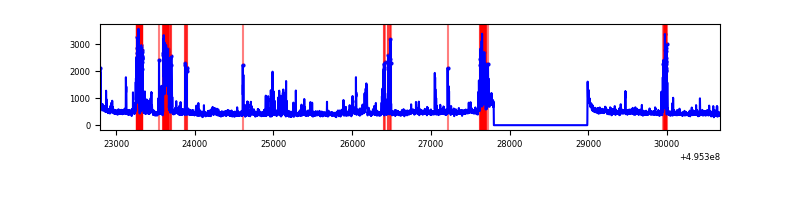 |
| B | 7880 | 6691 | 28 | 28 | 0.36% | 0.42% | 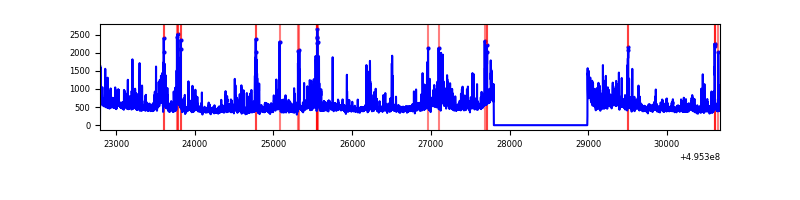 |
| C | 7880 | 6691 | 1471 | 1471 | 18.67% | 21.98% | 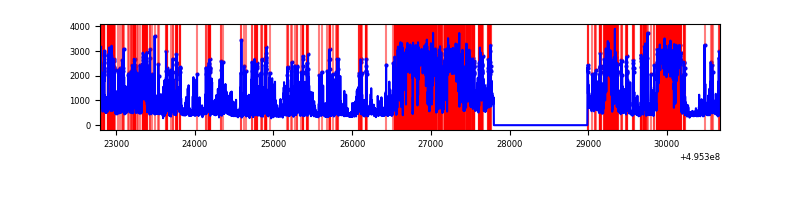 |
| D | 7879 | 6690 | 1013 | 1013 | 12.86% | 15.14% | 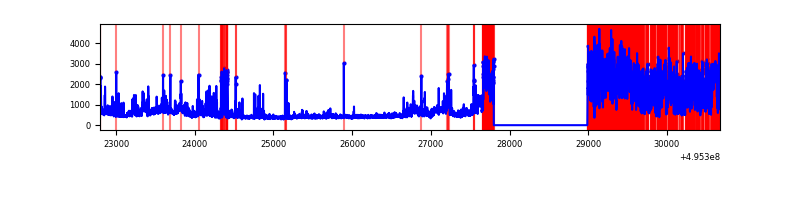 |
Top three noisy pixels from each quadrant. If the there are fewer than three noisy pixels in the level2.evt file, extra rows are filled as -1
| Pixel properties | Quadrant properties | ||||||
|---|---|---|---|---|---|---|---|
| Quadrant | DetID | PixID | Counts | Sigma | Mean | Median | Sigma |
| A | 0 | 8 | 332353 | 1807.36 | 742 | 724 | 183.5 |
| A | 4 | 249 | 198217 | 1076.33 | 742 | 724 | 183.5 |
| A | 3 | 62 | 84802 | 458.22 | 742 | 724 | 183.5 |
| B | 4 | 170 | 263492 | 1653.17 | 742 | 715 | 159.0 |
| B | 5 | 185 | 130828 | 818.56 | 742 | 715 | 159.0 |
| B | 0 | 171 | 123269 | 771.01 | 742 | 715 | 159.0 |
| C | 1 | 241 | 3176337 | 17773.14 | 639 | 634 | 178.7 |
| C | 15 | 224 | 1693356 | 9473.49 | 639 | 634 | 178.7 |
| C | 13 | 3 | 295655 | 1651.11 | 639 | 634 | 178.7 |
| D | 8 | 176 | 2992841 | 15787.32 | 656 | 625 | 189.5 |
| D | 2 | 249 | 373345 | 1966.52 | 656 | 625 | 189.5 |
| D | 15 | 203 | 134473 | 706.2 | 656 | 625 | 189.5 |
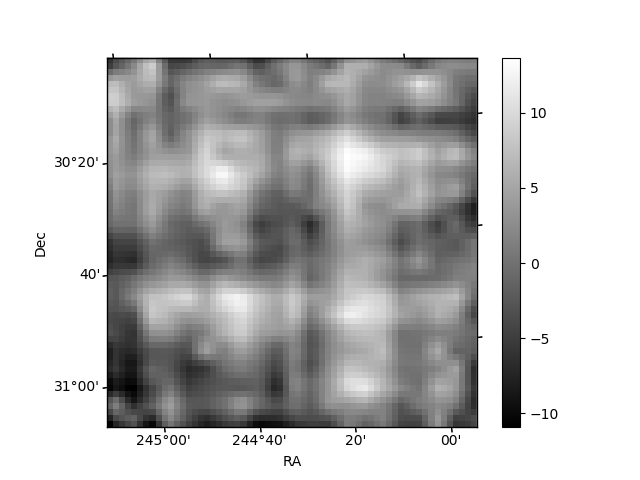
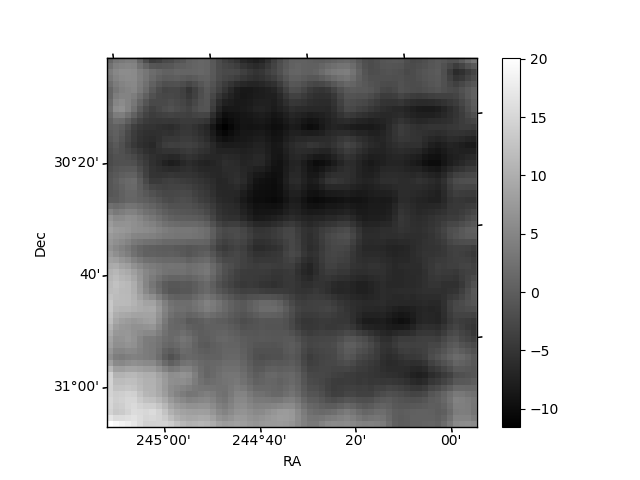
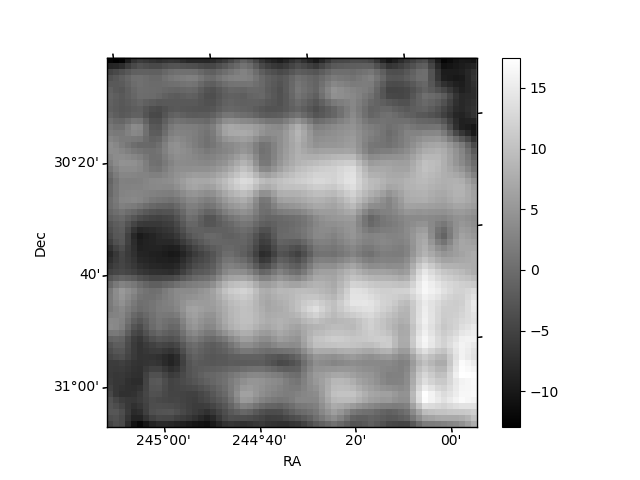
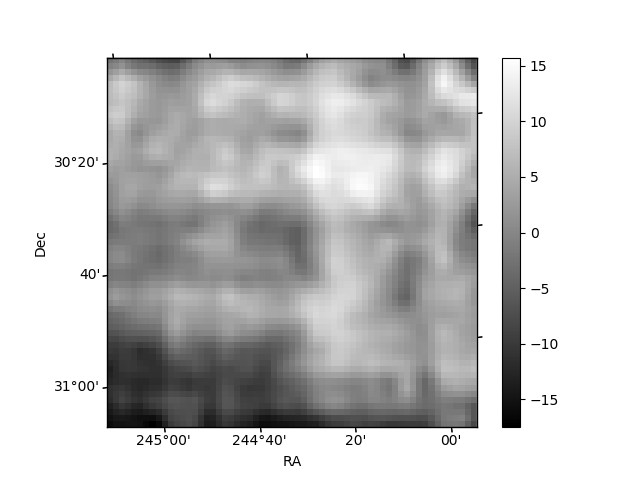
Histogram calculated using DETX and DETY for each event in the final _common_clean file
| Quadrant A | 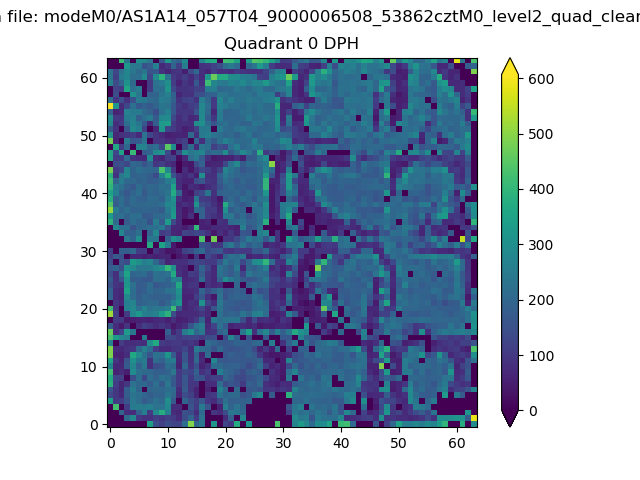 |
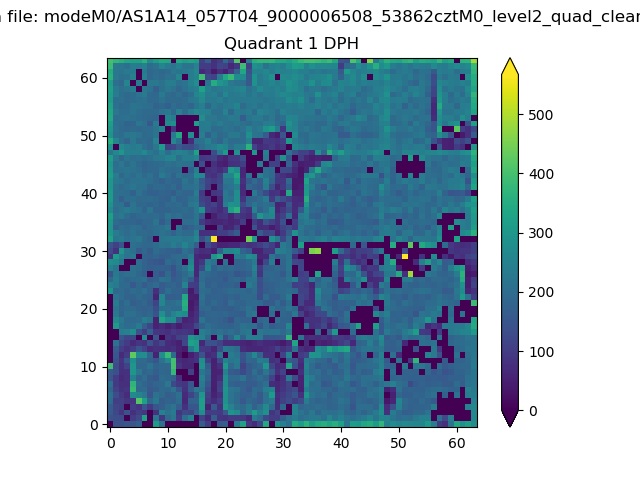 |
Quadrant B |
|---|---|---|---|
| Quadrant D | 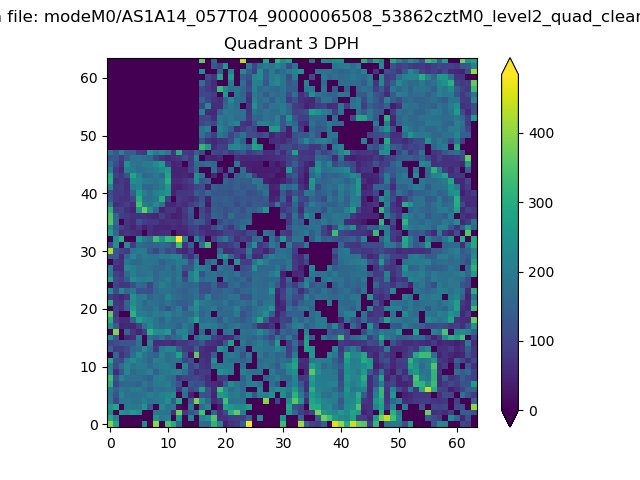 |
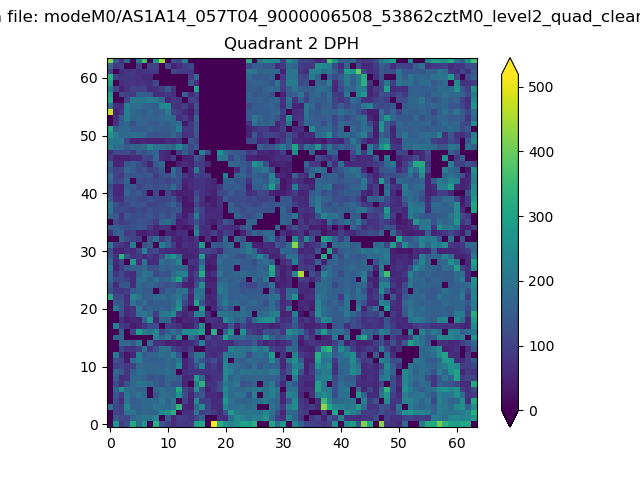 |
Quadrant C |
| Plot type | Count rate plots | Images |
|---|---|---|
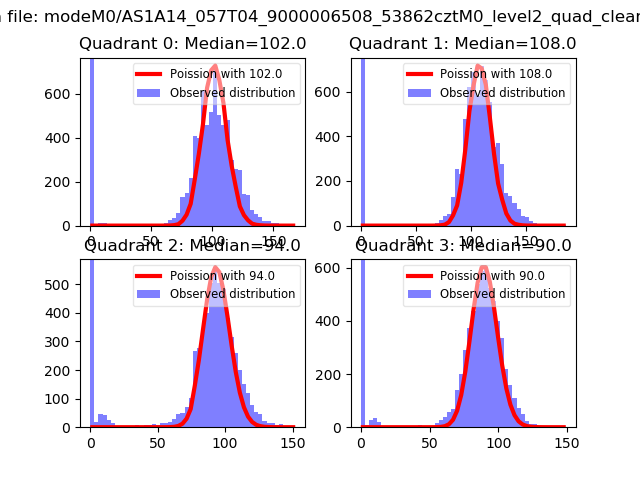
| Comparison with Poisson distribution Blue bars denote a histogram of data divided into 1 sec bins. Red curve is a Poisson curve with rate = median count rate of data. |
 |
 |
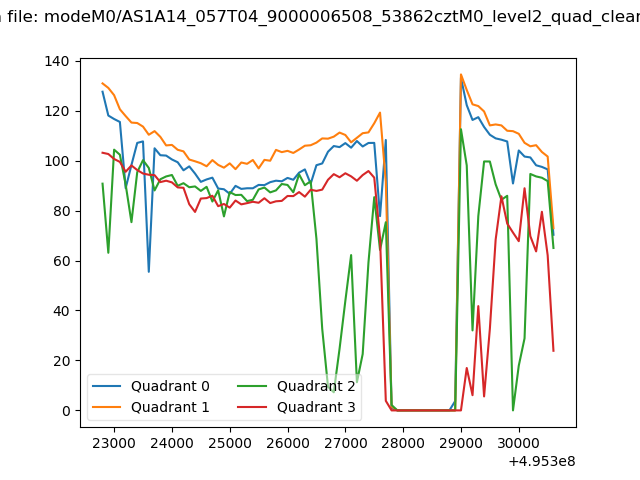
| Quadrant-wise count rates Data is divided into 100 sec bins |
 |
|
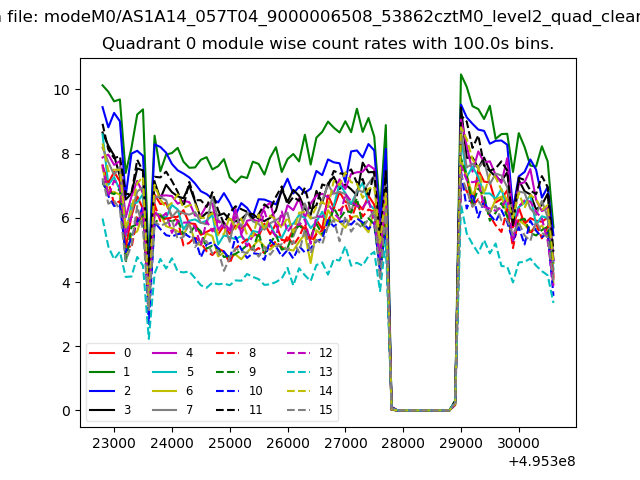
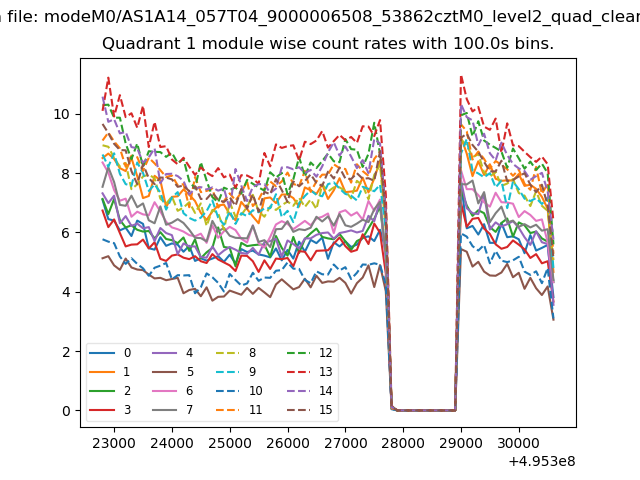
| Module-wise count rates for Quadrant A Data is divided into 100 sec bins |
 |
 |
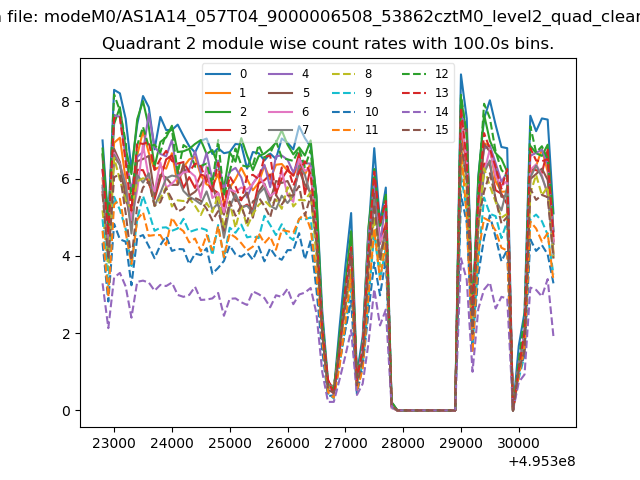
| Module-wise count rates for Quadrant B Data is divided into 100 sec bins |
 |
 |
| Module-wise count rates for Quadrant C Data is divided into 100 sec bins |
 |
 |
| Module-wise count rates for Quadrant D Data is divided into 100 sec bins |
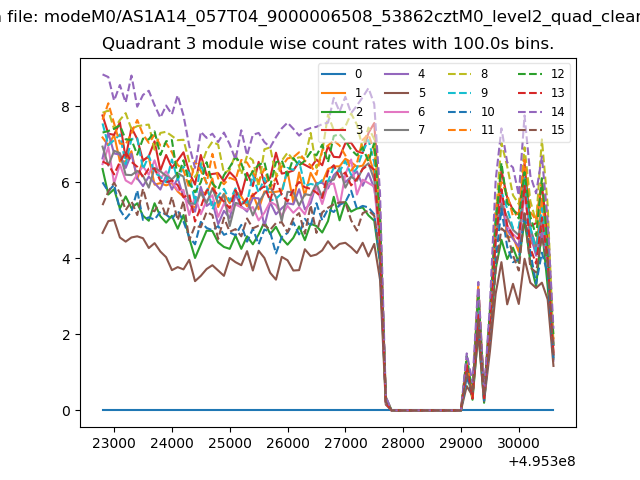 |
 |
| Parameter | Plot |
|---|---|
| CZT HV Monitor | 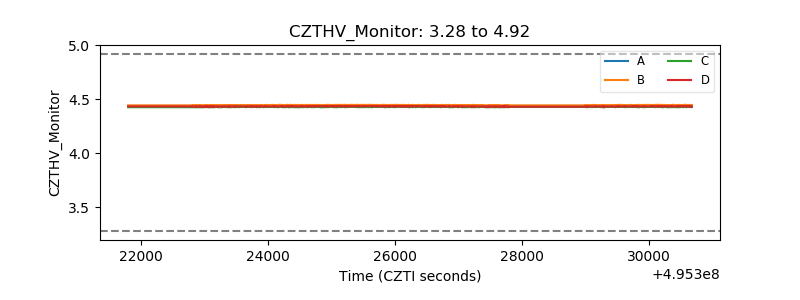 |
| D_VDD | 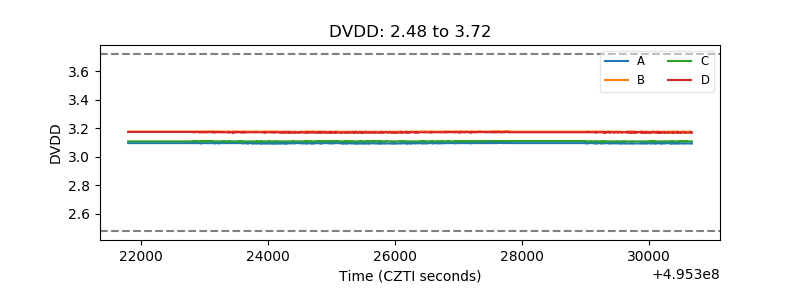 |
| Temperature 1 | 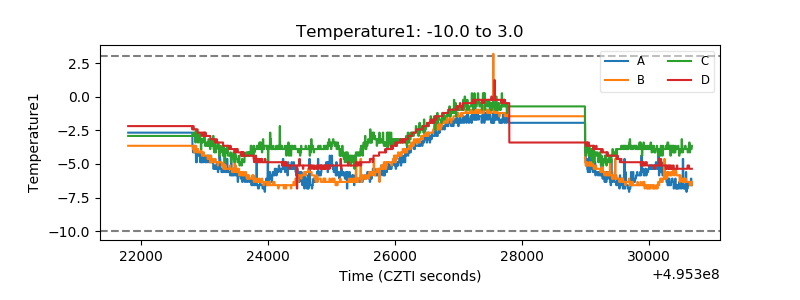 |
| Veto HV Monitor |  |
| Veto LLD | 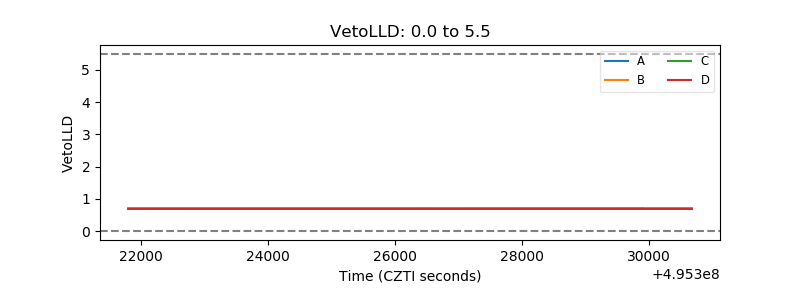 |
| Alpha Counter | 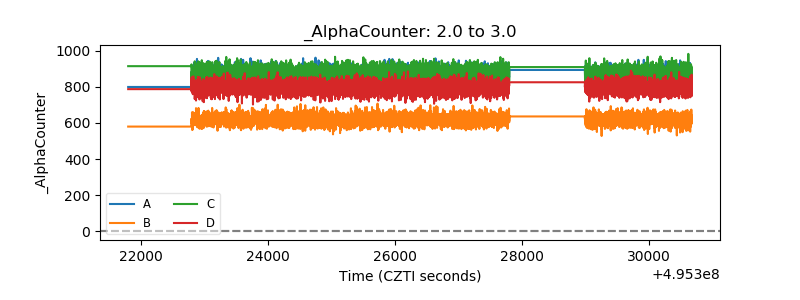 |
| _CPM_Rate | 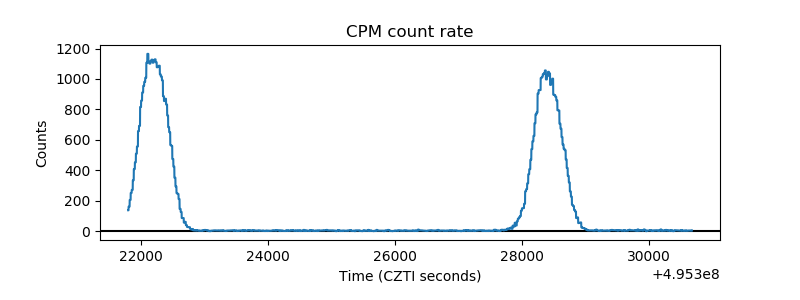 |
| CZT Counter | 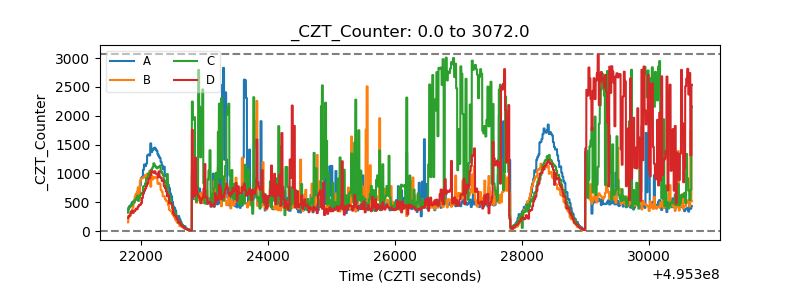 |
| +2.5 Volts monitor |  |
| +5 Volts monitor |  |
| _ROLL_ROT | 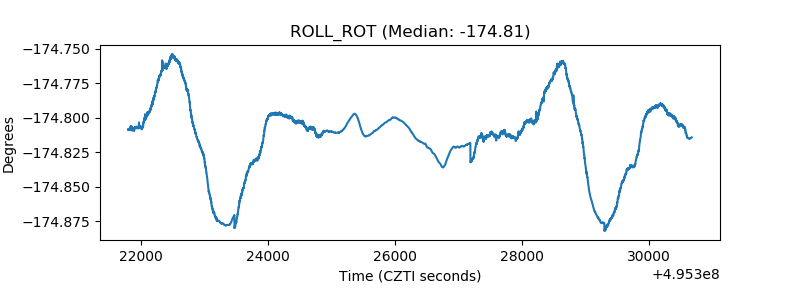 |
| _Roll_DEC | 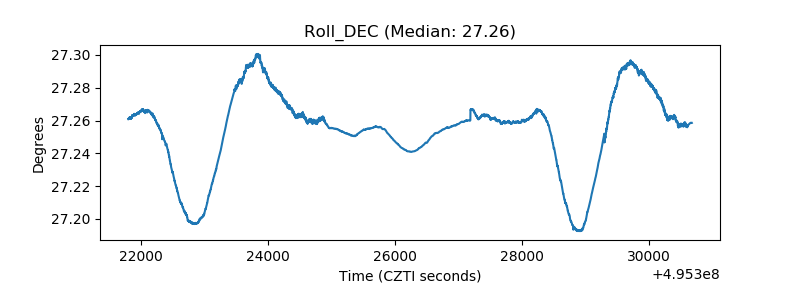 |
| _Roll_RA | 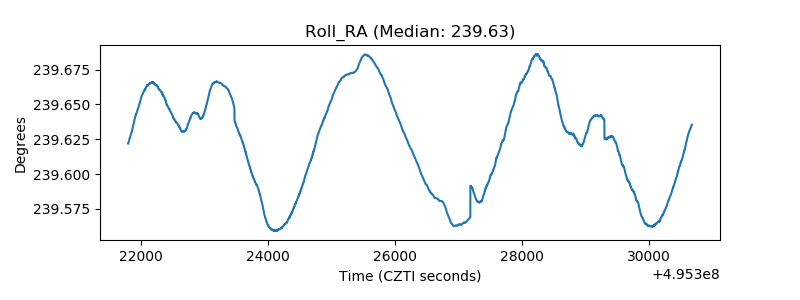 |
| Veto Counter | 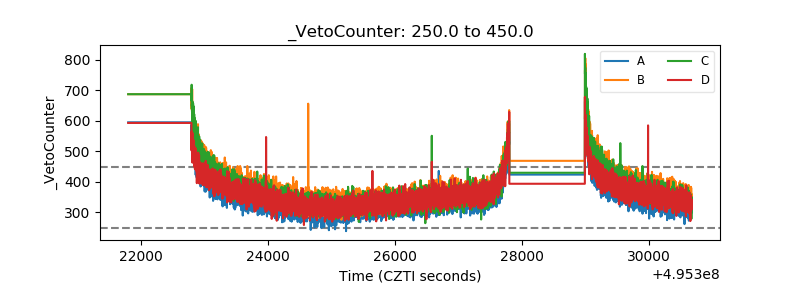 |