| Param | Original file | Final file |
|---|---|---|
| Filename | modeM0/AS1A14_057T04_9000006508_53863cztM0_level2.fits | modeM0/AS1A14_057T04_9000006508_53863cztM0_level2_quad_clean.evt |
| Size (bytes) | 650,661,120 | 82,166,400 |
| Size | 620.5 MB | 78.4 MB |
| Events in quadrant A | 2,993,387 | 596,491 |
| Events in quadrant B | 3,628,464 | 628,159 |
| Events in quadrant C | 6,967,682 | 473,156 |
| Events in quadrant D | 10,033,062 | 372,593 |
| Mode M0 | |||
|---|---|---|---|
| Quadrant | BADHDUFLAG | Total packets | Discarded packets |
| A | 0 | 13110 | 1 |
| B | 0 | 14799 | 1 |
| C | 0 | 24740 | 1 |
| D | 0 | 33963 | 1 |
| Mode SS | |||
|---|---|---|---|
| Quadrant | BADHDUFLAG | Total packets | Discarded packets |
| A | 0 | 122 | 0 |
| B | 0 | 122 | 0 |
| C | 0 | 122 | 0 |
| D | 0 | 122 | 0 |
| Mode M9 | |||
|---|---|---|---|
| Quadrant | BADHDUFLAG | Total packets | Discarded packets |
| A | 0 | 12 | 0 |
| B | 0 | 12 | 0 |
| C | 0 | 12 | 0 |
| D | 0 | 12 | 0 |
| Quadrant | Total seconds | Saturated seconds | Saturation percentage |
|---|---|---|---|
| A | 5971 | 95 | 1.591023% |
| B | 5971 | 194 | 3.249037% |
| C | 5971 | 1255 | 21.018255% |
| D | 5971 | 2215 | 37.095964% |
Noise dominated data is calculated using 1-second bins in cleaned event files. If a bin has >2000 counts, and if more than 50% of those come from <1% of pixels, then it is considered to be noise-dominated and hence unusable.
| Quadrant | # 1 sec bins | Bins with >0 counts | Bins with >2000 counts | High rate bins dominated by noise | Noise dominated (total time) | Noise dominated (detector-on time) | Marked lightcurve |
|---|---|---|---|---|---|---|---|
| A | 7181 | 5972 | 65 | 65 | 0.91% | 1.09% | 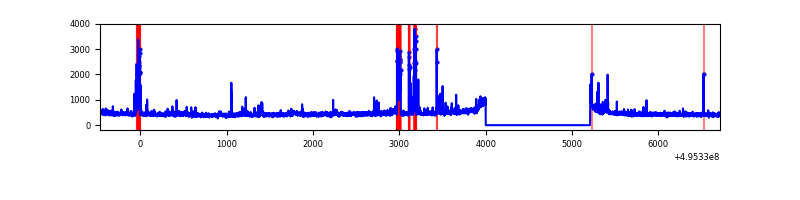 |
| B | 7181 | 5972 | 92 | 92 | 1.28% | 1.54% | 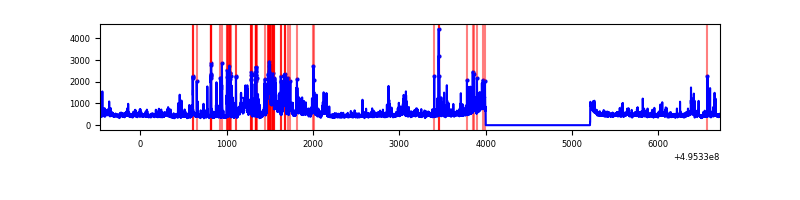 |
| C | 7181 | 5972 | 1163 | 1163 | 16.20% | 19.47% | 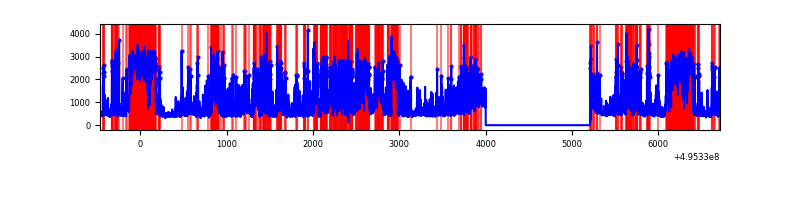 |
| D | 7181 | 5972 | 2267 | 2267 | 31.57% | 37.96% | 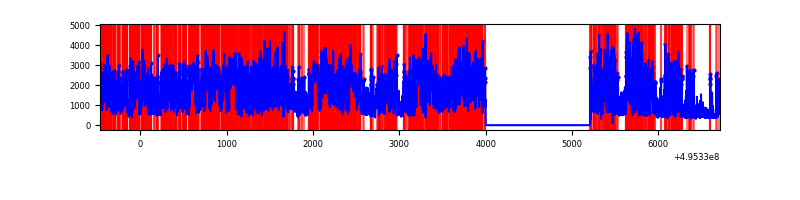 |
Top three noisy pixels from each quadrant. If the there are fewer than three noisy pixels in the level2.evt file, extra rows are filled as -1
| Pixel properties | Quadrant properties | ||||||
|---|---|---|---|---|---|---|---|
| Quadrant | DetID | PixID | Counts | Sigma | Mean | Median | Sigma |
| A | 0 | 8 | 158050 | 966.61 | 660 | 642 | 162.8 |
| A | 5 | 241 | 74041 | 450.73 | 660 | 642 | 162.8 |
| A | 8 | 249 | 49918 | 302.59 | 660 | 642 | 162.8 |
| B | 5 | 185 | 619736 | 4449.33 | 651 | 629 | 139.1 |
| B | 4 | 170 | 204334 | 1463.97 | 651 | 629 | 139.1 |
| B | 0 | 213 | 83761 | 597.44 | 651 | 629 | 139.1 |
| C | 1 | 241 | 2141863 | 13257.21 | 582 | 578 | 161.5 |
| C | 15 | 224 | 1972684 | 12209.78 | 582 | 578 | 161.5 |
| C | 13 | 3 | 248001 | 1531.85 | 582 | 578 | 161.5 |
| D | 8 | 176 | 7695116 | 49161.13 | 536 | 511 | 156.5 |
| D | 7 | 70 | 38352 | 241.77 | 536 | 511 | 156.5 |
| D | 2 | 249 | 35419 | 223.03 | 536 | 511 | 156.5 |
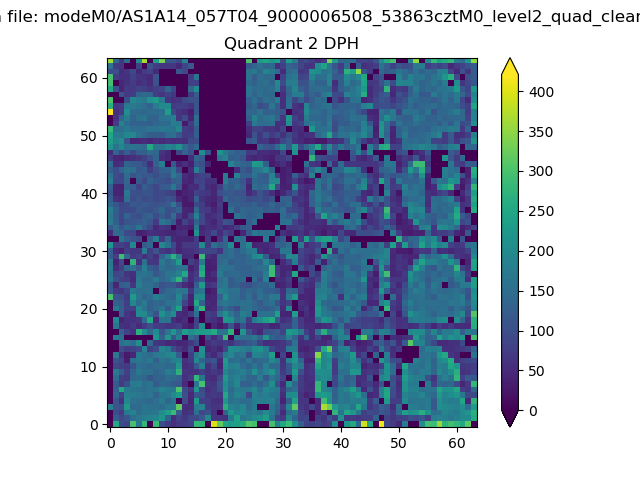
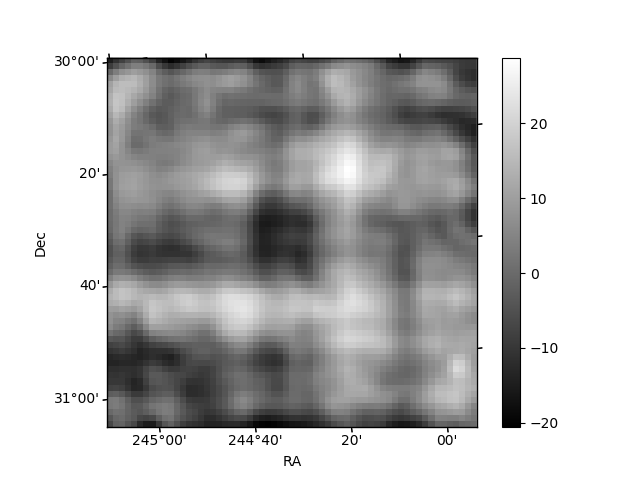
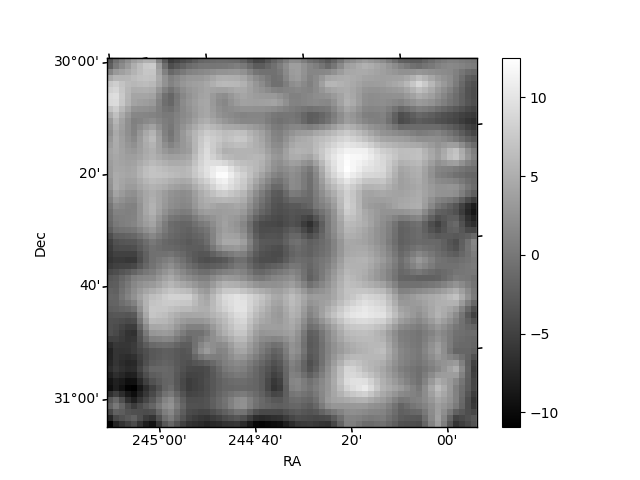
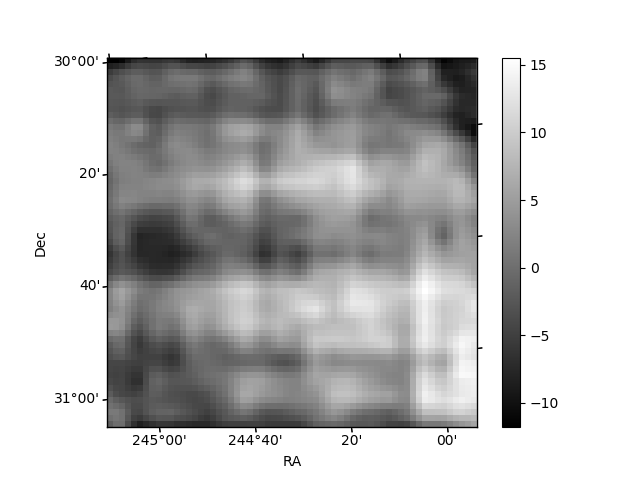
Histogram calculated using DETX and DETY for each event in the final _common_clean file
| Quadrant A | 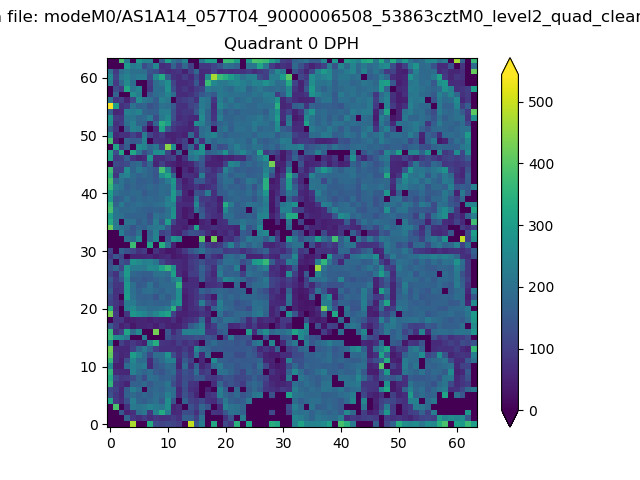 |
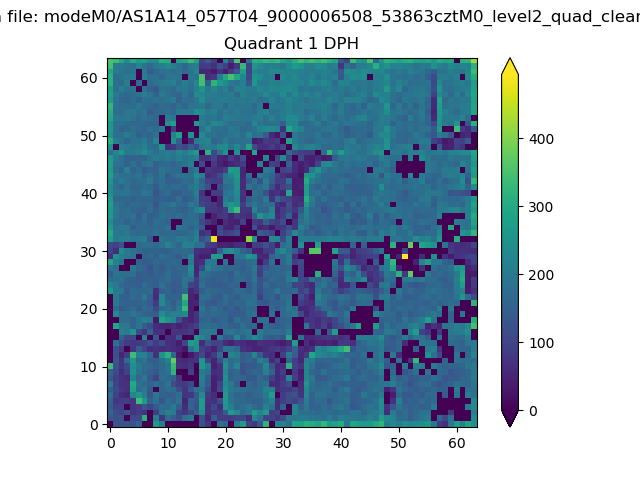 |
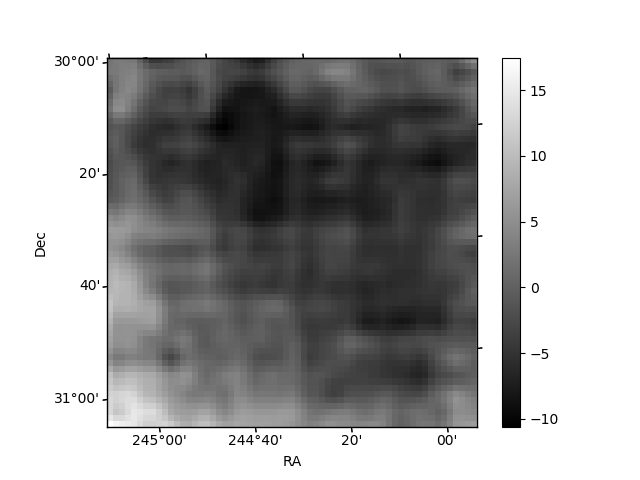
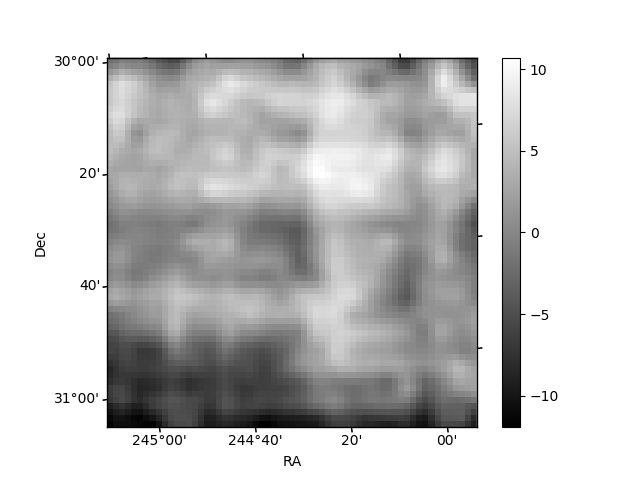
Quadrant B |
|---|---|---|---|
| Quadrant D | 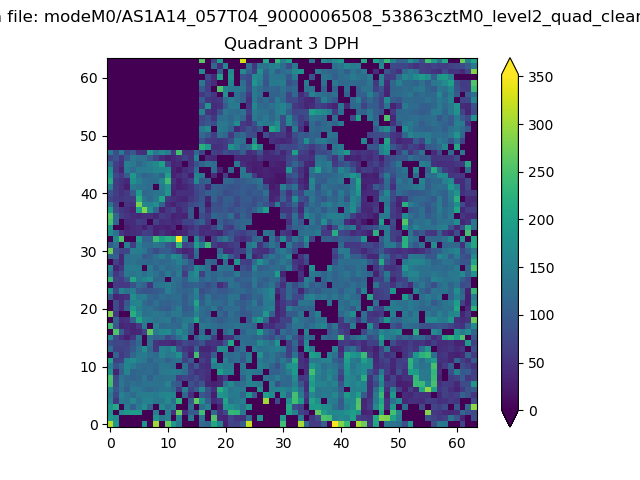 |
 |
Quadrant C |
| Plot type | Count rate plots | Images |
|---|---|---|
| Comparison with Poisson distribution Blue bars denote a histogram of data divided into 1 sec bins. Red curve is a Poisson curve with rate = median count rate of data. |
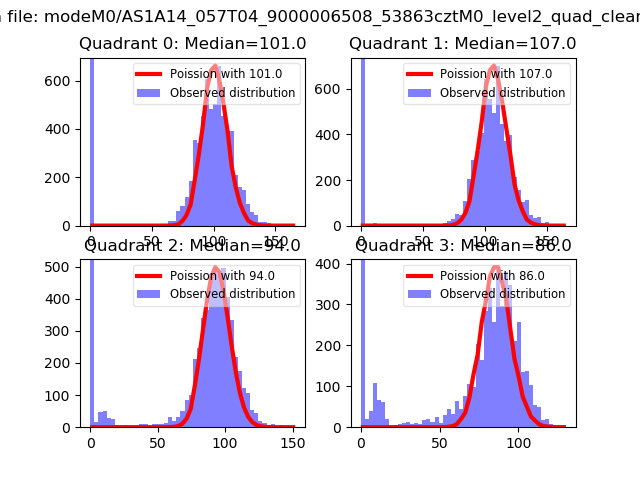 |
 |
| Quadrant-wise count rates Data is divided into 100 sec bins |
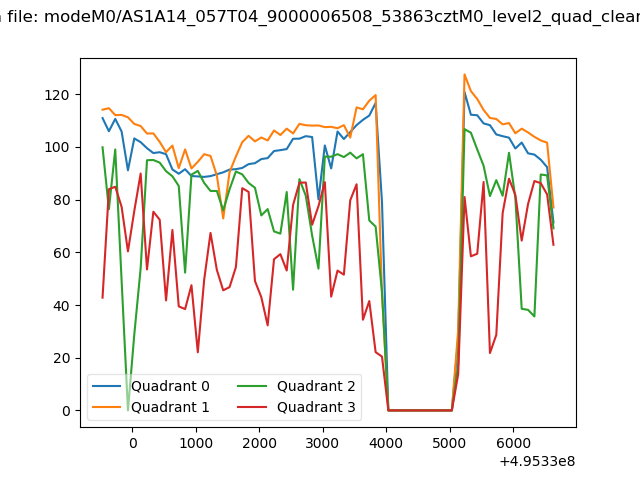 |
|
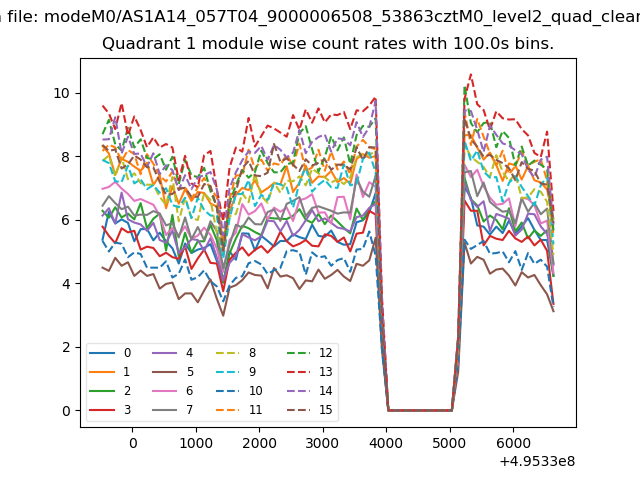
| Module-wise count rates for Quadrant A Data is divided into 100 sec bins |
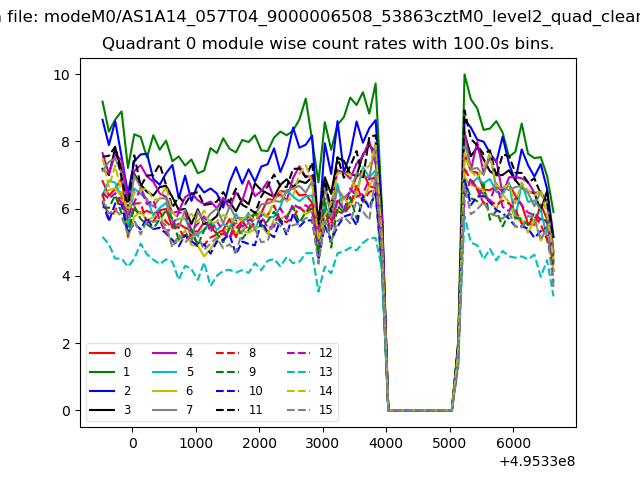 |
 |
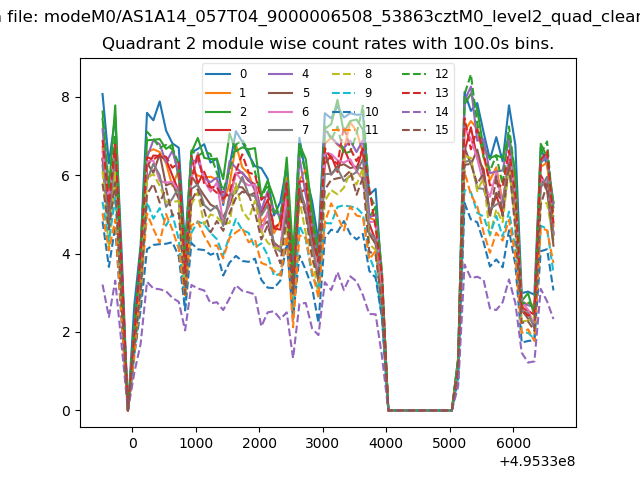
| Module-wise count rates for Quadrant B Data is divided into 100 sec bins |
 |
 |
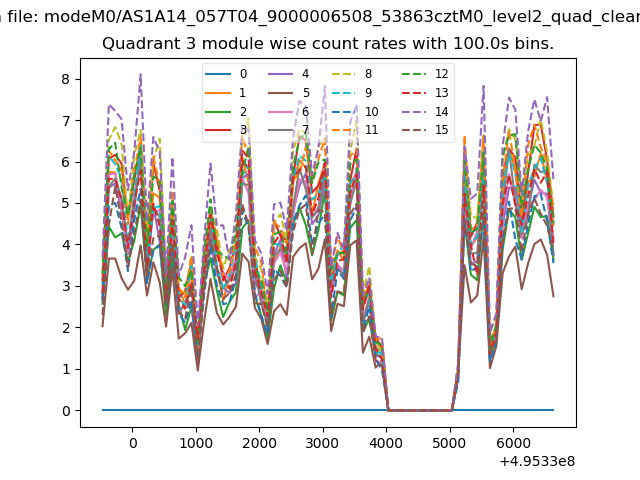
| Module-wise count rates for Quadrant C Data is divided into 100 sec bins |
 |
 |
| Module-wise count rates for Quadrant D Data is divided into 100 sec bins |
 |
 |
| Parameter | Plot |
|---|---|
| CZT HV Monitor | 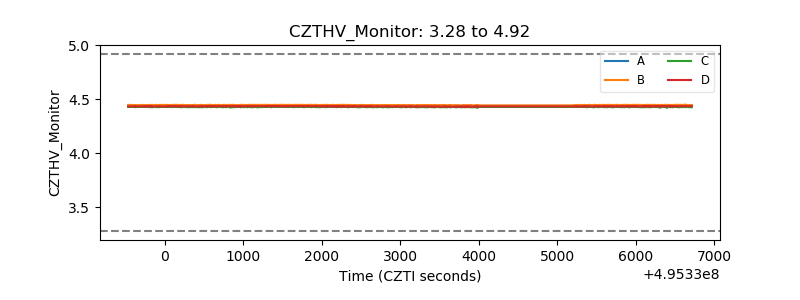 |
| D_VDD | 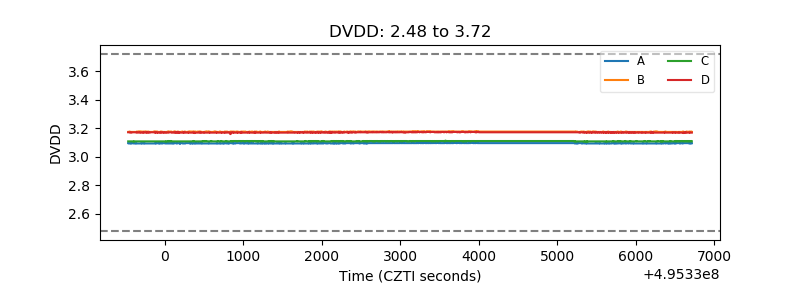 |
| Temperature 1 | 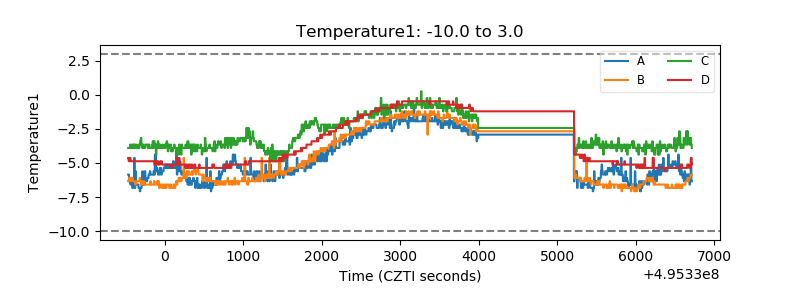 |
| Veto HV Monitor | 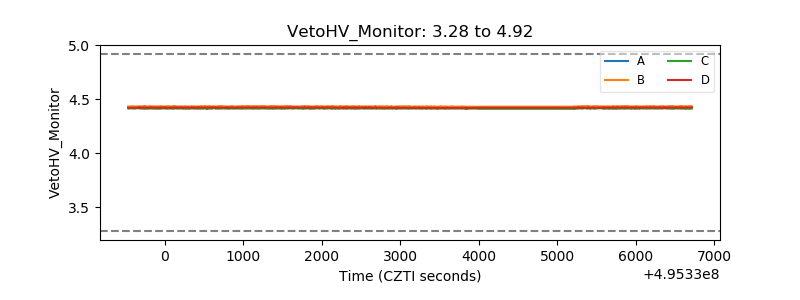 |
| Veto LLD | 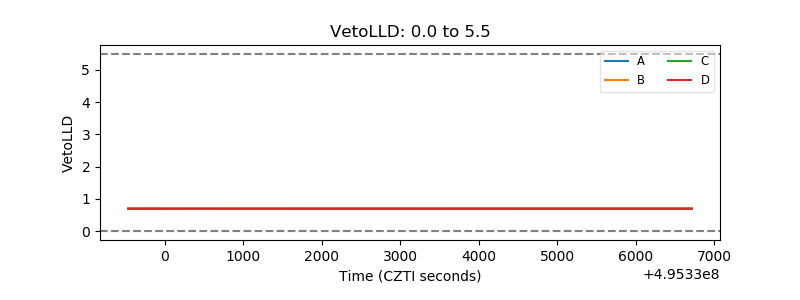 |
| Alpha Counter | 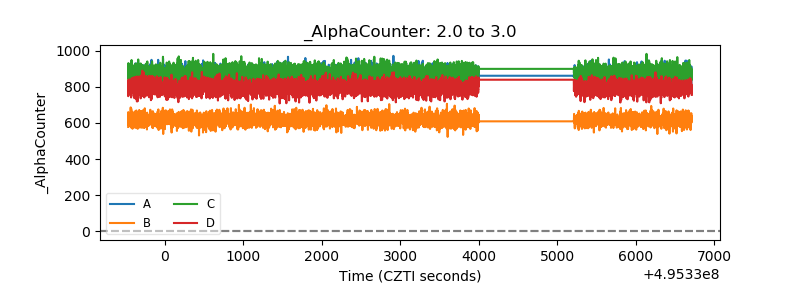 |
| _CPM_Rate | 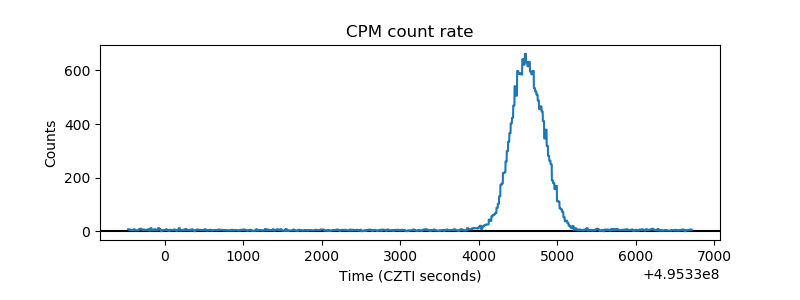 |
| CZT Counter | 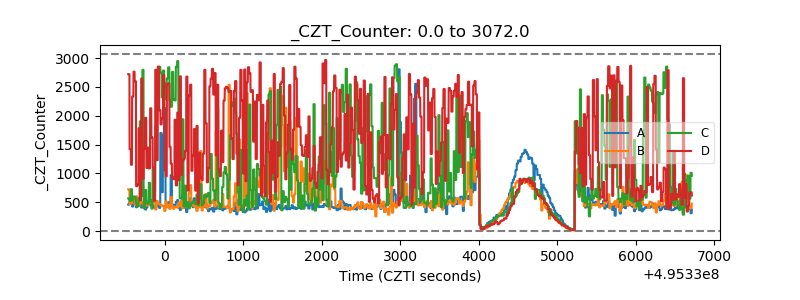 |
| +2.5 Volts monitor |  |
| +5 Volts monitor | 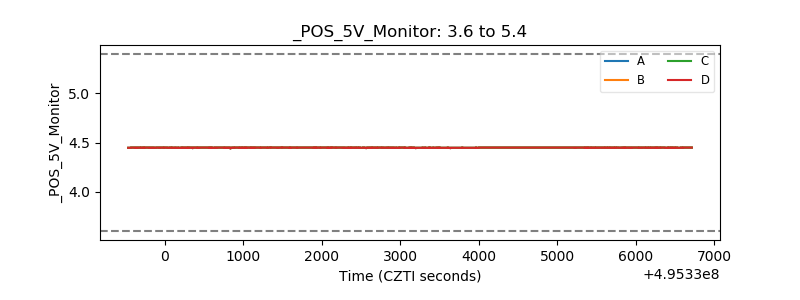 |
| _ROLL_ROT | 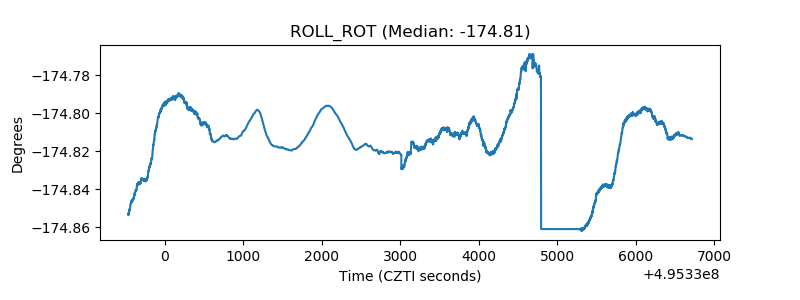 |
| _Roll_DEC | 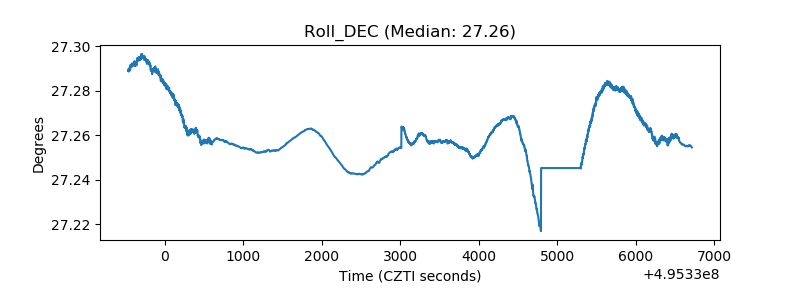 |
| _Roll_RA | 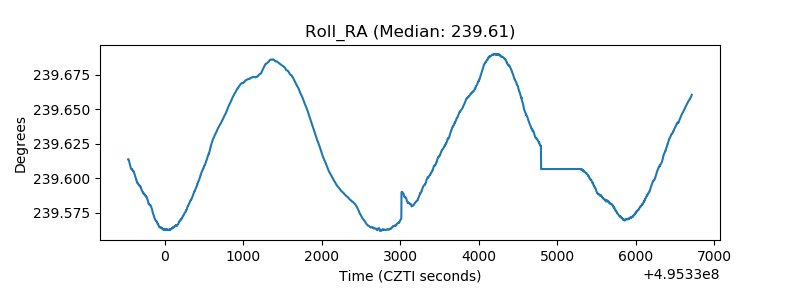 |
| Veto Counter | 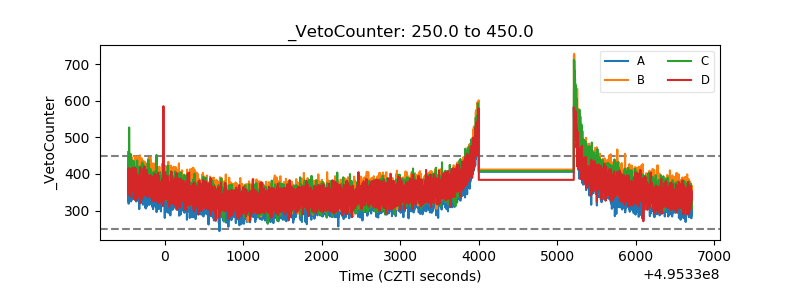 |