| Param | Original file | Final file |
|---|---|---|
| Filename | modeM0/AS1A14_057T04_9000006508_53864cztM0_level2.fits | modeM0/AS1A14_057T04_9000006508_53864cztM0_level2_quad_clean.evt |
| Size (bytes) | 533,462,400 | 96,793,920 |
| Size | 508.7 MB | 92.3 MB |
| Events in quadrant A | 3,153,602 | 657,370 |
| Events in quadrant B | 3,864,189 | 688,650 |
| Events in quadrant C | 6,679,329 | 554,971 |
| Events in quadrant D | 5,528,630 | 561,094 |
| Mode M0 | |||
|---|---|---|---|
| Quadrant | BADHDUFLAG | Total packets | Discarded packets |
| A | 0 | 14197 | 2 |
| B | 0 | 16052 | 2 |
| C | 0 | 24495 | 2 |
| D | 0 | 21105 | 2 |
| Mode SS | |||
|---|---|---|---|
| Quadrant | BADHDUFLAG | Total packets | Discarded packets |
| A | 0 | 138 | 0 |
| B | 0 | 138 | 0 |
| C | 0 | 138 | 0 |
| D | 0 | 138 | 0 |
| Mode M9 | |||
|---|---|---|---|
| Quadrant | BADHDUFLAG | Total packets | Discarded packets |
| A | 0 | 10 | 0 |
| B | 0 | 10 | 0 |
| C | 0 | 10 | 0 |
| D | 0 | 10 | 0 |
| Quadrant | Total seconds | Saturated seconds | Saturation percentage |
|---|---|---|---|
| A | 6715 | 92 | 1.370067% |
| B | 6715 | 250 | 3.723008% |
| C | 6716 | 1003 | 14.934485% |
| D | 6716 | 545 | 8.114949% |
Noise dominated data is calculated using 1-second bins in cleaned event files. If a bin has >2000 counts, and if more than 50% of those come from <1% of pixels, then it is considered to be noise-dominated and hence unusable.
| Quadrant | # 1 sec bins | Bins with >0 counts | Bins with >2000 counts | High rate bins dominated by noise | Noise dominated (total time) | Noise dominated (detector-on time) | Marked lightcurve |
|---|---|---|---|---|---|---|---|
| A | 7745 | 6716 | 2 | 2 | 0.03% | 0.03% | 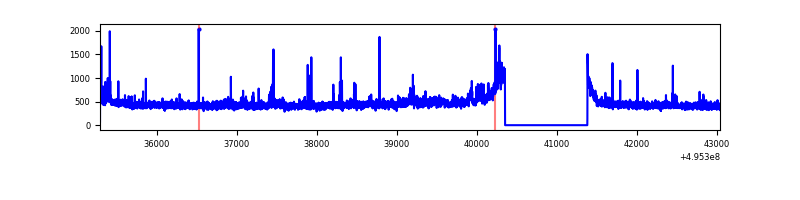 |
| B | 7745 | 6716 | 99 | 99 | 1.28% | 1.47% | 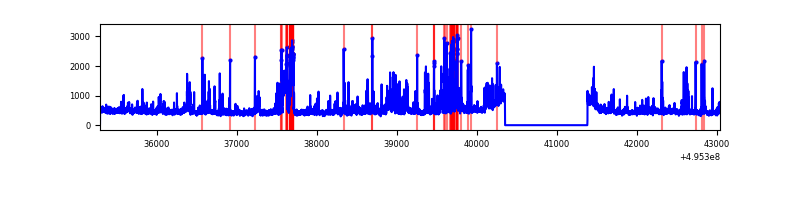 |
| C | 7746 | 6717 | 813 | 813 | 10.50% | 12.10% | 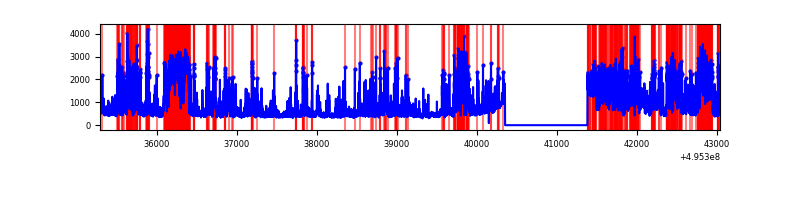 |
| D | 7746 | 6717 | 495 | 495 | 6.39% | 7.37% | 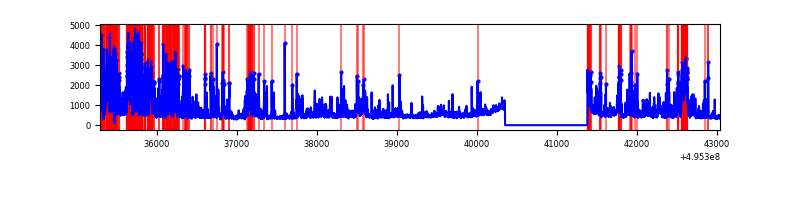 |
Top three noisy pixels from each quadrant. If the there are fewer than three noisy pixels in the level2.evt file, extra rows are filled as -1
| Pixel properties | Quadrant properties | ||||||
|---|---|---|---|---|---|---|---|
| Quadrant | DetID | PixID | Counts | Sigma | Mean | Median | Sigma |
| A | 8 | 249 | 79838 | 429.09 | 751 | 732 | 184.4 |
| A | 4 | 249 | 35647 | 189.39 | 751 | 732 | 184.4 |
| A | 0 | 8 | 24932 | 131.27 | 751 | 732 | 184.4 |
| B | 0 | 213 | 298577 | 1897.07 | 737 | 713 | 157.0 |
| B | 10 | 247 | 187988 | 1192.74 | 737 | 713 | 157.0 |
| B | 5 | 185 | 174557 | 1107.2 | 737 | 713 | 157.0 |
| C | 15 | 224 | 1915960 | 10068.36 | 686 | 681 | 190.2 |
| C | 15 | 209 | 1062804 | 5583.43 | 686 | 681 | 190.2 |
| C | 1 | 241 | 629468 | 3305.45 | 686 | 681 | 190.2 |
| D | 8 | 176 | 2344114 | 11820.74 | 696 | 667 | 198.2 |
| D | 2 | 249 | 127786 | 641.21 | 696 | 667 | 198.2 |
| D | 7 | 70 | 51336 | 255.58 | 696 | 667 | 198.2 |
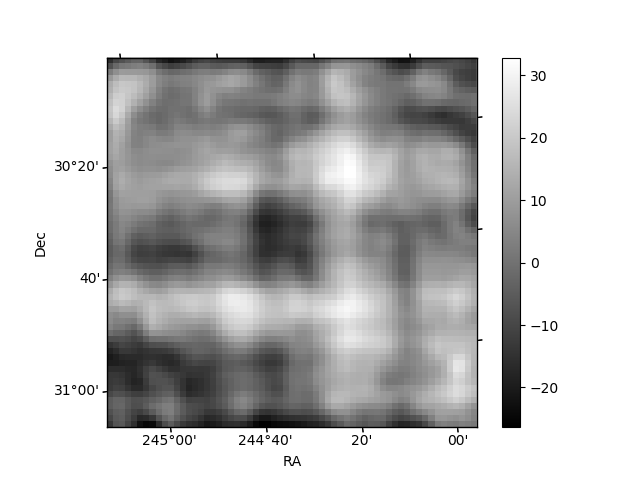
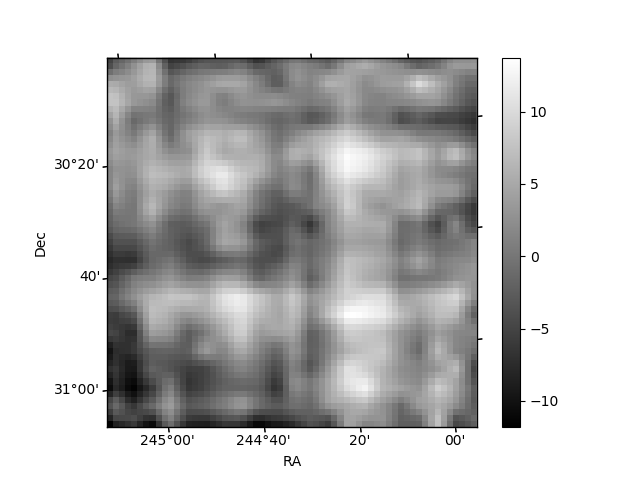
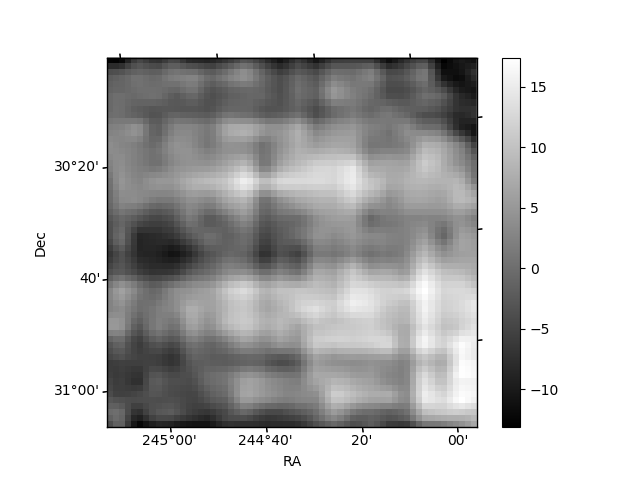
Histogram calculated using DETX and DETY for each event in the final _common_clean file
| Quadrant A | 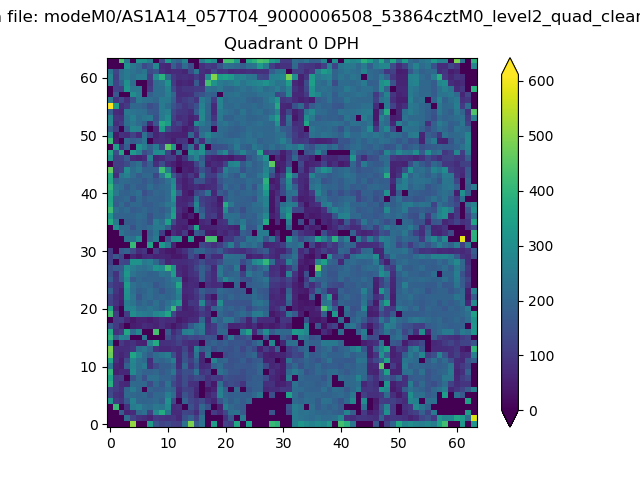 |
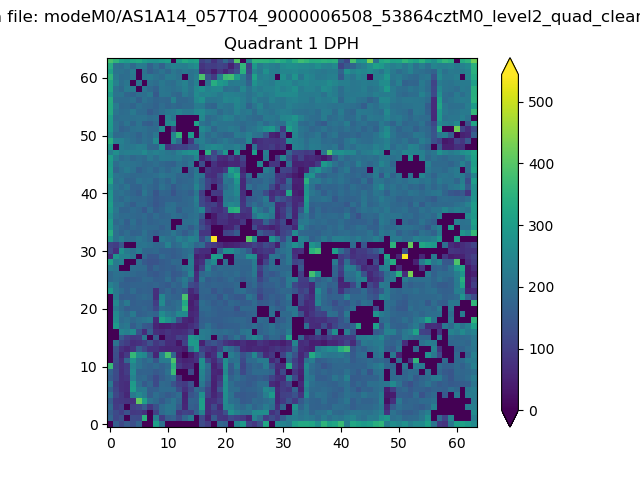 |
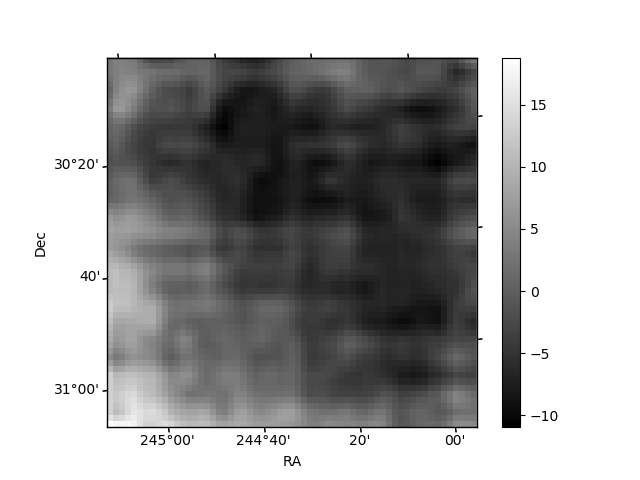
Quadrant B |
|---|---|---|---|
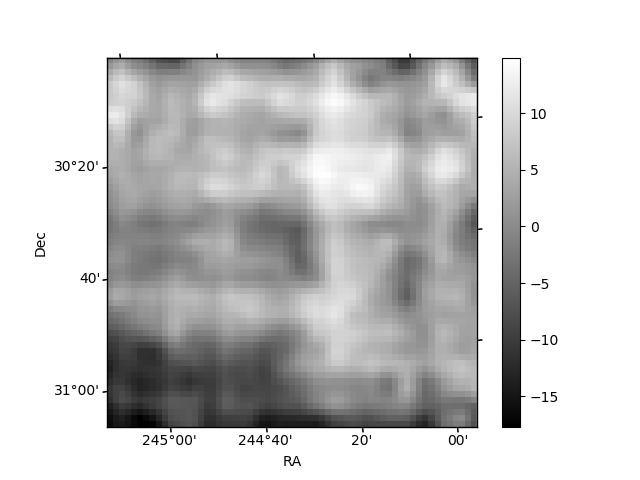
| Quadrant D | 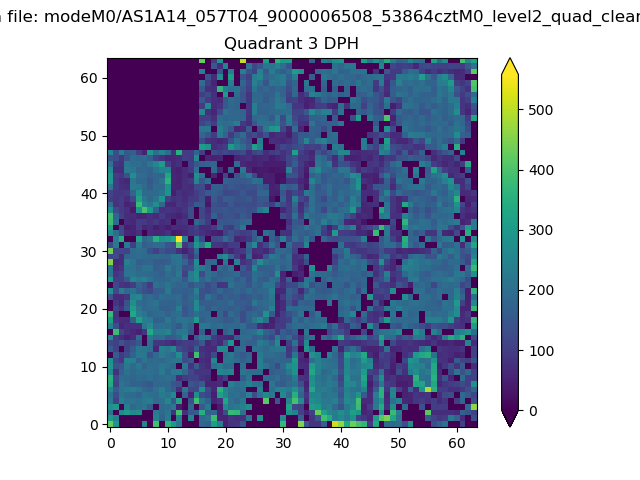 |
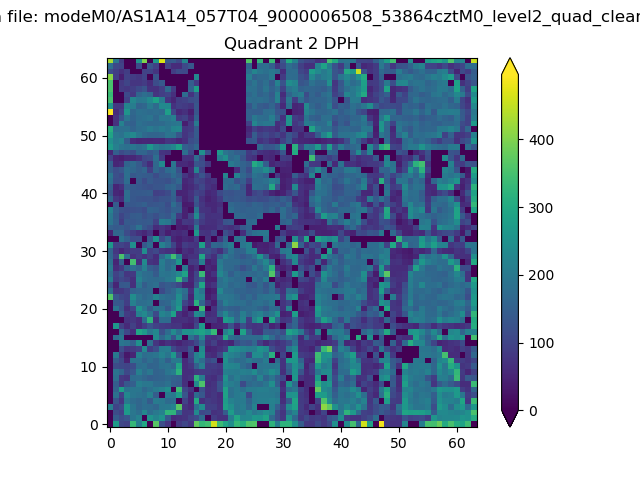 |
Quadrant C |
| Plot type | Count rate plots | Images |
|---|---|---|
| Comparison with Poisson distribution Blue bars denote a histogram of data divided into 1 sec bins. Red curve is a Poisson curve with rate = median count rate of data. |
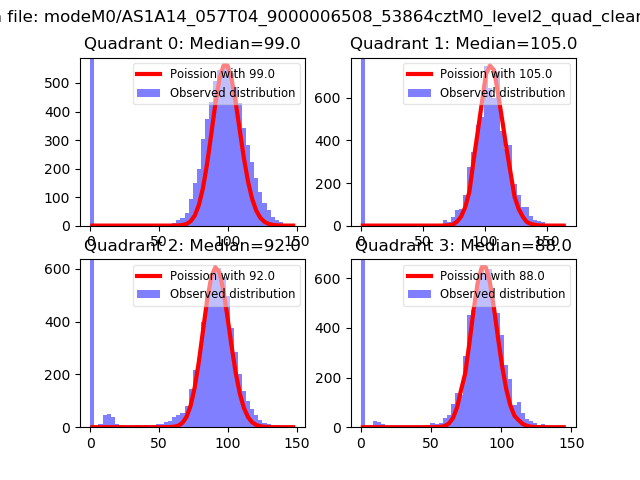 |
 |
| Quadrant-wise count rates Data is divided into 100 sec bins |
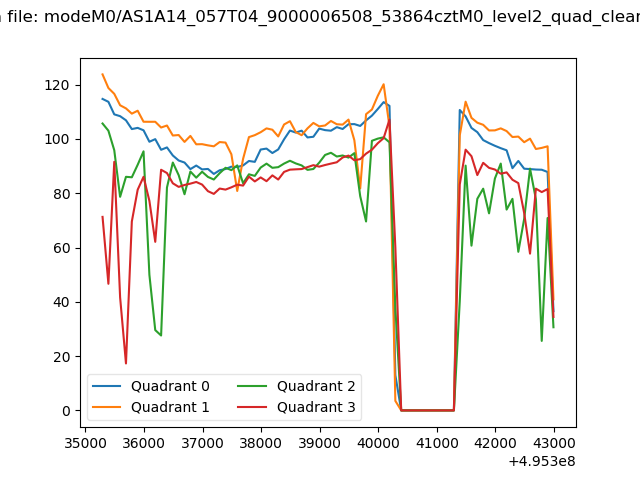 |
|
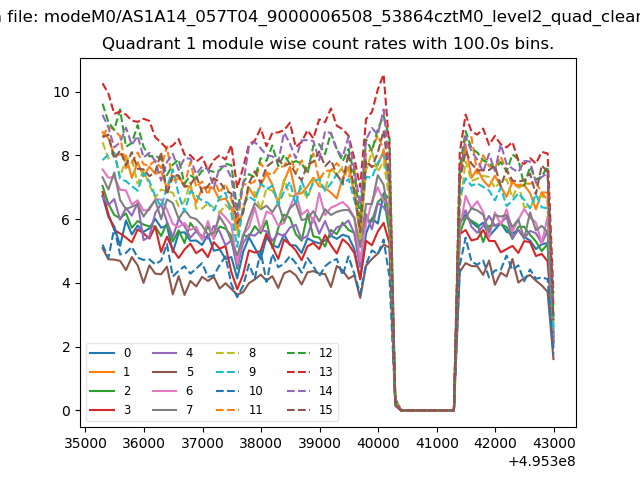
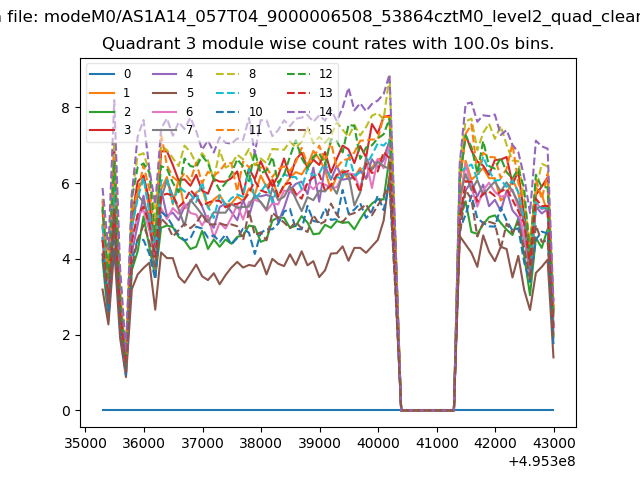
| Module-wise count rates for Quadrant A Data is divided into 100 sec bins |
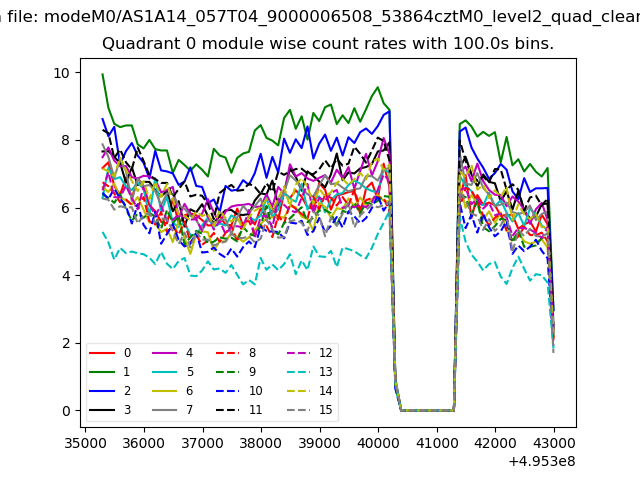 |
 |
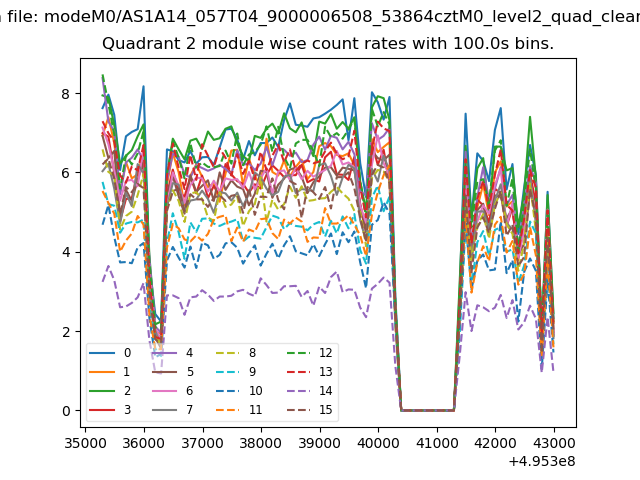
| Module-wise count rates for Quadrant B Data is divided into 100 sec bins |
 |
 |
| Module-wise count rates for Quadrant C Data is divided into 100 sec bins |
 |
 |
| Module-wise count rates for Quadrant D Data is divided into 100 sec bins |
 |
 |
| Parameter | Plot |
|---|---|
| CZT HV Monitor | 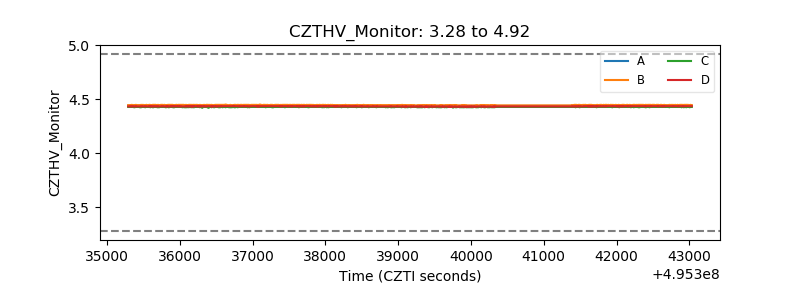 |
| D_VDD | 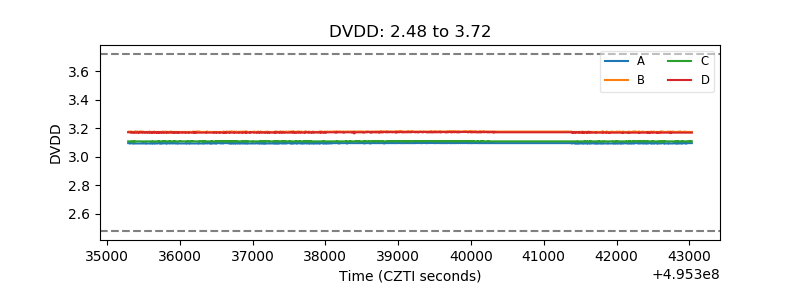 |
| Temperature 1 | 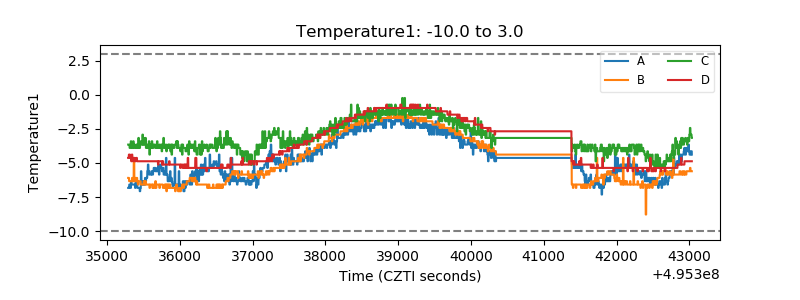 |
| Veto HV Monitor | 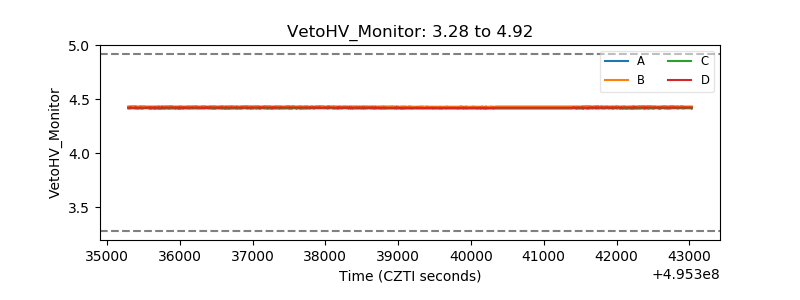 |
| Veto LLD | 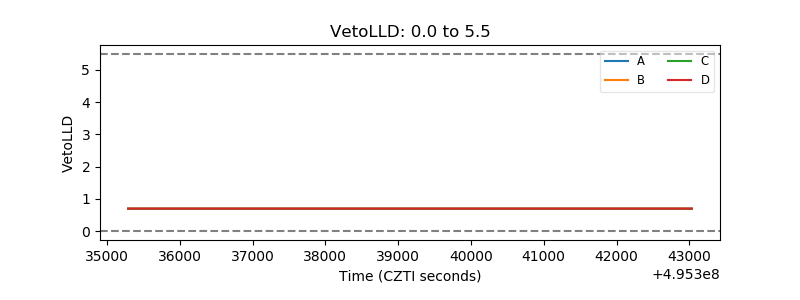 |
| Alpha Counter | 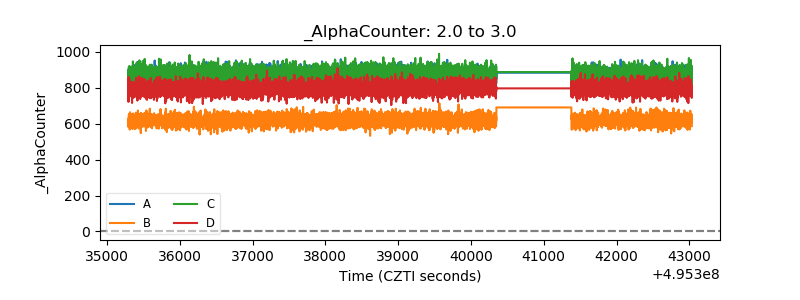 |
| _CPM_Rate | 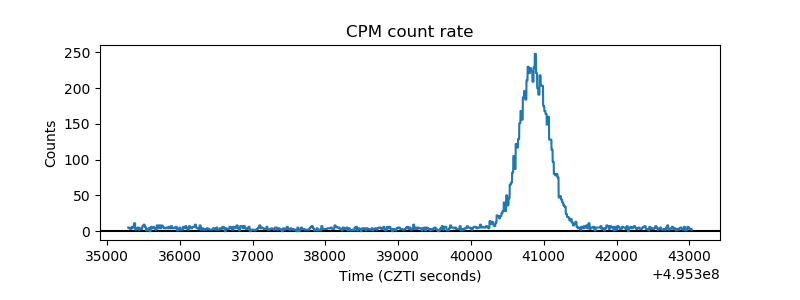 |
| CZT Counter | 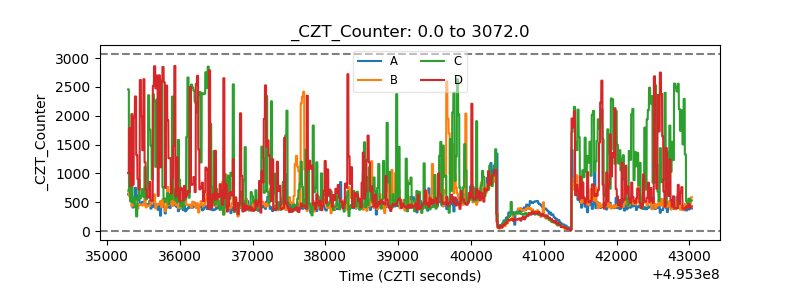 |
| +2.5 Volts monitor |  |
| +5 Volts monitor |  |
| _ROLL_ROT | 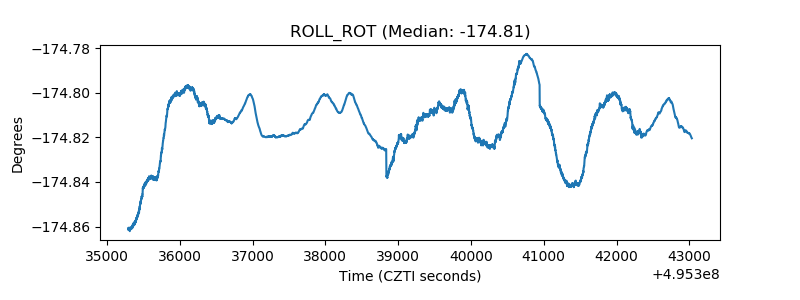 |
| _Roll_DEC | 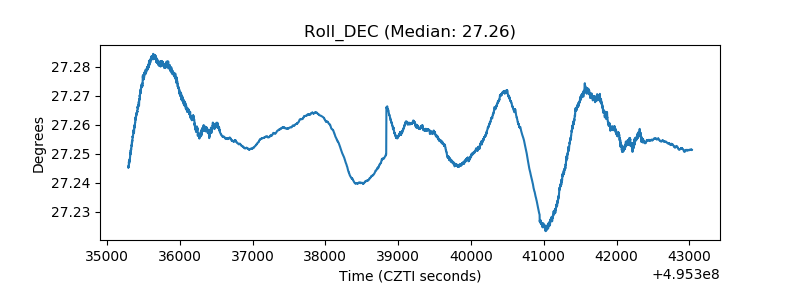 |
| _Roll_RA | 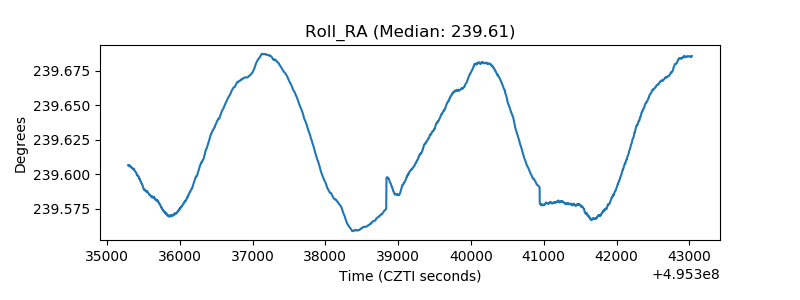 |
| Veto Counter | 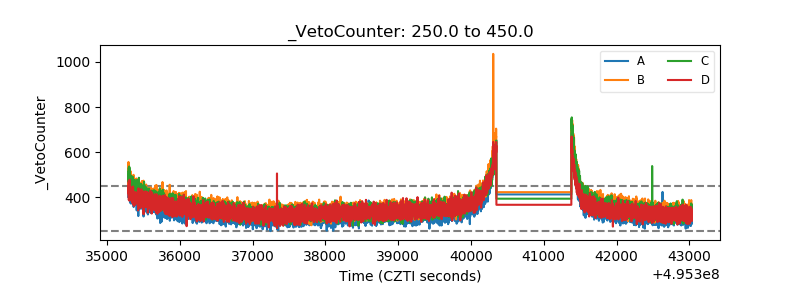 |