| Param | Original file | Final file |
|---|---|---|
| Filename | modeM0/AS1A14_057T04_9000006508_53868cztM0_level2.fits | modeM0/AS1A14_057T04_9000006508_53868cztM0_level2_quad_clean.evt |
| Size (bytes) | 708,065,280 | 98,314,560 |
| Size | 675.3 MB | 93.8 MB |
| Events in quadrant A | 5,294,971 | 666,387 |
| Events in quadrant B | 4,633,304 | 720,736 |
| Events in quadrant C | 8,530,356 | 561,492 |
| Events in quadrant D | 7,194,757 | 526,773 |
| Mode M0 | |||
|---|---|---|---|
| Quadrant | BADHDUFLAG | Total packets | Discarded packets |
| A | 0 | 20671 | 0 |
| B | 0 | 18712 | 0 |
| C | 0 | 30418 | 0 |
| D | 0 | 26286 | 0 |
| Mode SS | |||
|---|---|---|---|
| Quadrant | BADHDUFLAG | Total packets | Discarded packets |
| A | 0 | 144 | 0 |
| B | 0 | 144 | 0 |
| C | 0 | 144 | 0 |
| D | 0 | 144 | 0 |
| Quadrant | Total seconds | Saturated seconds | Saturation percentage |
|---|---|---|---|
| A | 7198 | 375 | 5.209780% |
| B | 7198 | 194 | 2.695193% |
| C | 7198 | 1175 | 16.323979% |
| D | 7198 | 1184 | 16.449014% |
Noise dominated data is calculated using 1-second bins in cleaned event files. If a bin has >2000 counts, and if more than 50% of those come from <1% of pixels, then it is considered to be noise-dominated and hence unusable.
| Quadrant | # 1 sec bins | Bins with >0 counts | Bins with >2000 counts | High rate bins dominated by noise | Noise dominated (total time) | Noise dominated (detector-on time) | Marked lightcurve |
|---|---|---|---|---|---|---|---|
| A | 7198 | 7198 | 293 | 293 | 4.07% | 4.07% | 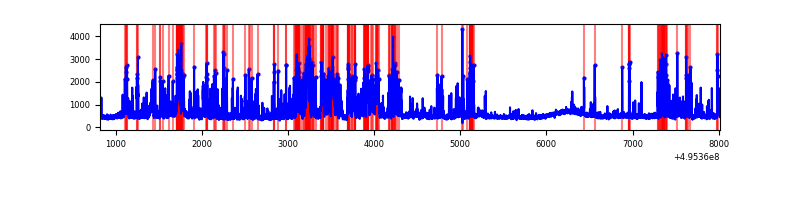 |
| B | 7198 | 7198 | 106 | 106 | 1.47% | 1.47% | 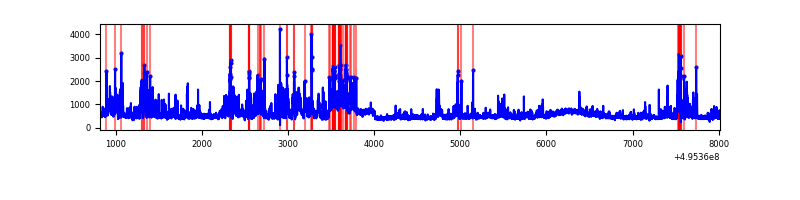 |
| C | 7198 | 7198 | 970 | 970 | 13.48% | 13.48% | 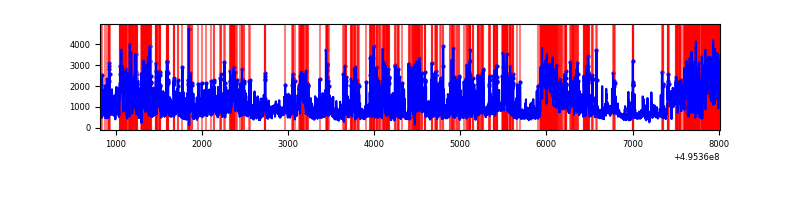 |
| D | 7198 | 7198 | 1100 | 1100 | 15.28% | 15.28% | 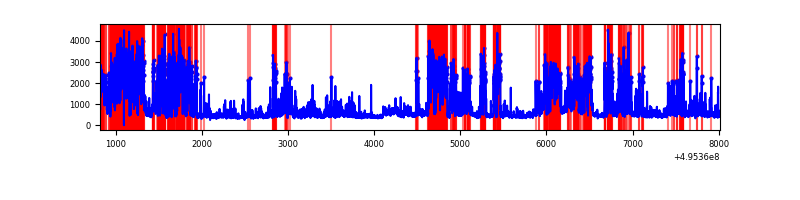 |
Top three noisy pixels from each quadrant. If the there are fewer than three noisy pixels in the level2.evt file, extra rows are filled as -1
| Pixel properties | Quadrant properties | ||||||
|---|---|---|---|---|---|---|---|
| Quadrant | DetID | PixID | Counts | Sigma | Mean | Median | Sigma |
| A | 3 | 62 | 1782817 | 9190.05 | 774 | 756 | 193.9 |
| A | 8 | 249 | 156634 | 803.86 | 774 | 756 | 193.9 |
| A | 3 | 114 | 113930 | 583.64 | 774 | 756 | 193.9 |
| B | 5 | 185 | 435895 | 2638.93 | 768 | 742 | 164.9 |
| B | 7 | 0 | 382321 | 2314.04 | 768 | 742 | 164.9 |
| B | 0 | 213 | 248840 | 1504.56 | 768 | 742 | 164.9 |
| C | 15 | 224 | 2020182 | 10389.73 | 707 | 702 | 194.4 |
| C | 4 | 5 | 1124021 | 5779.2 | 707 | 702 | 194.4 |
| C | 15 | 209 | 1004116 | 5162.32 | 707 | 702 | 194.4 |
| D | 8 | 176 | 3872815 | 19449.78 | 699 | 667 | 199.1 |
| D | 10 | 229 | 137340 | 686.51 | 699 | 667 | 199.1 |
| D | 3 | 144 | 105603 | 527.09 | 699 | 667 | 199.1 |
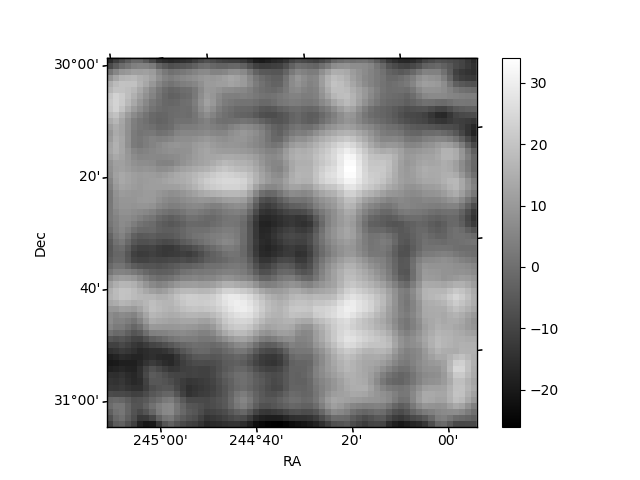
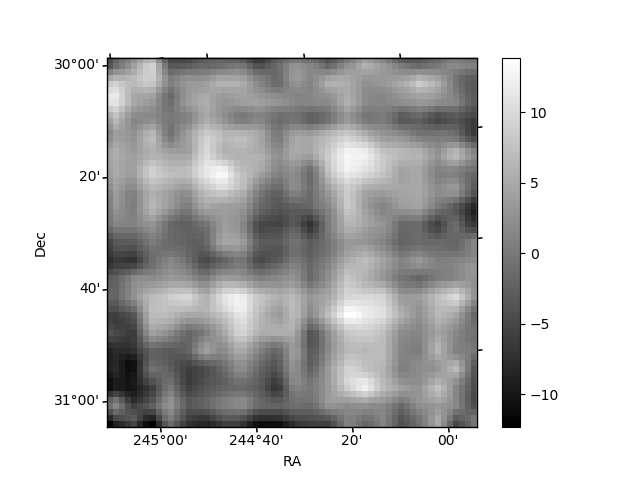
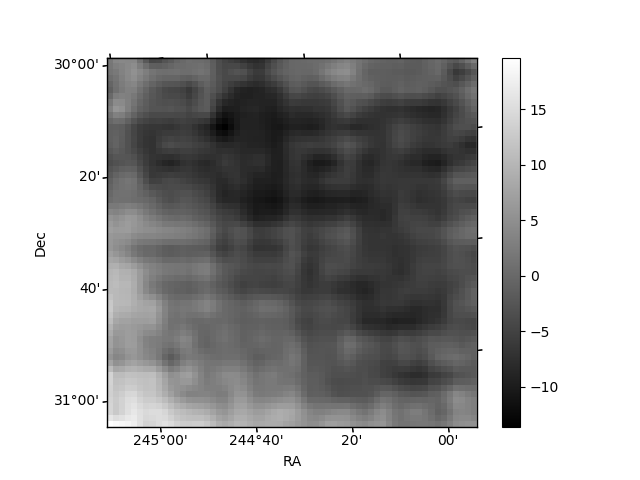
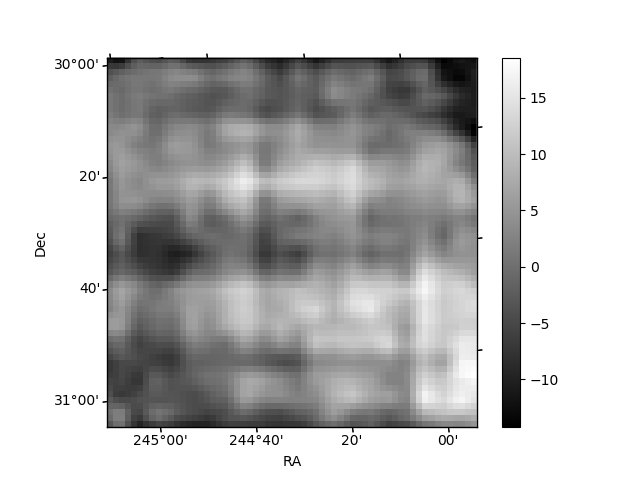
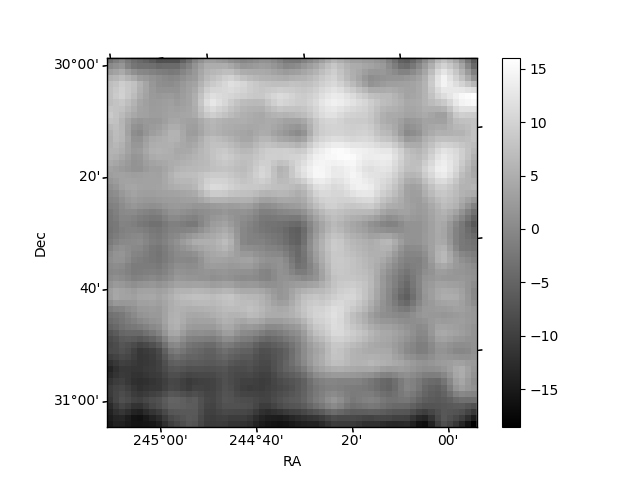
Histogram calculated using DETX and DETY for each event in the final _common_clean file
| Quadrant A | 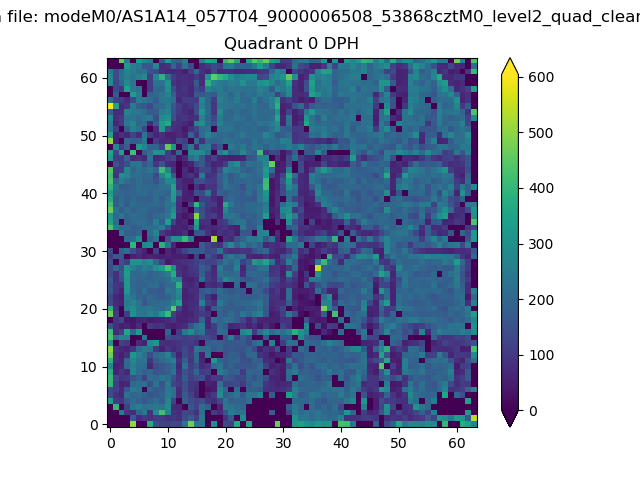 |
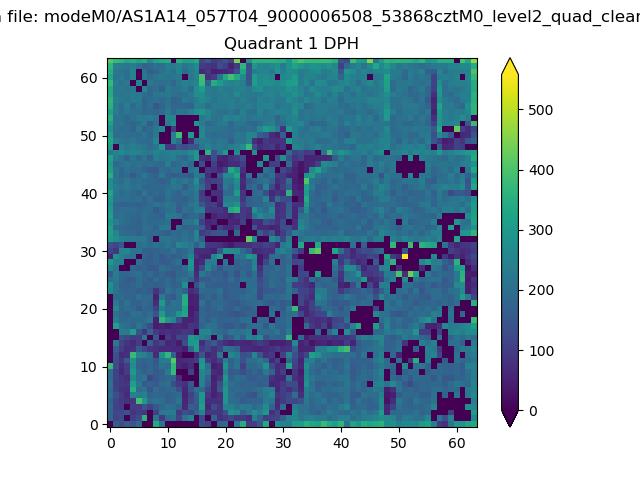 |
Quadrant B |
|---|---|---|---|
| Quadrant D | 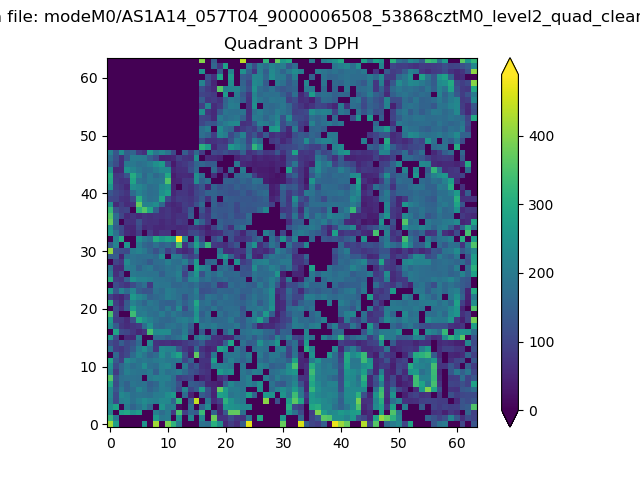 |
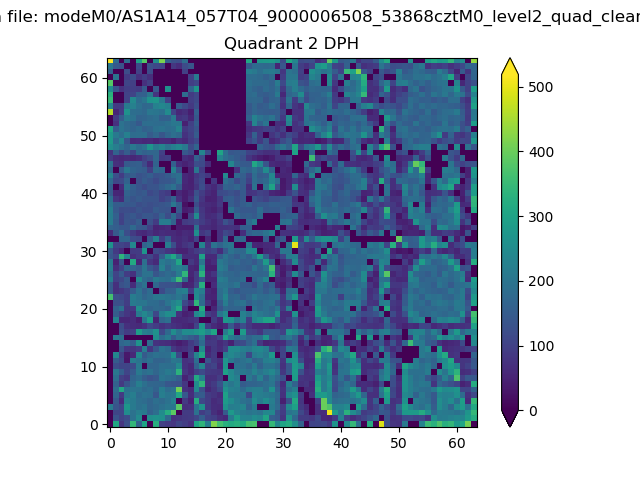 |
Quadrant C |
| Plot type | Count rate plots | Images |
|---|---|---|
| Comparison with Poisson distribution Blue bars denote a histogram of data divided into 1 sec bins. Red curve is a Poisson curve with rate = median count rate of data. |
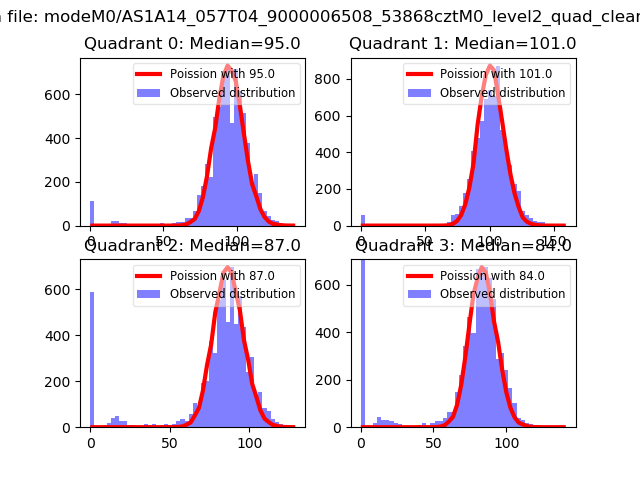 |
 |
| Quadrant-wise count rates Data is divided into 100 sec bins |
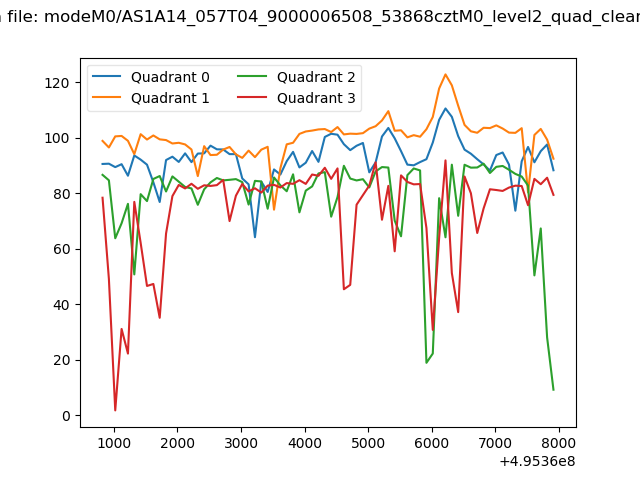 |
|
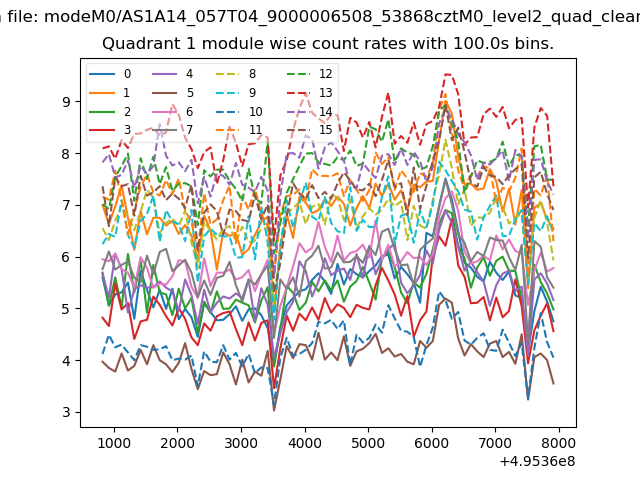
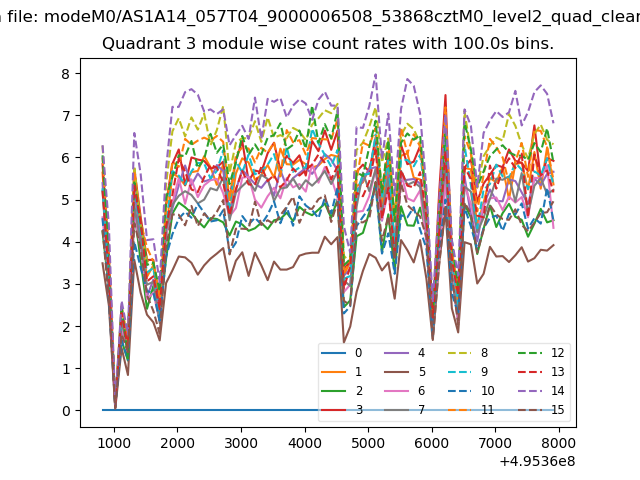
| Module-wise count rates for Quadrant A Data is divided into 100 sec bins |
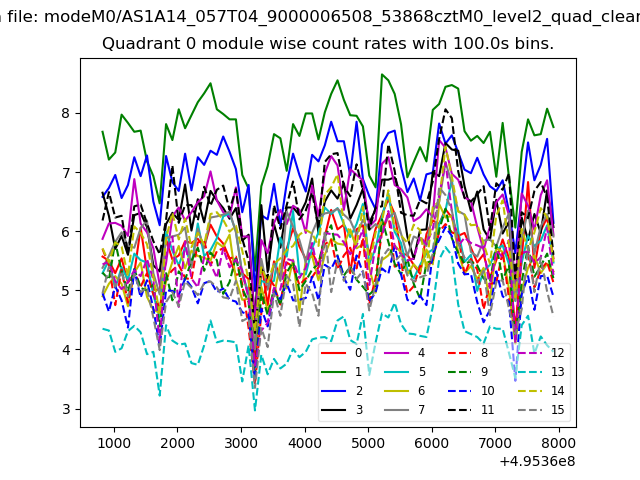 |
 |
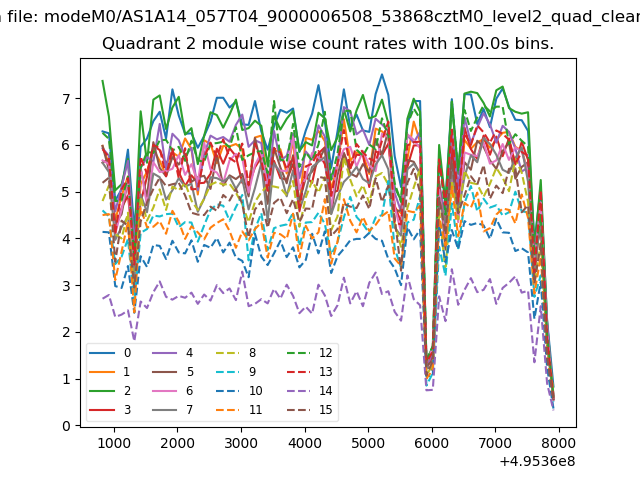
| Module-wise count rates for Quadrant B Data is divided into 100 sec bins |
 |
 |
| Module-wise count rates for Quadrant C Data is divided into 100 sec bins |
 |
 |
| Module-wise count rates for Quadrant D Data is divided into 100 sec bins |
 |
 |
| Parameter | Plot |
|---|---|
| CZT HV Monitor | 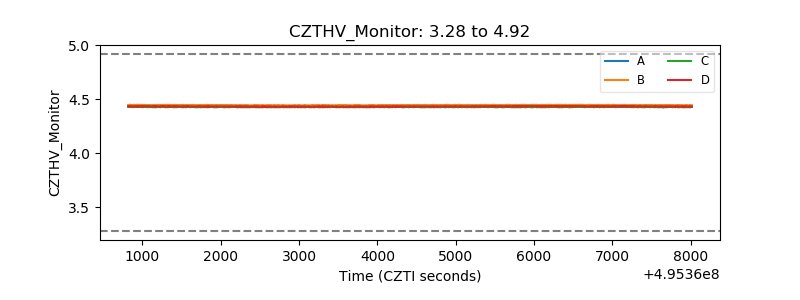 |
| D_VDD | 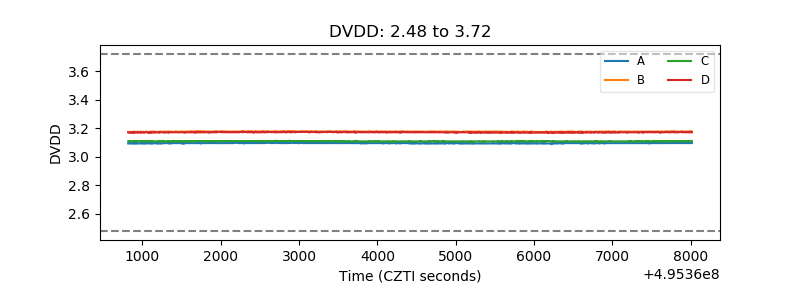 |
| Temperature 1 | 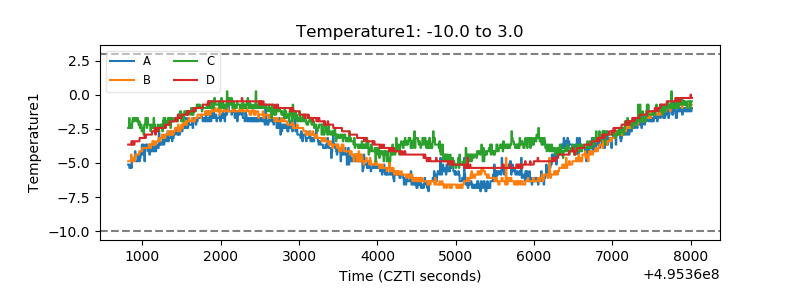 |
| Veto HV Monitor | 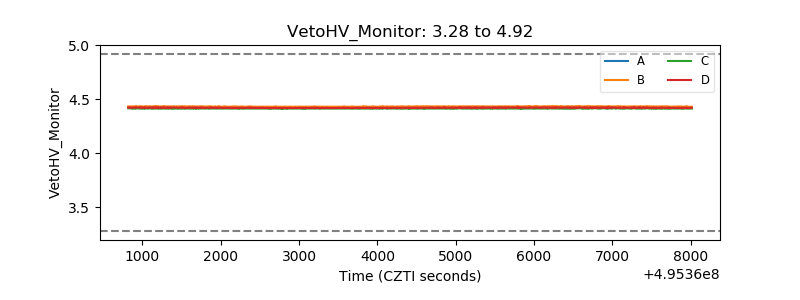 |
| Veto LLD | 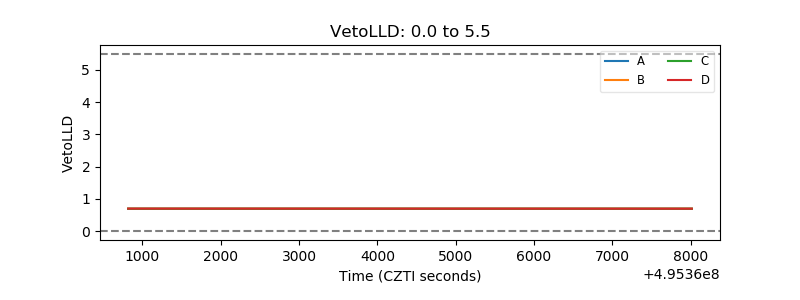 |
| Alpha Counter | 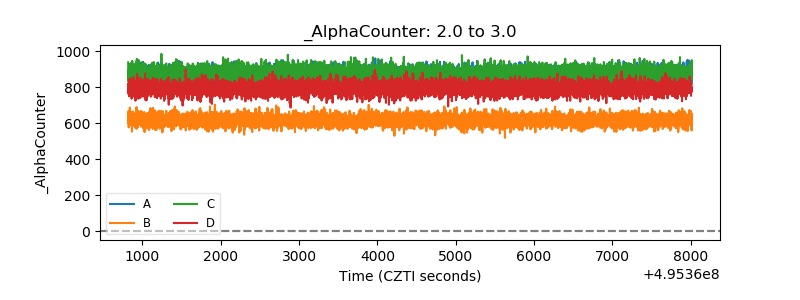 |
| _CPM_Rate | 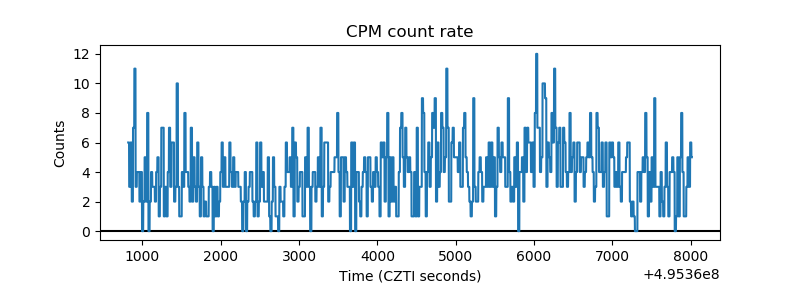 |
| CZT Counter | 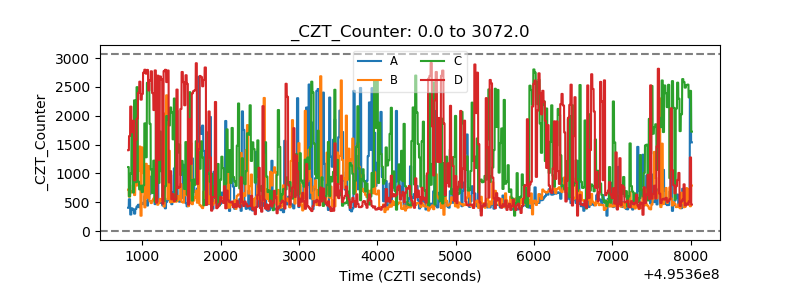 |
| +2.5 Volts monitor | 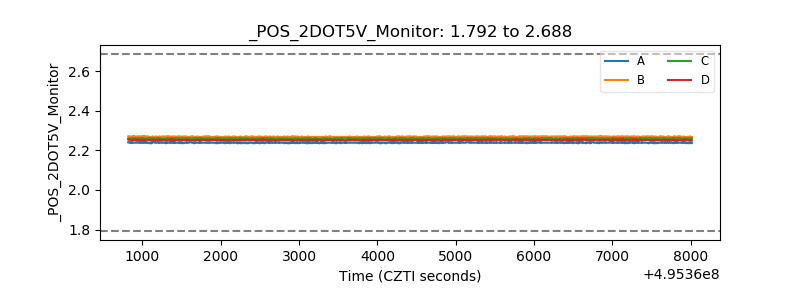 |
| +5 Volts monitor |  |
| _ROLL_ROT | 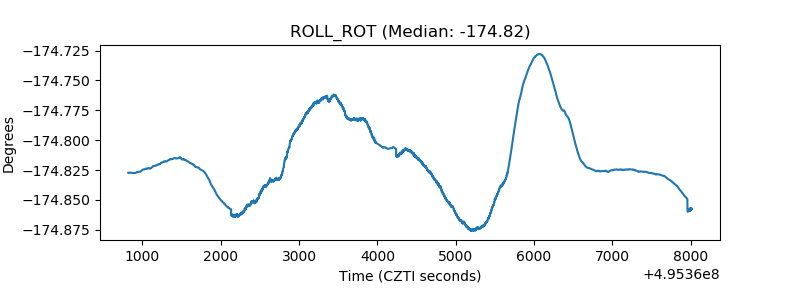 |
| _Roll_DEC | 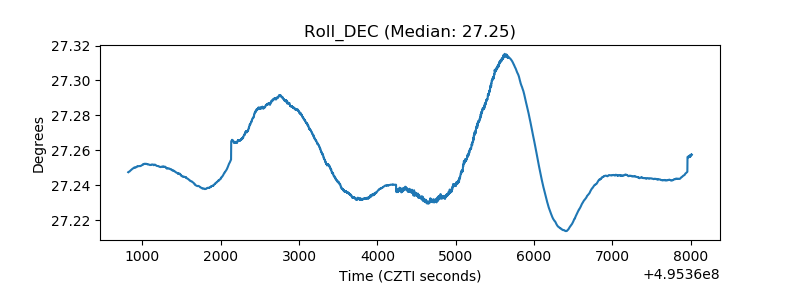 |
| _Roll_RA | 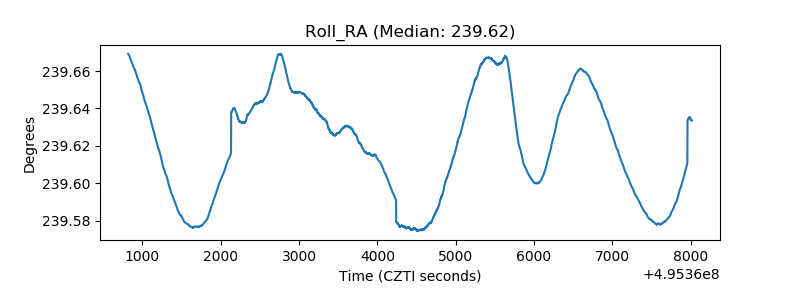 |
| Veto Counter | 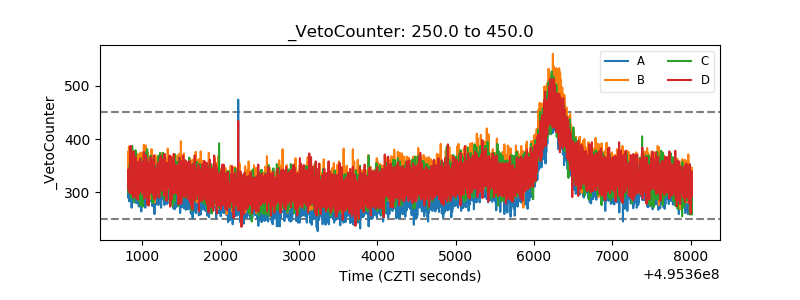 |