| Param | Original file | Final file |
|---|---|---|
| Filename | modeM0/AS1A14_057T04_9000006508_53872cztM0_level2.fits | modeM0/AS1A14_057T04_9000006508_53872cztM0_level2_quad_clean.evt |
| Size (bytes) | 636,724,800 | 81,527,040 |
| Size | 607.2 MB | 77.8 MB |
| Events in quadrant A | 4,251,545 | 576,853 |
| Events in quadrant B | 3,509,579 | 619,514 |
| Events in quadrant C | 9,942,480 | 332,617 |
| Events in quadrant D | 5,380,946 | 502,778 |
| Mode M0 | |||
|---|---|---|---|
| Quadrant | BADHDUFLAG | Total packets | Discarded packets |
| A | 0 | 17028 | 1 |
| B | 0 | 14819 | 1 |
| C | 0 | 33930 | 1 |
| D | 0 | 20345 | 1 |
| Mode SS | |||
|---|---|---|---|
| Quadrant | BADHDUFLAG | Total packets | Discarded packets |
| A | 0 | 128 | 0 |
| B | 0 | 128 | 0 |
| C | 0 | 128 | 0 |
| D | 0 | 128 | 0 |
| Mode M9 | |||
|---|---|---|---|
| Quadrant | BADHDUFLAG | Total packets | Discarded packets |
| A | 0 | 8 | 0 |
| B | 0 | 8 | 0 |
| C | 0 | 8 | 0 |
| D | 0 | 8 | 0 |
| Quadrant | Total seconds | Saturated seconds | Saturation percentage |
|---|---|---|---|
| A | 6247 | 334 | 5.346566% |
| B | 6248 | 161 | 2.576825% |
| C | 6248 | 2809 | 44.958387% |
| D | 6248 | 528 | 8.450704% |
Noise dominated data is calculated using 1-second bins in cleaned event files. If a bin has >2000 counts, and if more than 50% of those come from <1% of pixels, then it is considered to be noise-dominated and hence unusable.
| Quadrant | # 1 sec bins | Bins with >0 counts | Bins with >2000 counts | High rate bins dominated by noise | Noise dominated (total time) | Noise dominated (detector-on time) | Marked lightcurve |
|---|---|---|---|---|---|---|---|
| A | 7092 | 6248 | 251 | 251 | 3.54% | 4.02% | 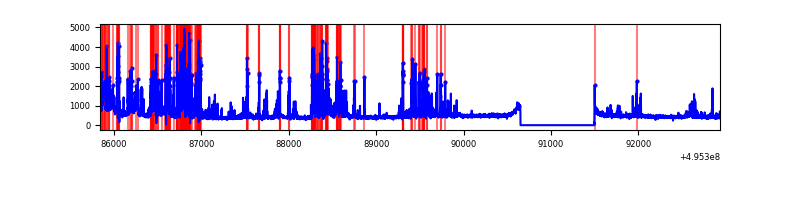 |
| B | 7093 | 6248 | 50 | 50 | 0.70% | 0.80% | 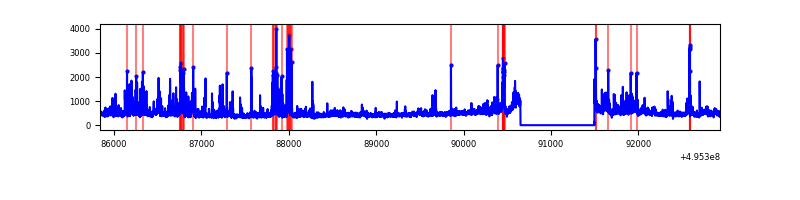 |
| C | 7093 | 6249 | 2166 | 2166 | 30.54% | 34.66% | 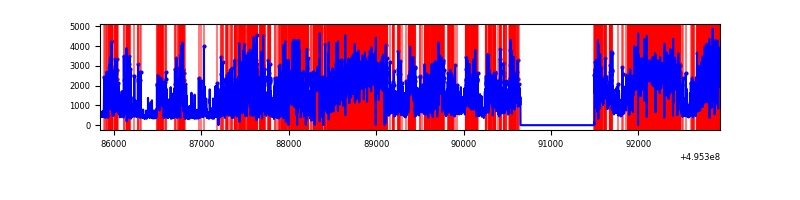 |
| D | 7093 | 6249 | 477 | 477 | 6.72% | 7.63% | 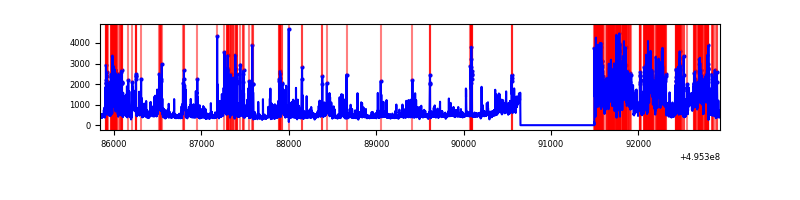 |
Top three noisy pixels from each quadrant. If the there are fewer than three noisy pixels in the level2.evt file, extra rows are filled as -1
| Pixel properties | Quadrant properties | ||||||
|---|---|---|---|---|---|---|---|
| Quadrant | DetID | PixID | Counts | Sigma | Mean | Median | Sigma |
| A | 3 | 62 | 1029274 | 6345.12 | 656 | 640 | 162.1 |
| A | 10 | 253 | 199694 | 1227.86 | 656 | 640 | 162.1 |
| A | 15 | 174 | 190728 | 1172.56 | 656 | 640 | 162.1 |
| B | 8 | 234 | 278404 | 1961.21 | 659 | 636 | 141.6 |
| B | 0 | 171 | 136930 | 962.32 | 659 | 636 | 141.6 |
| B | 5 | 185 | 110812 | 777.91 | 659 | 636 | 141.6 |
| C | 13 | 3 | 2879851 | 21939.69 | 478 | 474 | 131.2 |
| C | 1 | 241 | 2025196 | 15427.56 | 478 | 474 | 131.2 |
| C | 15 | 224 | 1970386 | 15009.93 | 478 | 474 | 131.2 |
| D | 8 | 176 | 2096853 | 11528.7 | 633 | 606 | 181.8 |
| D | 2 | 249 | 146083 | 800.08 | 633 | 606 | 181.8 |
| D | 7 | 70 | 119164 | 652.03 | 633 | 606 | 181.8 |
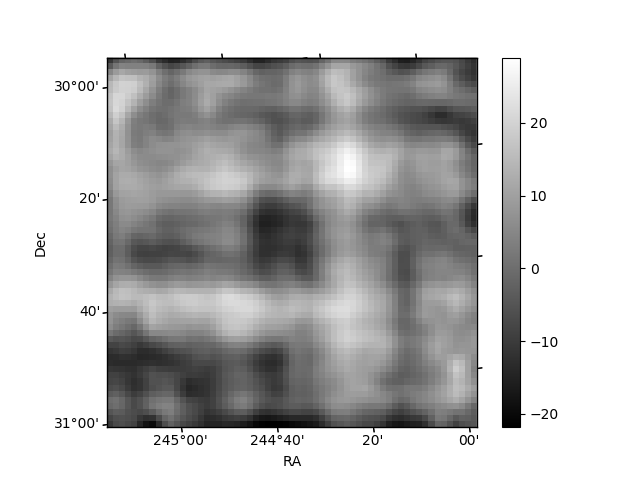
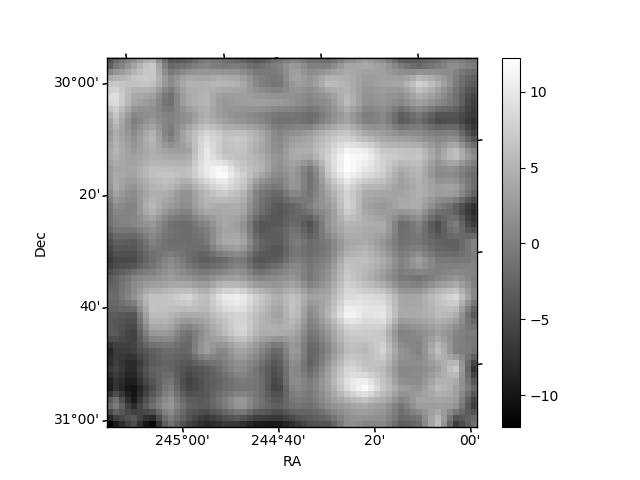
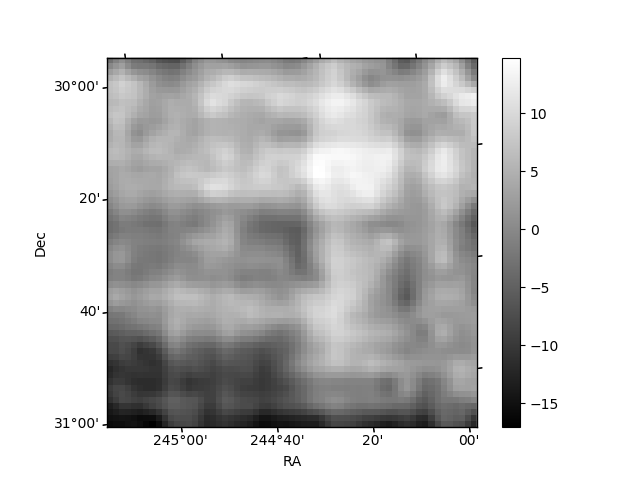
Histogram calculated using DETX and DETY for each event in the final _common_clean file
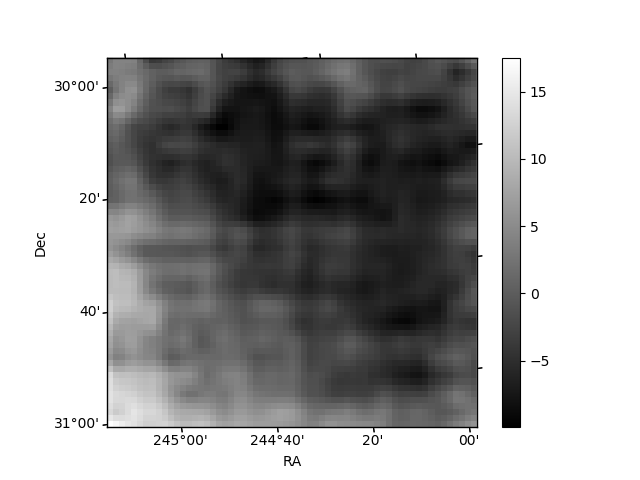
| Quadrant A | 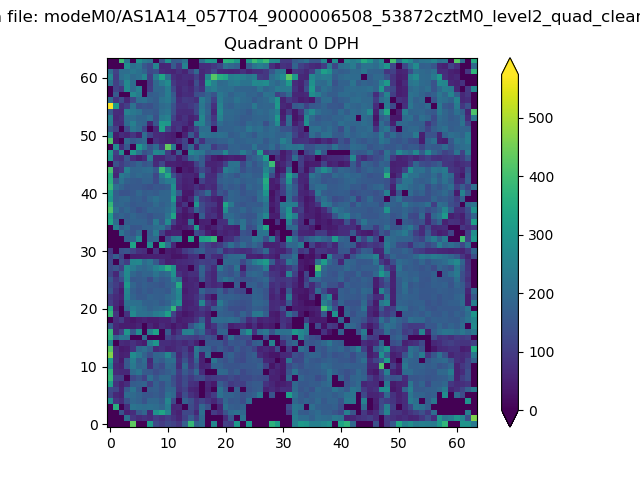 |
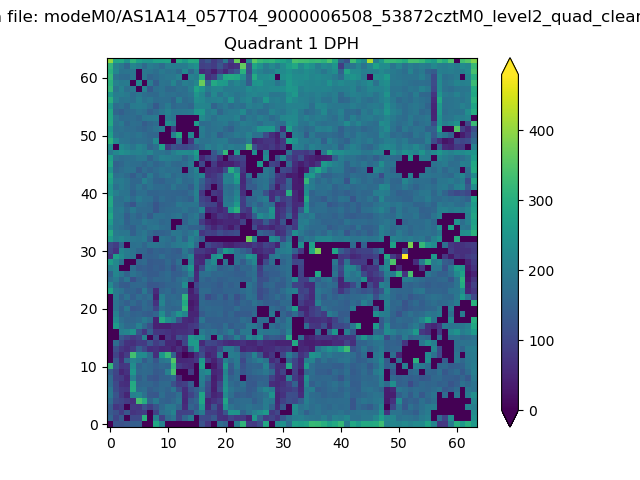 |
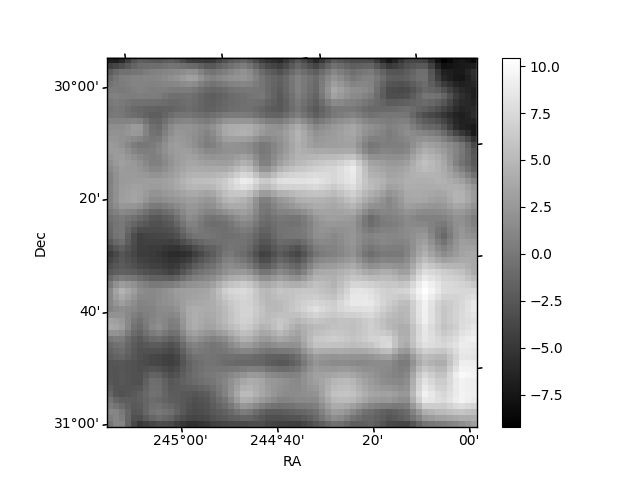
Quadrant B |
|---|---|---|---|
| Quadrant D | 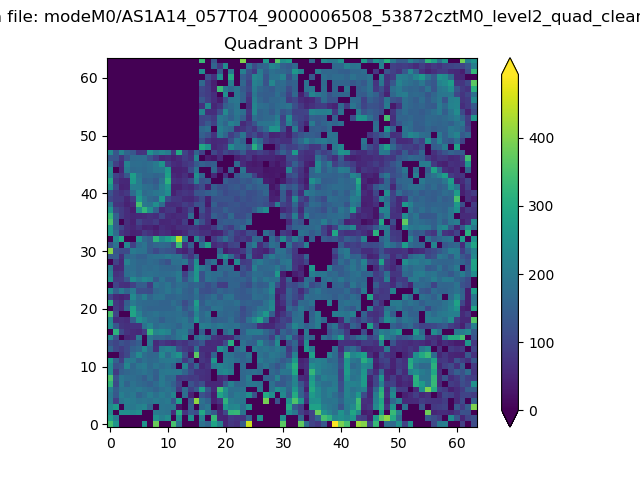 |
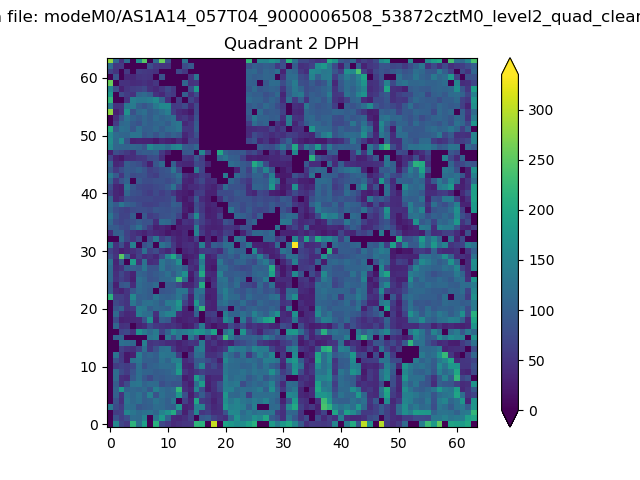 |
Quadrant C |
| Plot type | Count rate plots | Images |
|---|---|---|
| Comparison with Poisson distribution Blue bars denote a histogram of data divided into 1 sec bins. Red curve is a Poisson curve with rate = median count rate of data. |
 |
 |
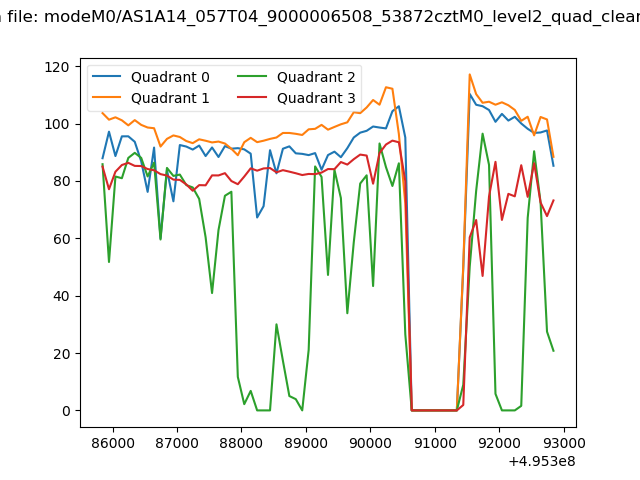
| Quadrant-wise count rates Data is divided into 100 sec bins |
 |
|
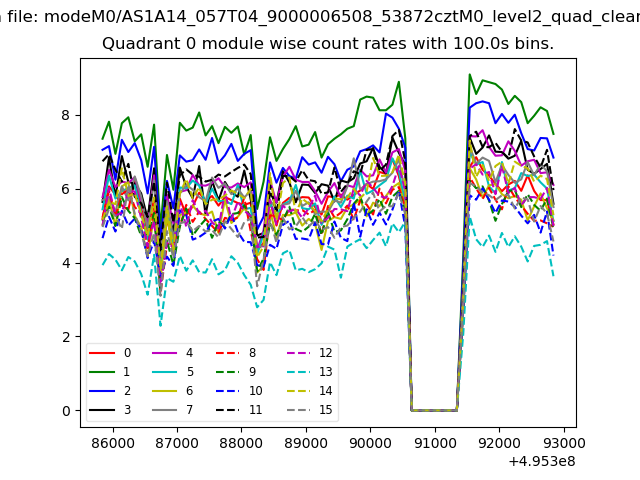
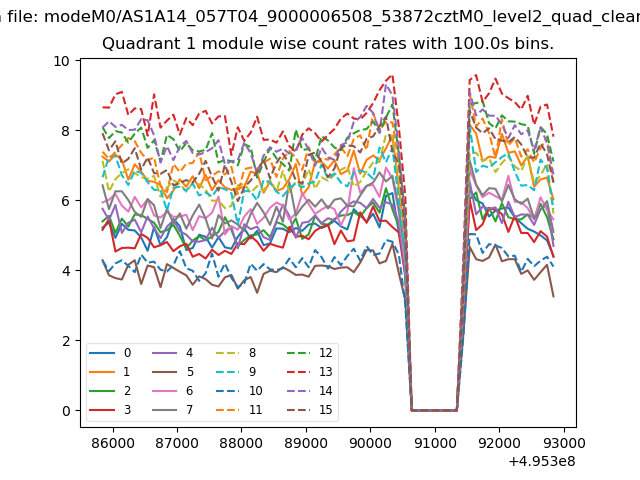
| Module-wise count rates for Quadrant A Data is divided into 100 sec bins |
 |
 |
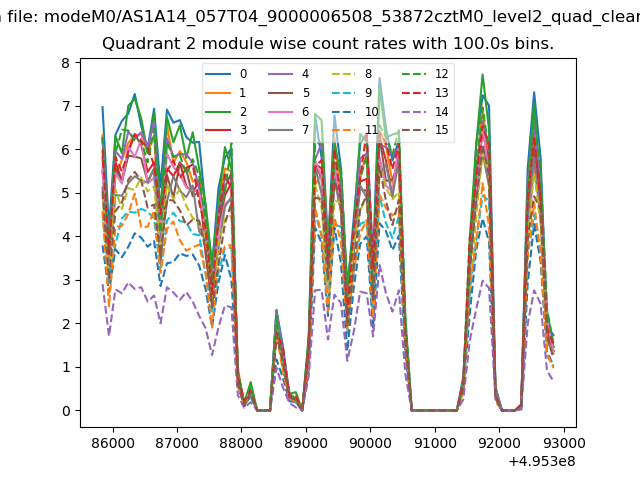
| Module-wise count rates for Quadrant B Data is divided into 100 sec bins |
 |
 |
| Module-wise count rates for Quadrant C Data is divided into 100 sec bins |
 |
 |
| Module-wise count rates for Quadrant D Data is divided into 100 sec bins |
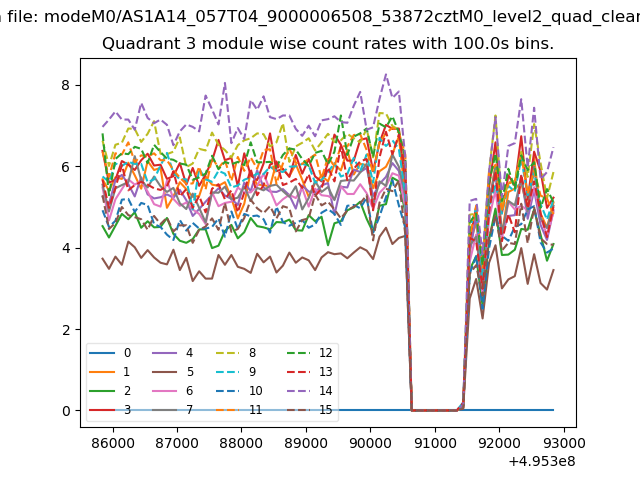 |
 |
| Parameter | Plot |
|---|---|
| CZT HV Monitor | 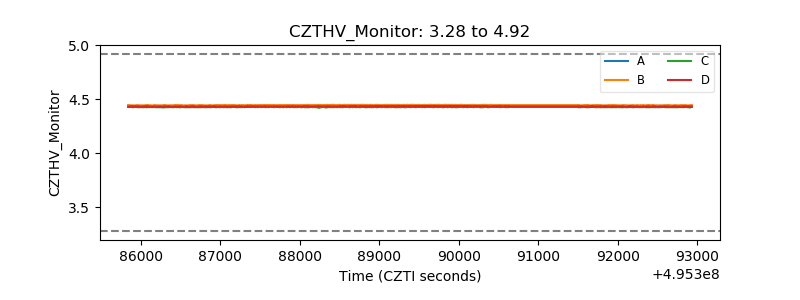 |
| D_VDD | 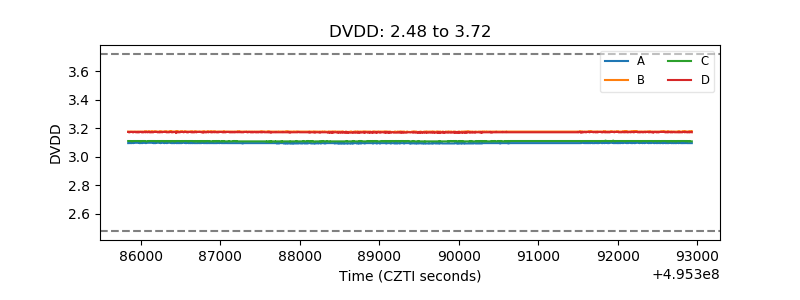 |
| Temperature 1 | 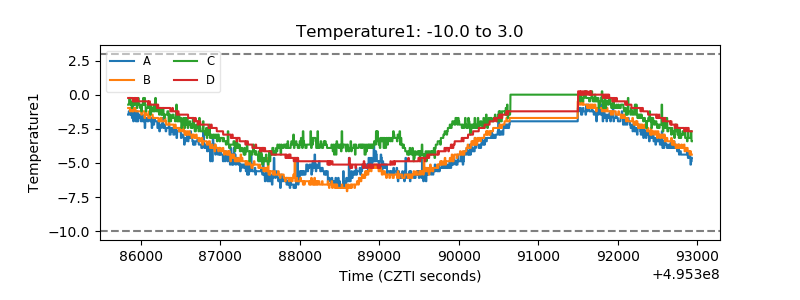 |
| Veto HV Monitor | 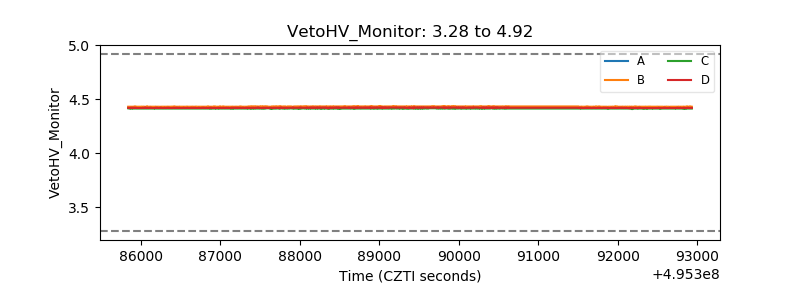 |
| Veto LLD | 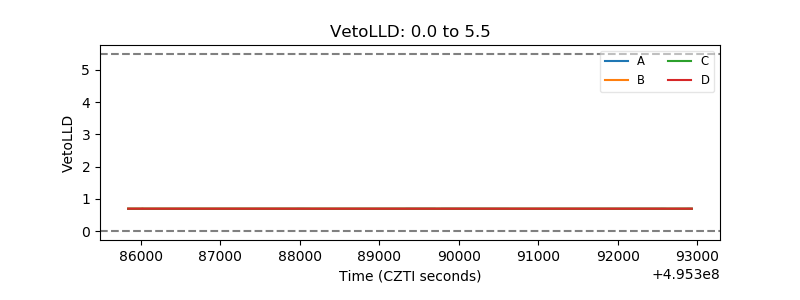 |
| Alpha Counter | 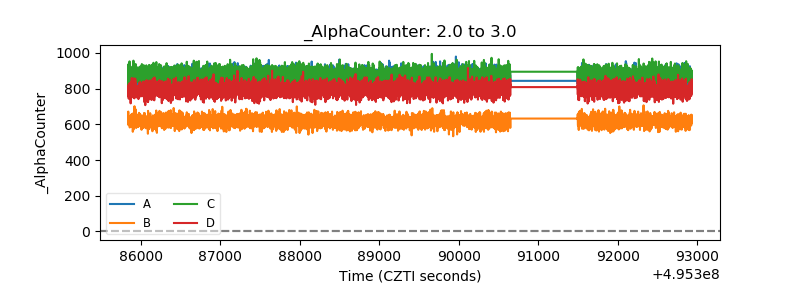 |
| _CPM_Rate | 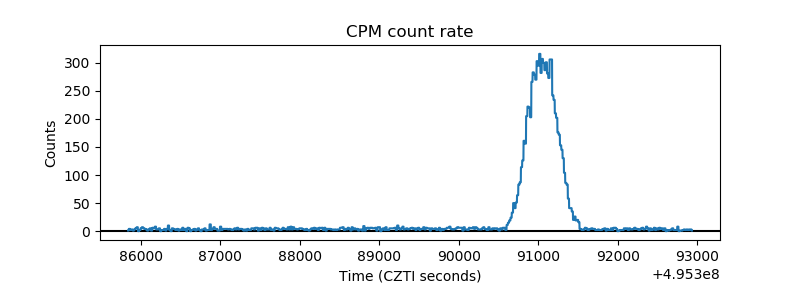 |
| CZT Counter | 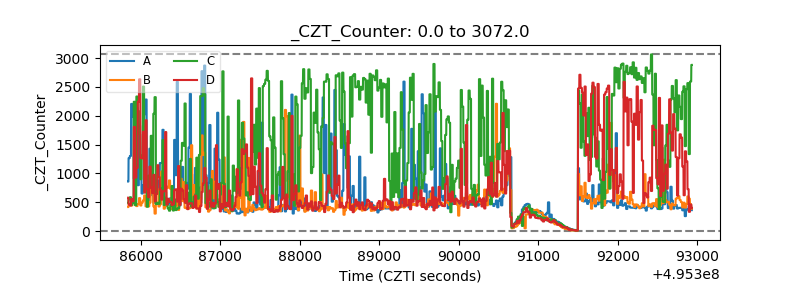 |
| +2.5 Volts monitor |  |
| +5 Volts monitor |  |
| _ROLL_ROT | 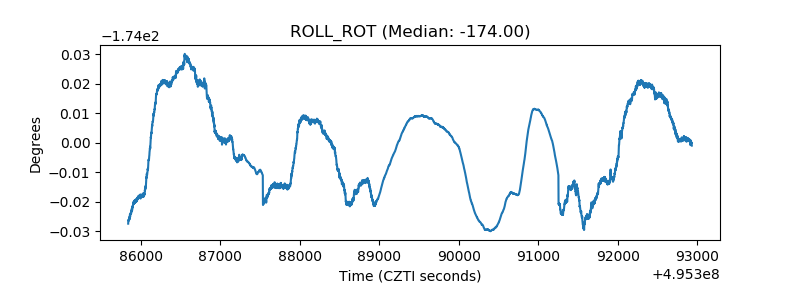 |
| _Roll_DEC | 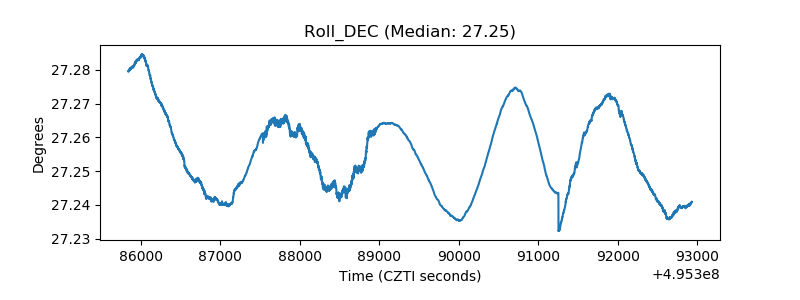 |
| _Roll_RA | 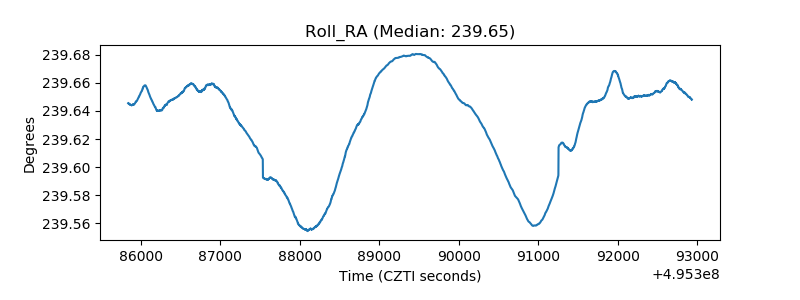 |
| Veto Counter | 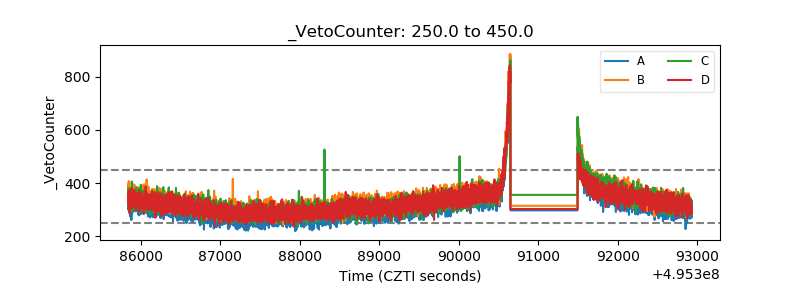 |