| Param | Original file | Final file |
|---|---|---|
| Filename | modeM0/AS1A14_057T04_9000006508_53874cztM0_level2.fits | modeM0/AS1A14_057T04_9000006508_53874cztM0_level2_quad_clean.evt |
| Size (bytes) | 595,664,640 | 86,284,800 |
| Size | 568.1 MB | 82.3 MB |
| Events in quadrant A | 2,990,372 | 609,313 |
| Events in quadrant B | 3,774,351 | 637,792 |
| Events in quadrant C | 8,984,755 | 420,504 |
| Events in quadrant D | 5,810,438 | 503,565 |
| Mode M0 | |||
|---|---|---|---|
| Quadrant | BADHDUFLAG | Total packets | Discarded packets |
| A | 0 | 13513 | 1 |
| B | 0 | 15638 | 1 |
| C | 0 | 31068 | 1 |
| D | 0 | 21735 | 1 |
| Mode SS | |||
|---|---|---|---|
| Quadrant | BADHDUFLAG | Total packets | Discarded packets |
| A | 0 | 130 | 0 |
| B | 0 | 130 | 0 |
| C | 0 | 130 | 0 |
| D | 0 | 130 | 0 |
| Mode M9 | |||
|---|---|---|---|
| Quadrant | BADHDUFLAG | Total packets | Discarded packets |
| A | 0 | 10 | 0 |
| B | 0 | 10 | 0 |
| C | 0 | 10 | 0 |
| D | 0 | 10 | 0 |
| Quadrant | Total seconds | Saturated seconds | Saturation percentage |
|---|---|---|---|
| A | 6313 | 50 | 0.792016% |
| B | 6314 | 152 | 2.407349% |
| C | 6314 | 1936 | 30.662021% |
| D | 6314 | 640 | 10.136205% |
Noise dominated data is calculated using 1-second bins in cleaned event files. If a bin has >2000 counts, and if more than 50% of those come from <1% of pixels, then it is considered to be noise-dominated and hence unusable.
| Quadrant | # 1 sec bins | Bins with >0 counts | Bins with >2000 counts | High rate bins dominated by noise | Noise dominated (total time) | Noise dominated (detector-on time) | Marked lightcurve |
|---|---|---|---|---|---|---|---|
| A | 7328 | 6314 | 34 | 34 | 0.46% | 0.54% | 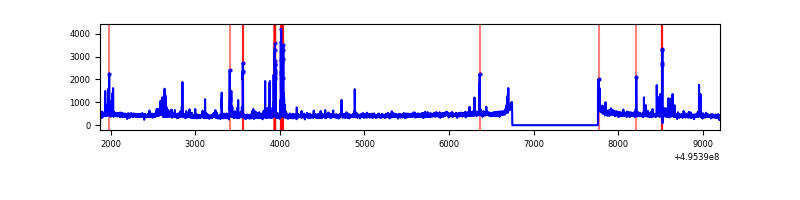 |
| B | 7329 | 6315 | 88 | 88 | 1.20% | 1.39% | 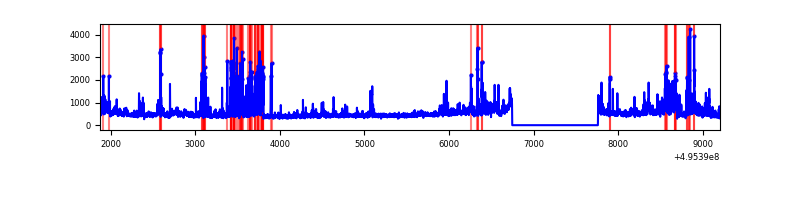 |
| C | 7329 | 6315 | 1680 | 1680 | 22.92% | 26.60% | 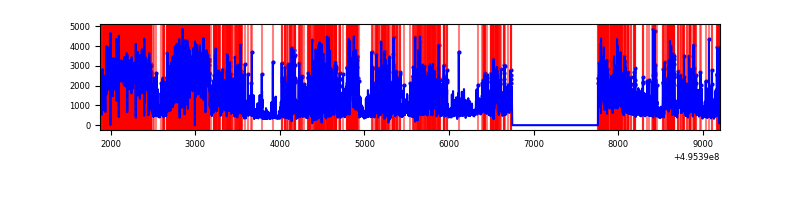 |
| D | 7329 | 6315 | 633 | 633 | 8.64% | 10.02% | 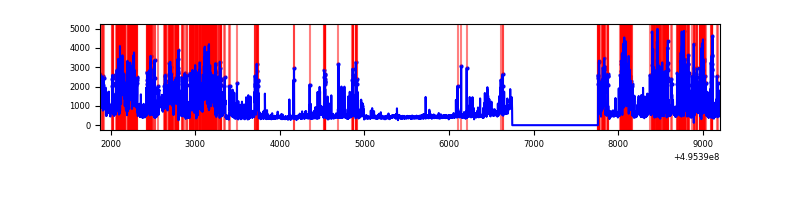 |
Top three noisy pixels from each quadrant. If the there are fewer than three noisy pixels in the level2.evt file, extra rows are filled as -1
| Pixel properties | Quadrant properties | ||||||
|---|---|---|---|---|---|---|---|
| Quadrant | DetID | PixID | Counts | Sigma | Mean | Median | Sigma |
| A | 3 | 62 | 124286 | 736.71 | 672 | 653 | 167.8 |
| A | 15 | 174 | 114820 | 680.3 | 672 | 653 | 167.8 |
| A | 0 | 8 | 26967 | 156.8 | 672 | 653 | 167.8 |
| B | 4 | 81 | 295777 | 2079.02 | 666 | 644 | 142.0 |
| B | 5 | 185 | 168947 | 1185.59 | 666 | 644 | 142.0 |
| B | 0 | 213 | 130401 | 914.05 | 666 | 644 | 142.0 |
| C | 15 | 224 | 2903321 | 18898.34 | 554 | 548 | 153.6 |
| C | 1 | 241 | 2158658 | 14050.25 | 554 | 548 | 153.6 |
| C | 15 | 209 | 620700 | 4037.46 | 554 | 548 | 153.6 |
| D | 8 | 176 | 2246842 | 12307.78 | 632 | 604 | 182.5 |
| D | 7 | 70 | 213881 | 1168.61 | 632 | 604 | 182.5 |
| D | 13 | 153 | 208612 | 1139.73 | 632 | 604 | 182.5 |
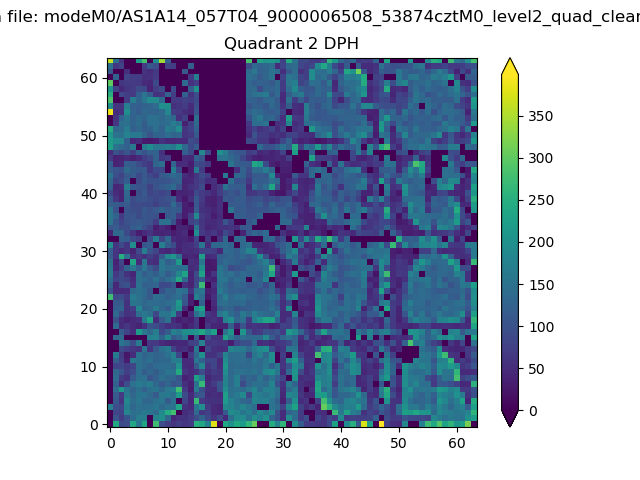
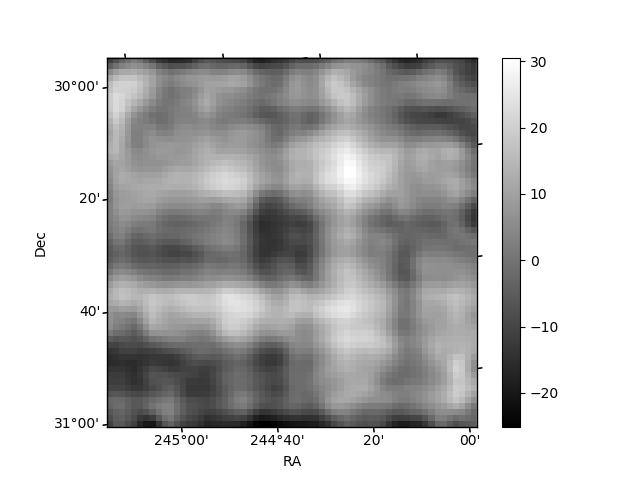
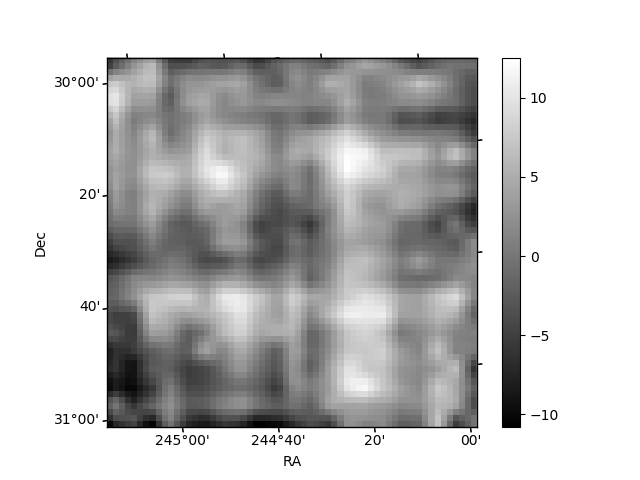
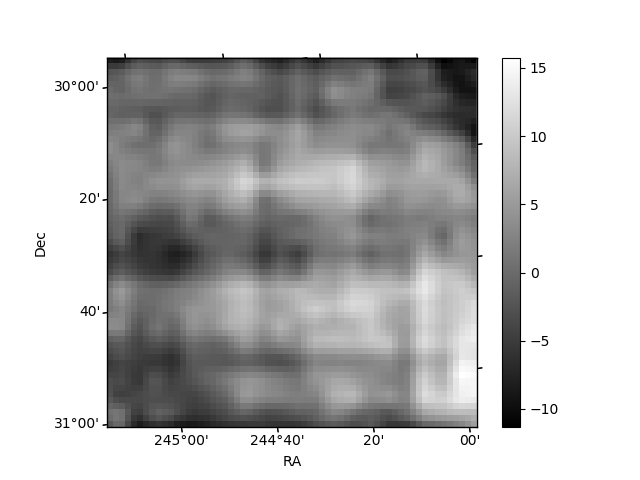
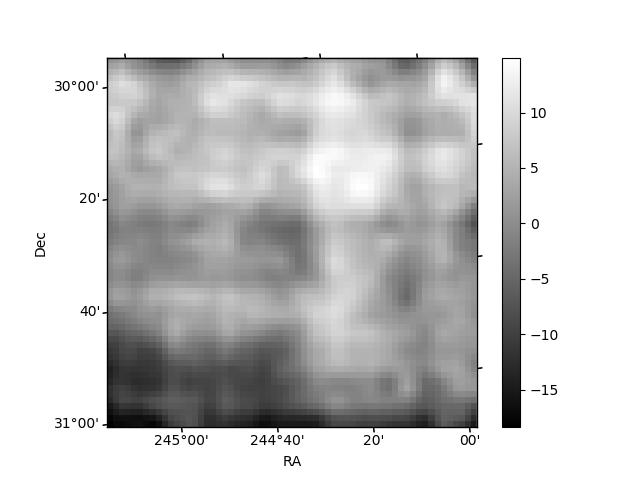
Histogram calculated using DETX and DETY for each event in the final _common_clean file
| Quadrant A | 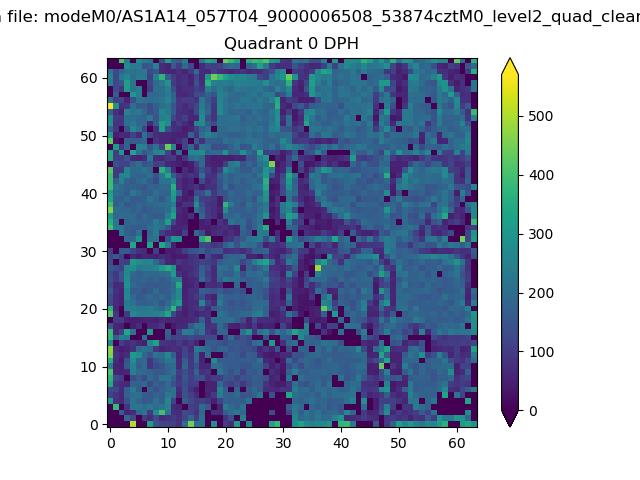 |
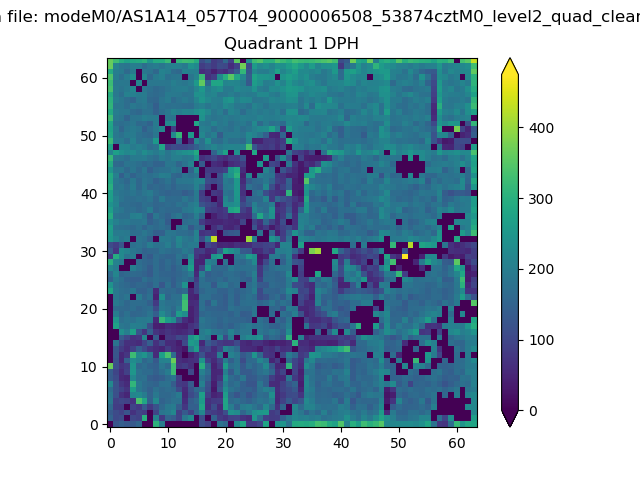 |
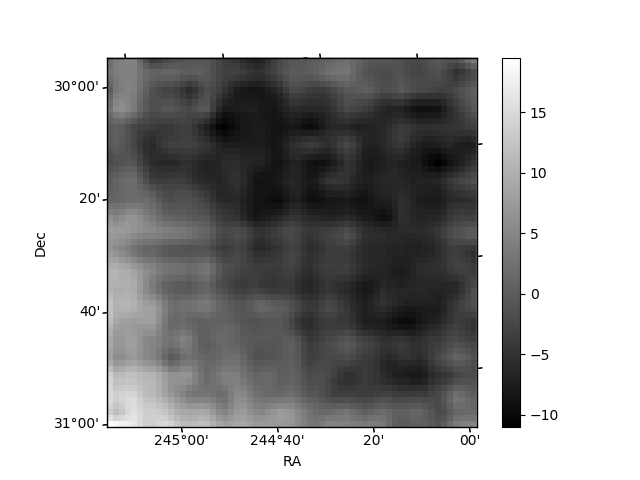
Quadrant B |
|---|---|---|---|
| Quadrant D | 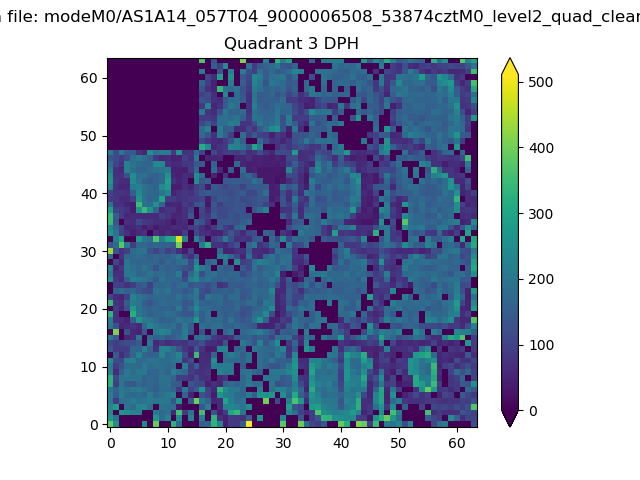 |
 |
Quadrant C |
| Plot type | Count rate plots | Images |
|---|---|---|
| Comparison with Poisson distribution Blue bars denote a histogram of data divided into 1 sec bins. Red curve is a Poisson curve with rate = median count rate of data. |
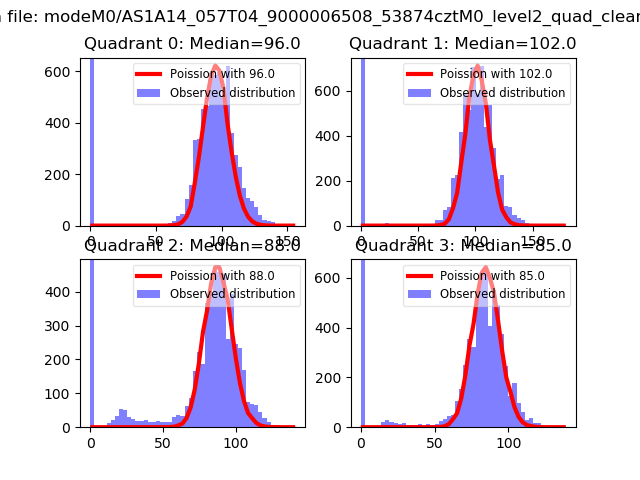 |
 |
| Quadrant-wise count rates Data is divided into 100 sec bins |
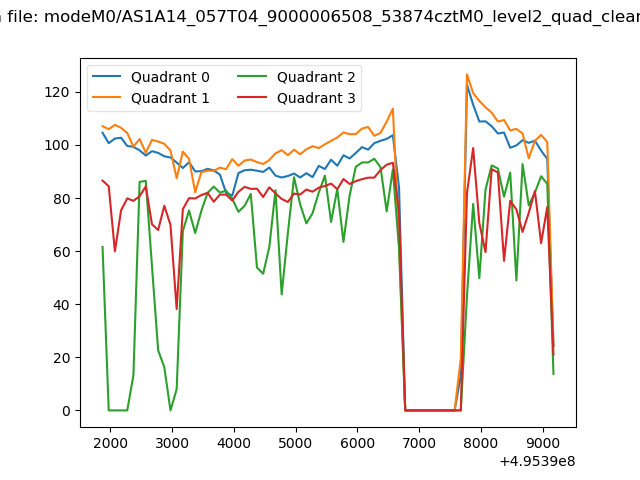 |
|
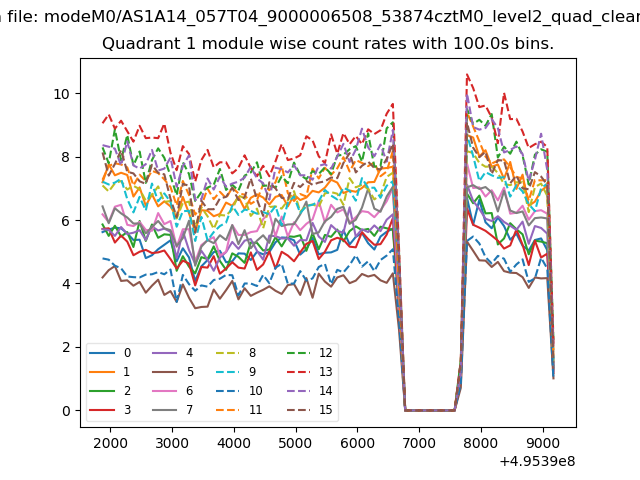
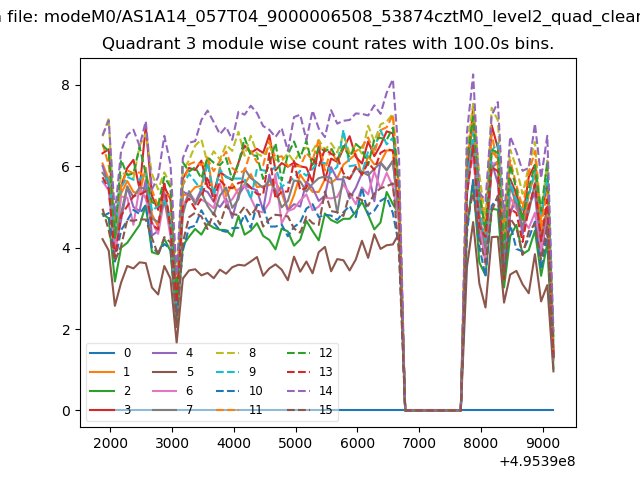
| Module-wise count rates for Quadrant A Data is divided into 100 sec bins |
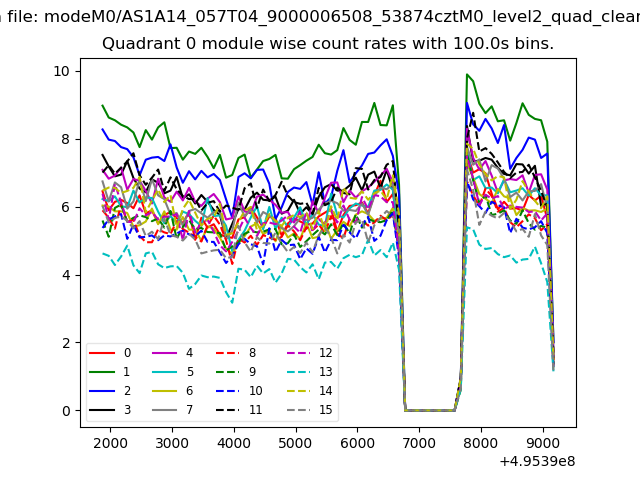 |
 |
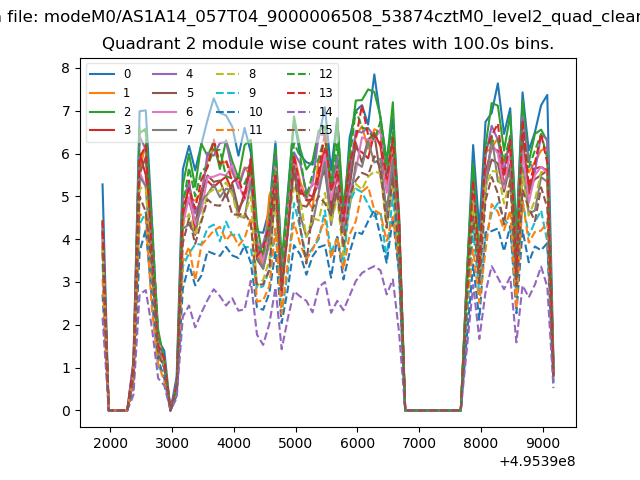
| Module-wise count rates for Quadrant B Data is divided into 100 sec bins |
 |
 |
| Module-wise count rates for Quadrant C Data is divided into 100 sec bins |
 |
 |
| Module-wise count rates for Quadrant D Data is divided into 100 sec bins |
 |
 |
| Parameter | Plot |
|---|---|
| CZT HV Monitor | 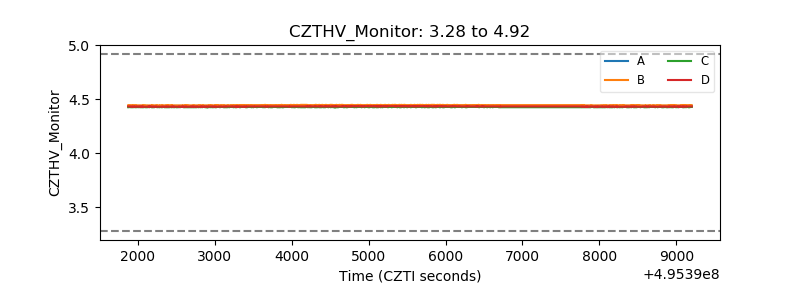 |
| D_VDD | 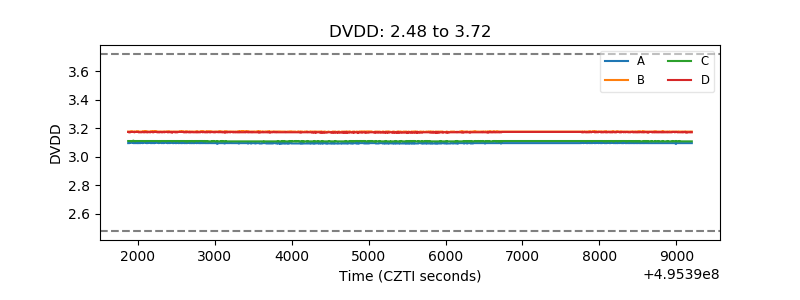 |
| Temperature 1 | 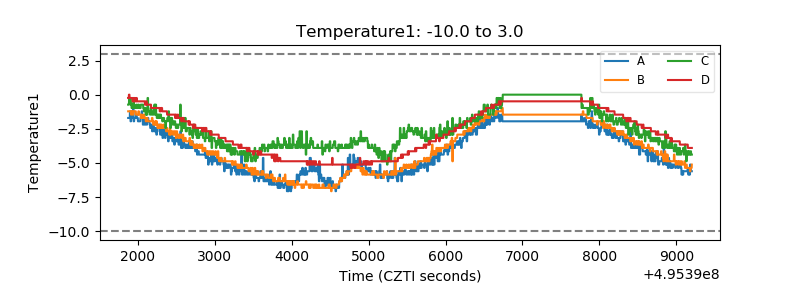 |
| Veto HV Monitor | 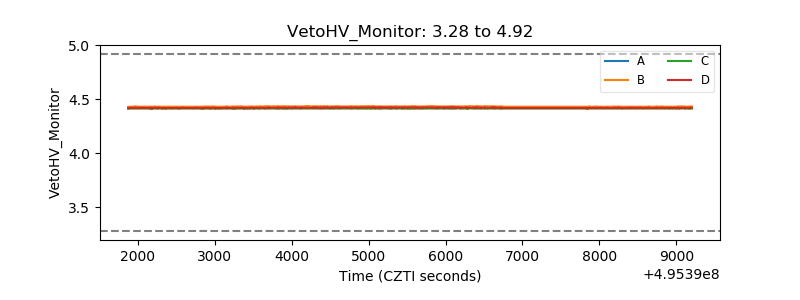 |
| Veto LLD | 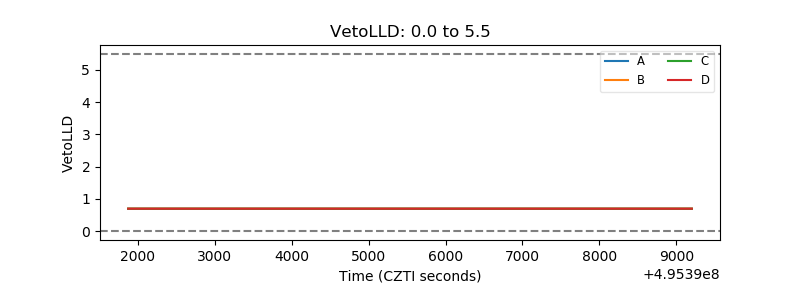 |
| Alpha Counter | 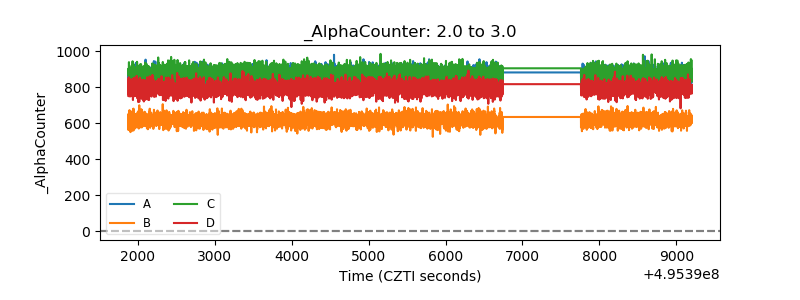 |
| _CPM_Rate | 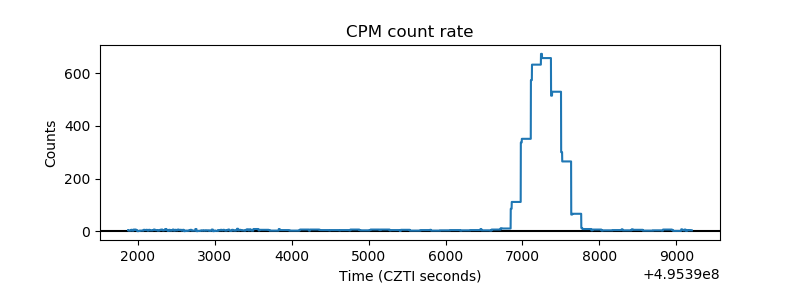 |
| CZT Counter | 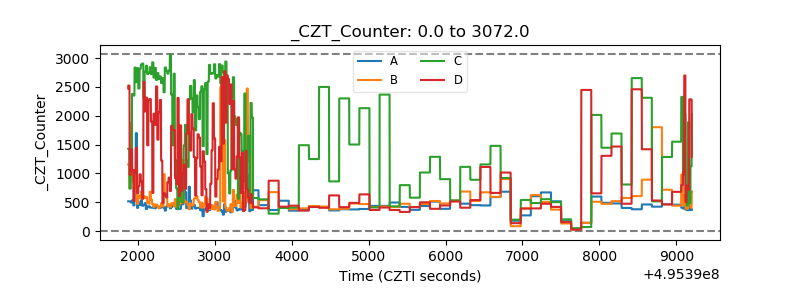 |
| +2.5 Volts monitor |  |
| +5 Volts monitor | 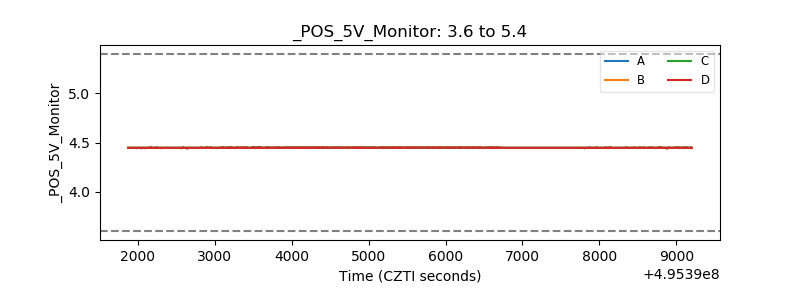 |
| _ROLL_ROT | 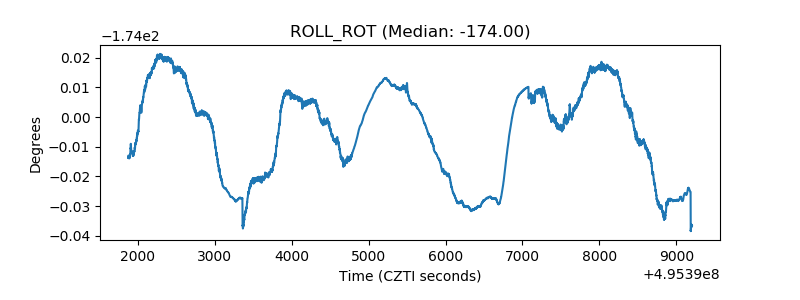 |
| _Roll_DEC | 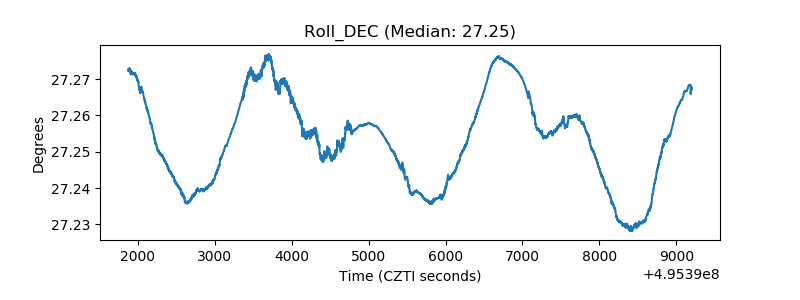 |
| _Roll_RA | 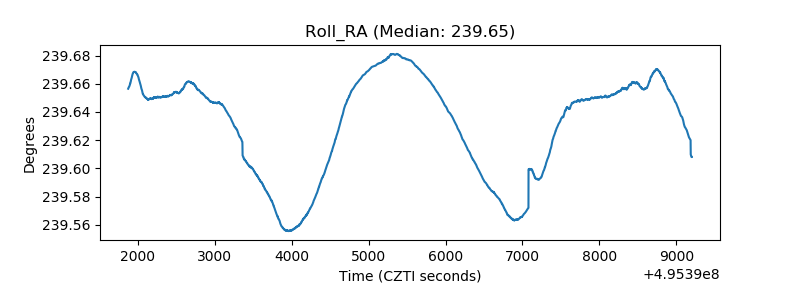 |
| Veto Counter | 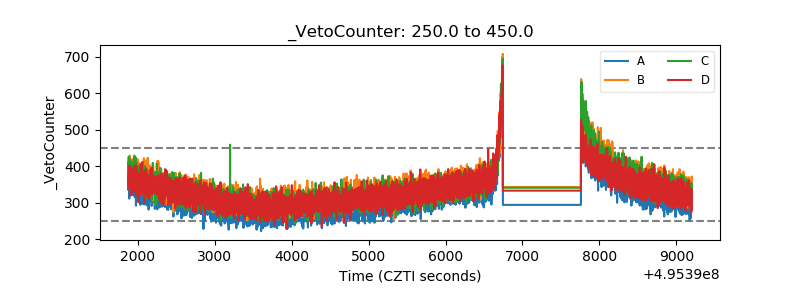 |