| Param | Original file | Final file |
|---|---|---|
| Filename | modeM0/AS1A14_057T04_9000006508_53875cztM0_level2.fits | modeM0/AS1A14_057T04_9000006508_53875cztM0_level2_quad_clean.evt |
| Size (bytes) | 652,000,320 | 84,219,840 |
| Size | 621.8 MB | 80.3 MB |
| Events in quadrant A | 3,382,307 | 601,472 |
| Events in quadrant B | 3,943,089 | 639,407 |
| Events in quadrant C | 7,074,383 | 487,937 |
| Events in quadrant D | 9,258,170 | 390,946 |
| Mode M0 | |||
|---|---|---|---|
| Quadrant | BADHDUFLAG | Total packets | Discarded packets |
| A | 0 | 14532 | 5 |
| B | 0 | 15841 | 1 |
| C | 0 | 25287 | 1 |
| D | 0 | 31745 | 1 |
| Mode SS | |||
|---|---|---|---|
| Quadrant | BADHDUFLAG | Total packets | Discarded packets |
| A | 0 | 126 | 0 |
| B | 0 | 126 | 0 |
| C | 0 | 126 | 0 |
| D | 0 | 126 | 0 |
| Mode M9 | |||
|---|---|---|---|
| Quadrant | BADHDUFLAG | Total packets | Discarded packets |
| A | 0 | 11 | 0 |
| B | 0 | 11 | 0 |
| C | 0 | 11 | 0 |
| D | 0 | 11 | 0 |
| Quadrant | Total seconds | Saturated seconds | Saturation percentage |
|---|---|---|---|
| A | 6155 | 138 | 2.242080% |
| B | 6156 | 144 | 2.339181% |
| C | 6156 | 1162 | 18.875893% |
| D | 6156 | 1982 | 32.196231% |
Noise dominated data is calculated using 1-second bins in cleaned event files. If a bin has >2000 counts, and if more than 50% of those come from <1% of pixels, then it is considered to be noise-dominated and hence unusable.
| Quadrant | # 1 sec bins | Bins with >0 counts | Bins with >2000 counts | High rate bins dominated by noise | Noise dominated (total time) | Noise dominated (detector-on time) | Marked lightcurve |
|---|---|---|---|---|---|---|---|
| A | 7270 | 6156 | 164 | 164 | 2.26% | 2.66% | 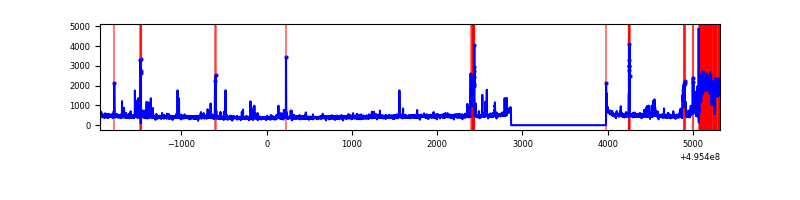 |
| B | 7271 | 6157 | 72 | 72 | 0.99% | 1.17% | 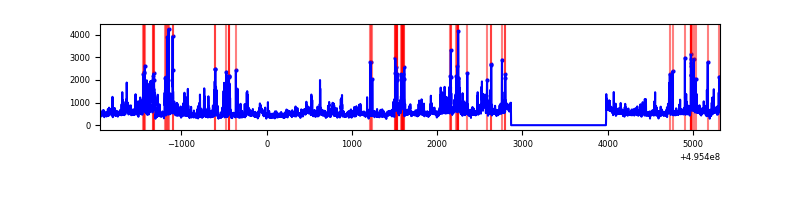 |
| C | 7271 | 6157 | 913 | 913 | 12.56% | 14.83% | 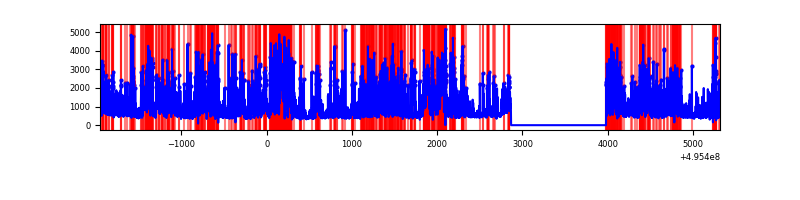 |
| D | 7271 | 6156 | 1804 | 1804 | 24.81% | 29.30% | 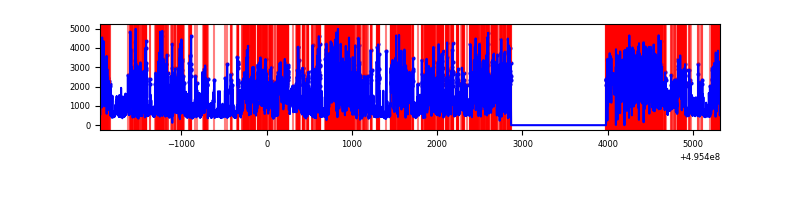 |
Top three noisy pixels from each quadrant. If the there are fewer than three noisy pixels in the level2.evt file, extra rows are filled as -1
| Pixel properties | Quadrant properties | ||||||
|---|---|---|---|---|---|---|---|
| Quadrant | DetID | PixID | Counts | Sigma | Mean | Median | Sigma |
| A | 12 | 115 | 465556 | 2825.78 | 662 | 646 | 164.5 |
| A | 15 | 174 | 166492 | 1008.03 | 662 | 646 | 164.5 |
| A | 3 | 62 | 36025 | 215.03 | 662 | 646 | 164.5 |
| B | 5 | 250 | 275211 | 1953.22 | 661 | 639 | 140.6 |
| B | 4 | 81 | 242993 | 1724.03 | 661 | 639 | 140.6 |
| B | 0 | 213 | 192420 | 1364.27 | 661 | 639 | 140.6 |
| C | 15 | 224 | 3502535 | 21164.93 | 598 | 593 | 165.5 |
| C | 12 | 2 | 349312 | 2107.58 | 598 | 593 | 165.5 |
| C | 2 | 12 | 275956 | 1664.23 | 598 | 593 | 165.5 |
| D | 8 | 176 | 5842307 | 37446.45 | 536 | 511 | 156.0 |
| D | 2 | 172 | 657796 | 4213.26 | 536 | 511 | 156.0 |
| D | 13 | 153 | 248307 | 1588.4 | 536 | 511 | 156.0 |
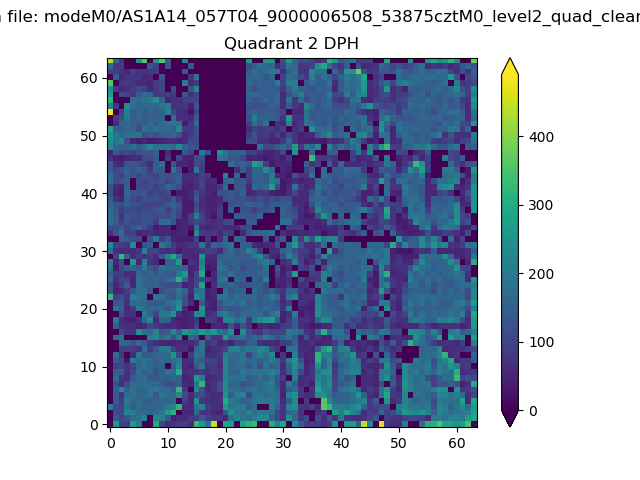
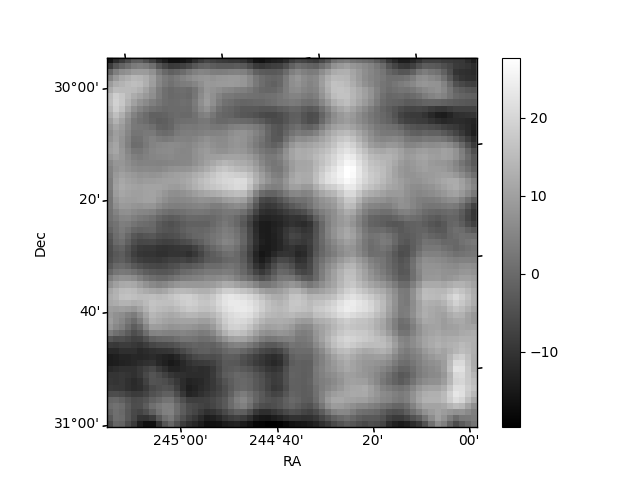
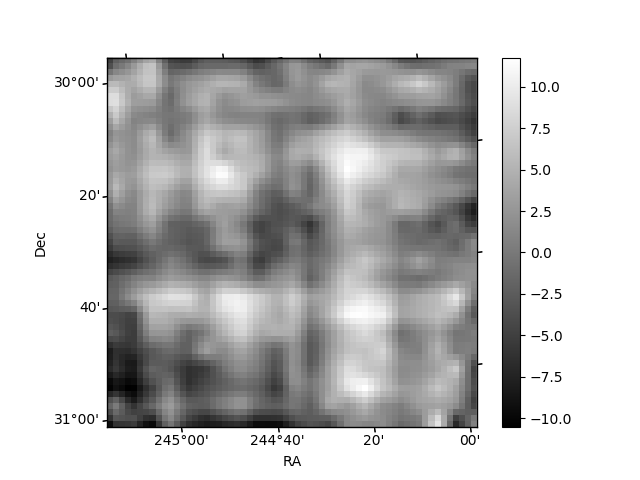
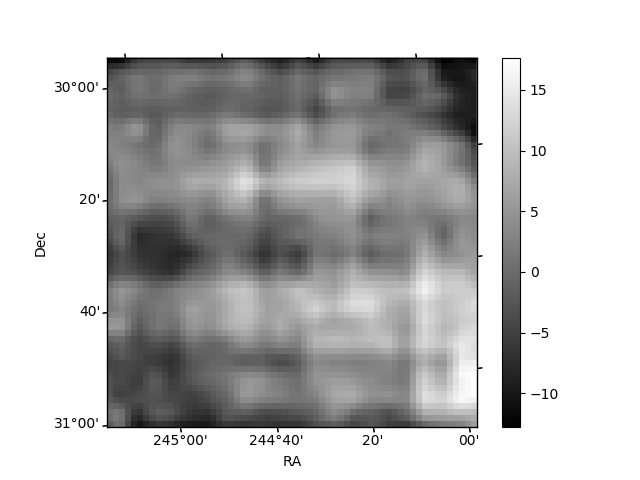
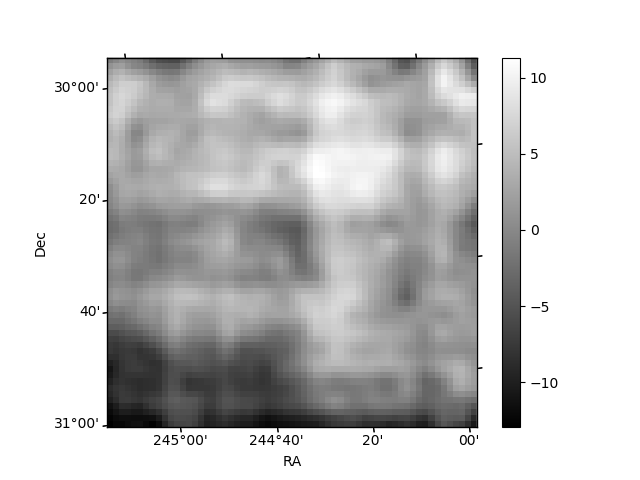
Histogram calculated using DETX and DETY for each event in the final _common_clean file
| Quadrant A | 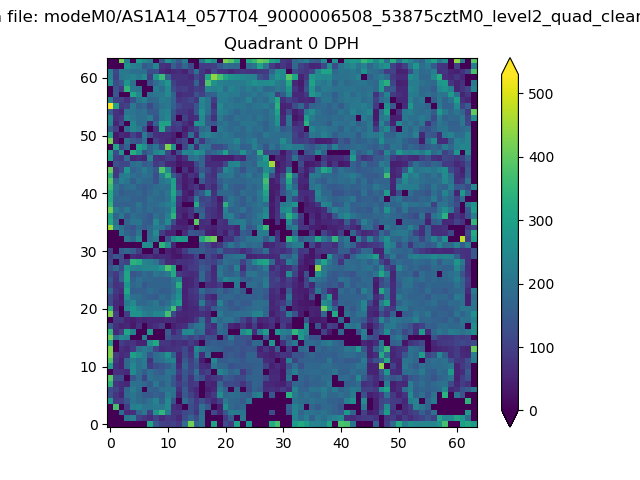 |
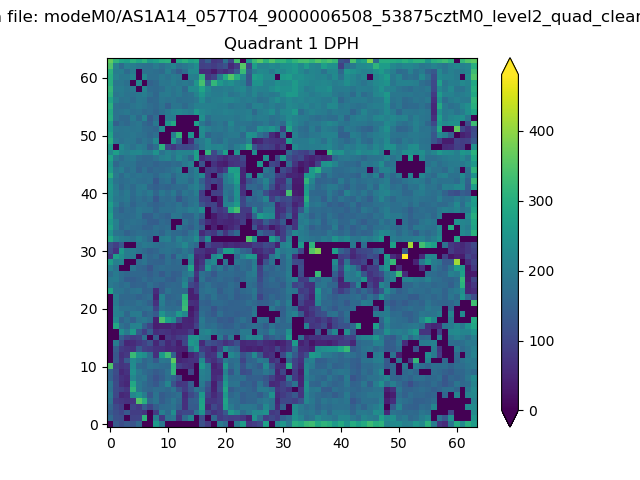 |
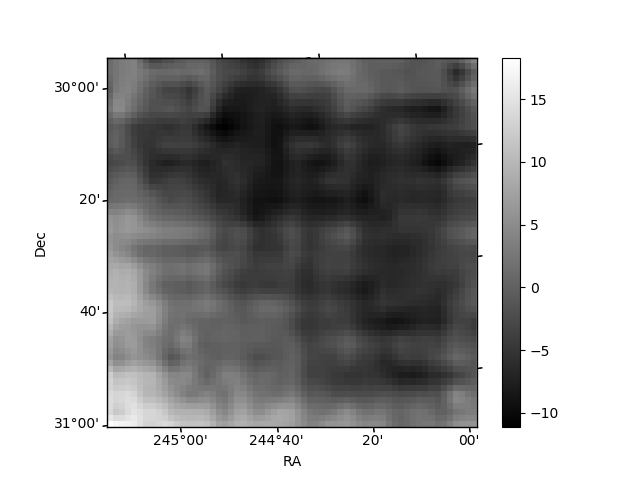
Quadrant B |
|---|---|---|---|
| Quadrant D | 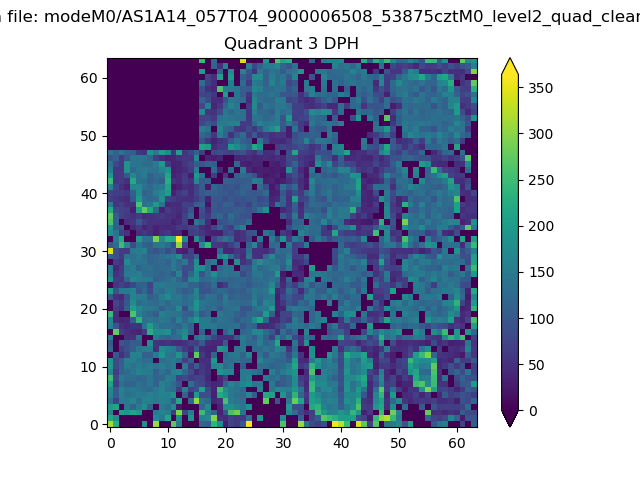 |
 |
Quadrant C |
| Plot type | Count rate plots | Images |
|---|---|---|
| Comparison with Poisson distribution Blue bars denote a histogram of data divided into 1 sec bins. Red curve is a Poisson curve with rate = median count rate of data. |
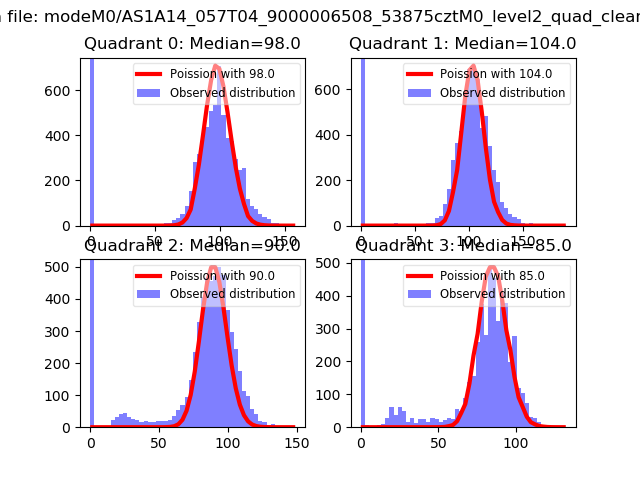 |
 |
| Quadrant-wise count rates Data is divided into 100 sec bins |
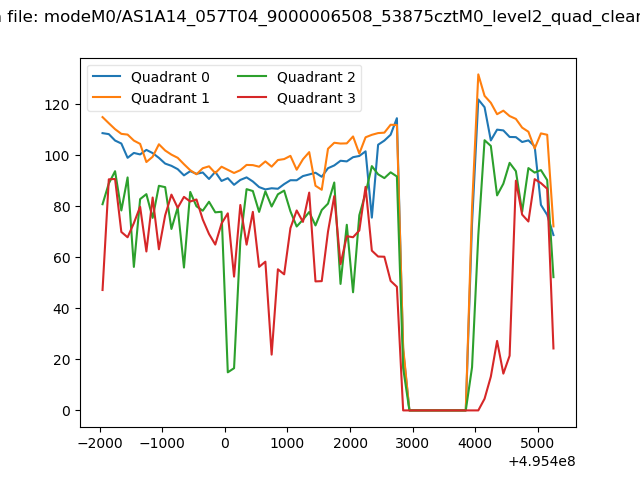 |
|
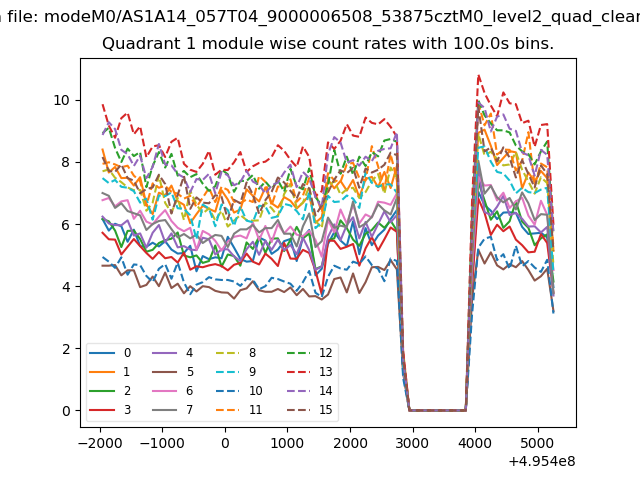
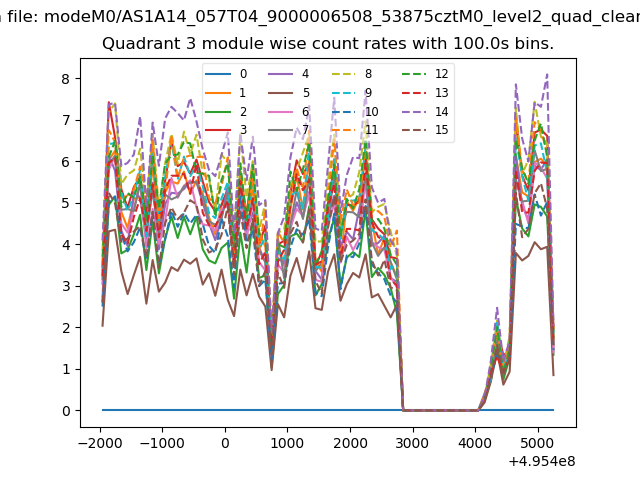
| Module-wise count rates for Quadrant A Data is divided into 100 sec bins |
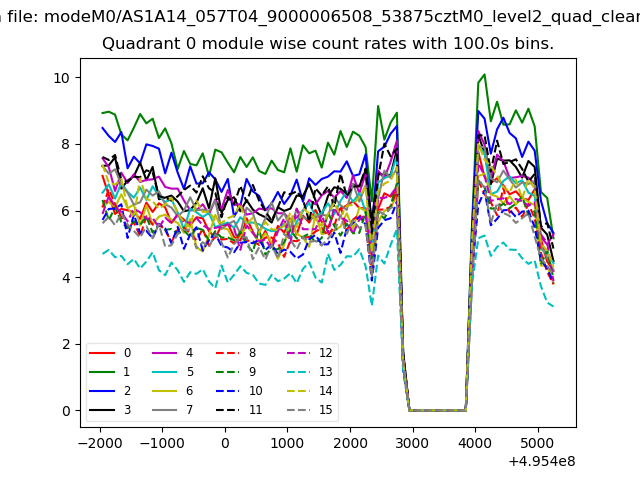 |
 |
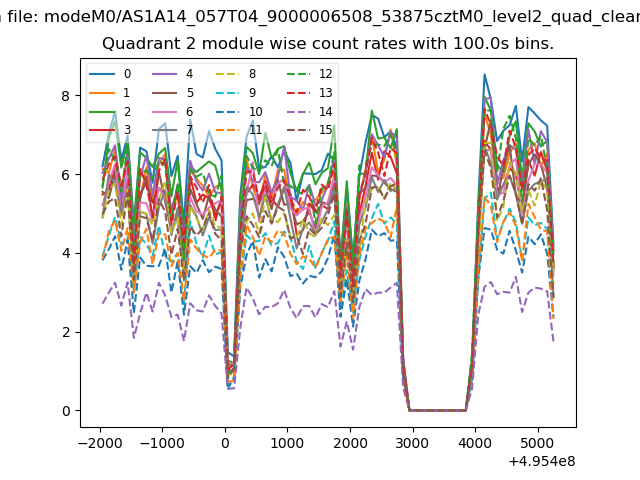
| Module-wise count rates for Quadrant B Data is divided into 100 sec bins |
 |
 |
| Module-wise count rates for Quadrant C Data is divided into 100 sec bins |
 |
 |
| Module-wise count rates for Quadrant D Data is divided into 100 sec bins |
 |
 |
| Parameter | Plot |
|---|---|
| CZT HV Monitor | 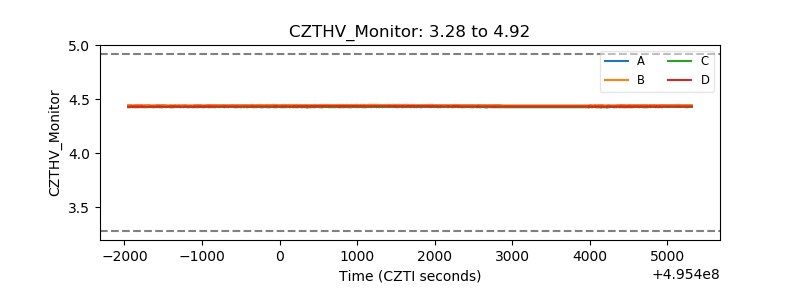 |
| D_VDD | 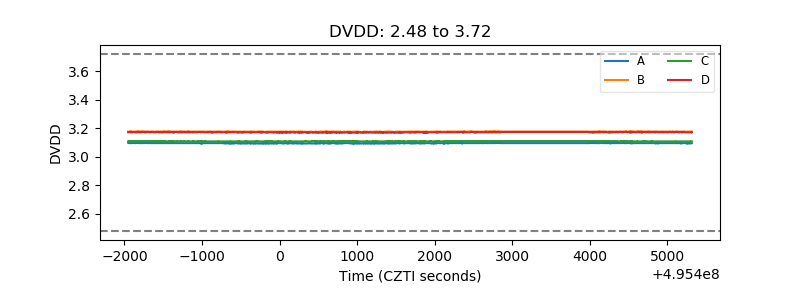 |
| Temperature 1 | 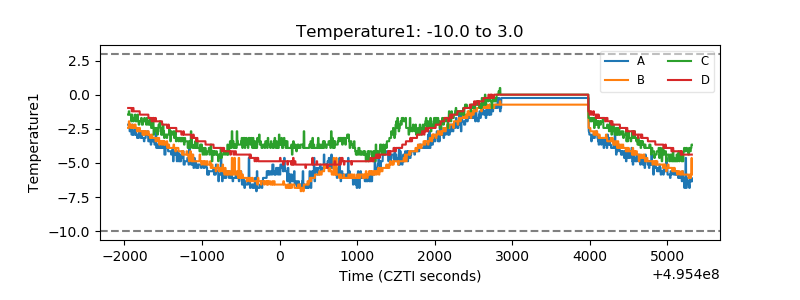 |
| Veto HV Monitor | 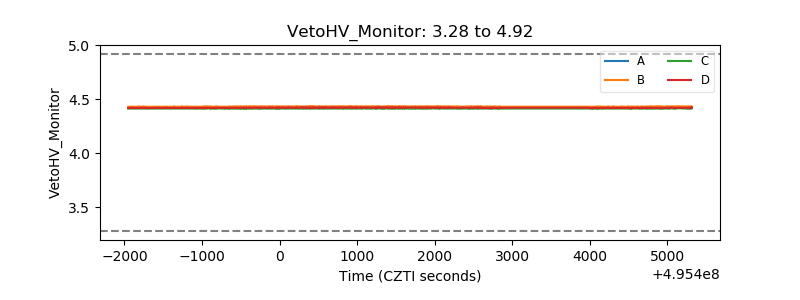 |
| Veto LLD | 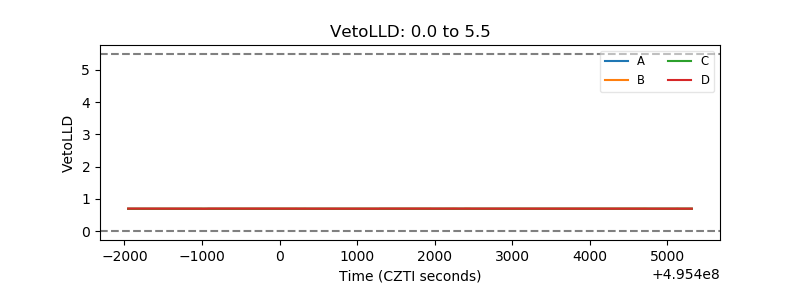 |
| Alpha Counter | 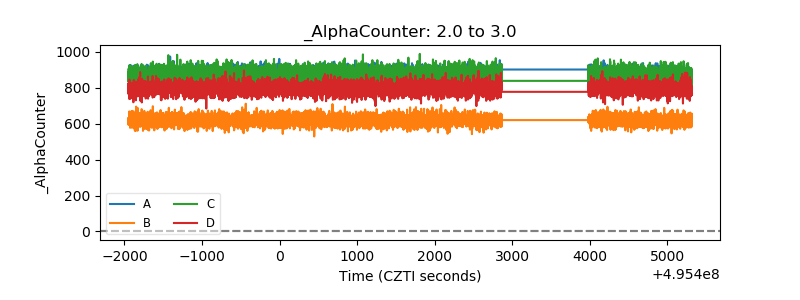 |
| _CPM_Rate | 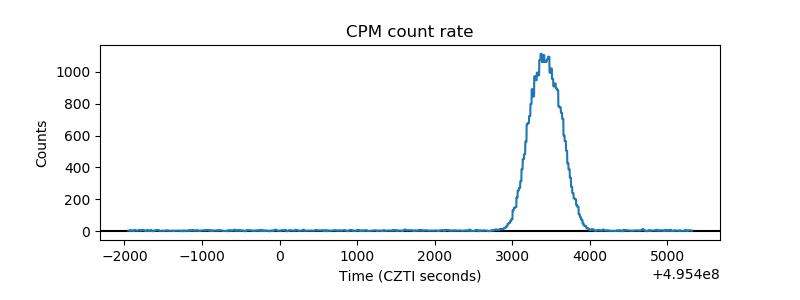 |
| CZT Counter | 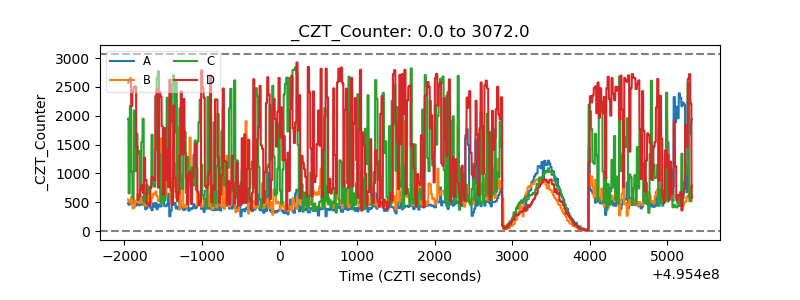 |
| +2.5 Volts monitor |  |
| +5 Volts monitor | 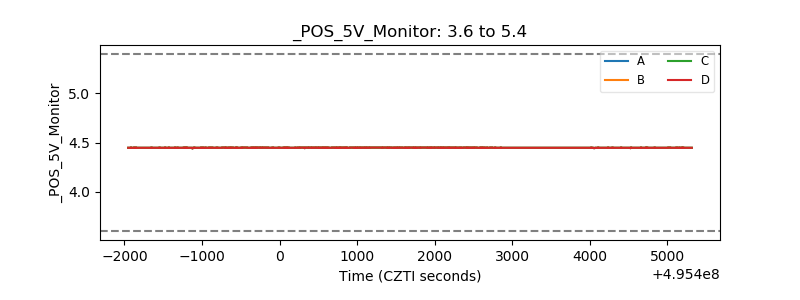 |
| _ROLL_ROT | 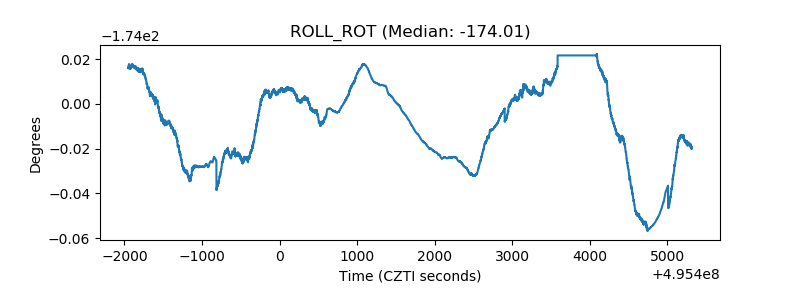 |
| _Roll_DEC | 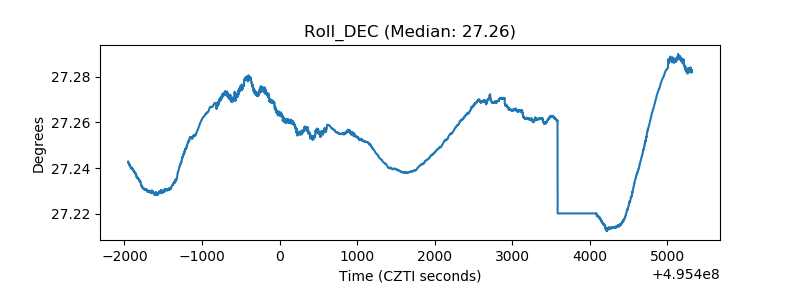 |
| _Roll_RA | 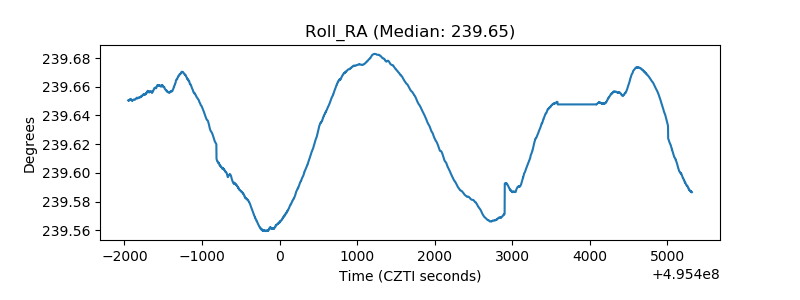 |
| Veto Counter | 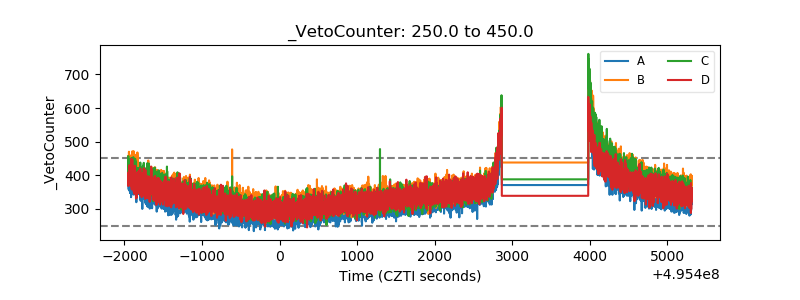 |