| Param | Original file | Final file |
|---|---|---|
| Filename | modeM0/AS1A14_057T04_9000006508_53876cztM0_level2.fits | modeM0/AS1A14_057T04_9000006508_53876cztM0_level2_quad_clean.evt |
| Size (bytes) | 632,102,400 | 89,686,080 |
| Size | 602.8 MB | 85.5 MB |
| Events in quadrant A | 3,978,287 | 635,014 |
| Events in quadrant B | 3,932,898 | 670,848 |
| Events in quadrant C | 6,692,631 | 536,755 |
| Events in quadrant D | 8,302,481 | 429,453 |
| Mode M0 | |||
|---|---|---|---|
| Quadrant | BADHDUFLAG | Total packets | Discarded packets |
| A | 0 | 16114 | 2 |
| B | 0 | 15921 | 1 |
| C | 0 | 24340 | 1 |
| D | 0 | 29113 | 1 |
| Mode SS | |||
|---|---|---|---|
| Quadrant | BADHDUFLAG | Total packets | Discarded packets |
| A | 0 | 130 | 0 |
| B | 0 | 130 | 0 |
| C | 0 | 130 | 0 |
| D | 0 | 130 | 0 |
| Mode M9 | |||
|---|---|---|---|
| Quadrant | BADHDUFLAG | Total packets | Discarded packets |
| A | 0 | 12 | 0 |
| B | 0 | 12 | 0 |
| C | 0 | 12 | 0 |
| D | 0 | 12 | 0 |
| Quadrant | Total seconds | Saturated seconds | Saturation percentage |
|---|---|---|---|
| A | 6348 | 151 | 2.378702% |
| B | 6348 | 239 | 3.764965% |
| C | 6348 | 984 | 15.500945% |
| D | 6348 | 1789 | 28.182105% |
Noise dominated data is calculated using 1-second bins in cleaned event files. If a bin has >2000 counts, and if more than 50% of those come from <1% of pixels, then it is considered to be noise-dominated and hence unusable.
| Quadrant | # 1 sec bins | Bins with >0 counts | Bins with >2000 counts | High rate bins dominated by noise | Noise dominated (total time) | Noise dominated (detector-on time) | Marked lightcurve |
|---|---|---|---|---|---|---|---|
| A | 7553 | 6349 | 198 | 198 | 2.62% | 3.12% | 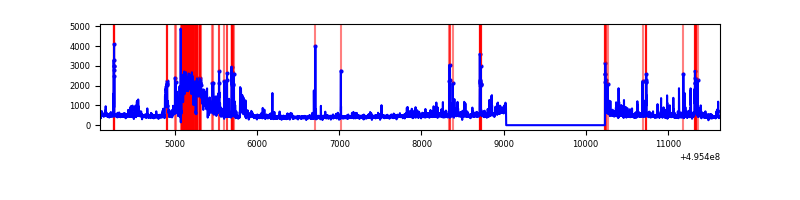 |
| B | 7553 | 6349 | 153 | 153 | 2.03% | 2.41% | 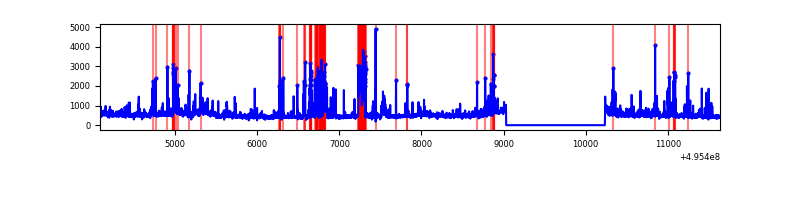 |
| C | 7553 | 6347 | 720 | 720 | 9.53% | 11.34% | 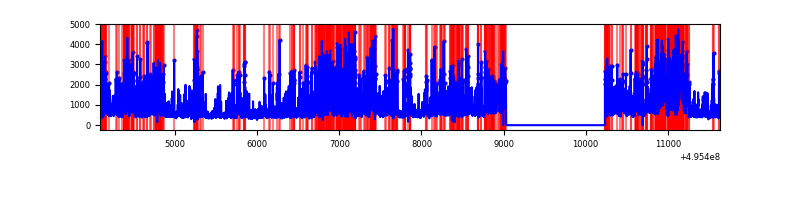 |
| D | 7553 | 6348 | 1590 | 1590 | 21.05% | 25.05% | 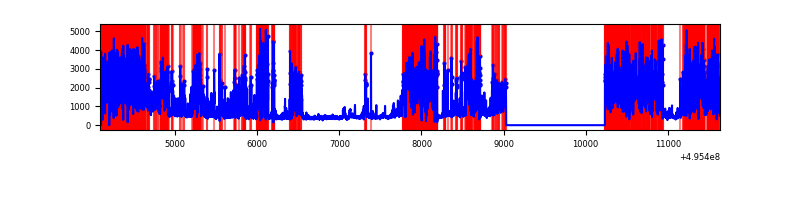 |
Top three noisy pixels from each quadrant. If the there are fewer than three noisy pixels in the level2.evt file, extra rows are filled as -1
| Pixel properties | Quadrant properties | ||||||
|---|---|---|---|---|---|---|---|
| Quadrant | DetID | PixID | Counts | Sigma | Mean | Median | Sigma |
| A | 12 | 115 | 699876 | 3988.14 | 697 | 680 | 175.3 |
| A | 15 | 174 | 277888 | 1581.16 | 697 | 680 | 175.3 |
| A | 3 | 62 | 80745 | 456.68 | 697 | 680 | 175.3 |
| B | 0 | 213 | 543289 | 3657.74 | 690 | 666 | 148.3 |
| B | 5 | 250 | 143151 | 960.47 | 690 | 666 | 148.3 |
| B | 5 | 185 | 114348 | 766.31 | 690 | 666 | 148.3 |
| C | 15 | 224 | 2086786 | 11813.58 | 638 | 634 | 176.6 |
| C | 15 | 158 | 965358 | 5463.09 | 638 | 634 | 176.6 |
| C | 13 | 3 | 523037 | 2958.29 | 638 | 634 | 176.6 |
| D | 8 | 176 | 5194796 | 30587.39 | 582 | 552 | 169.8 |
| D | 13 | 153 | 237234 | 1393.75 | 582 | 552 | 169.8 |
| D | 2 | 172 | 192639 | 1131.14 | 582 | 552 | 169.8 |
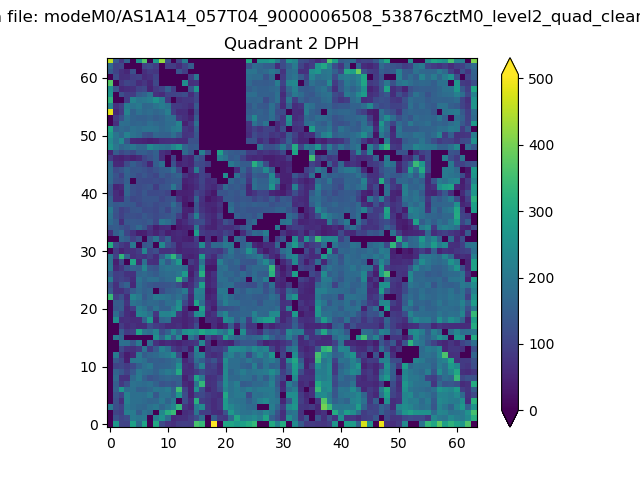
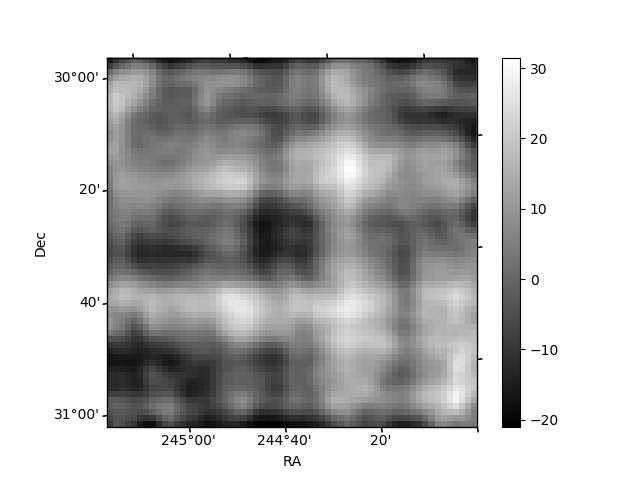
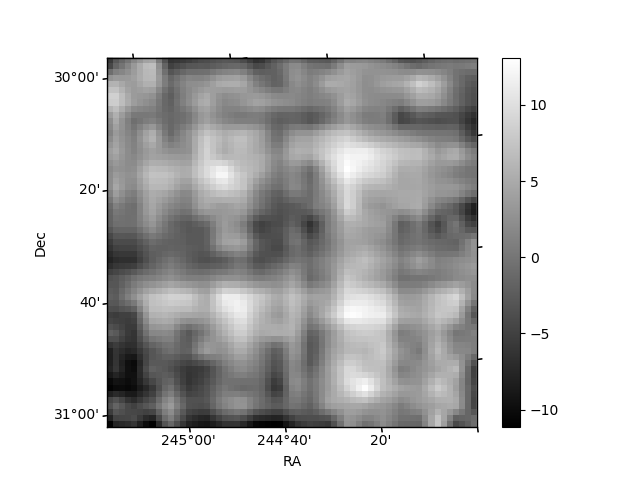
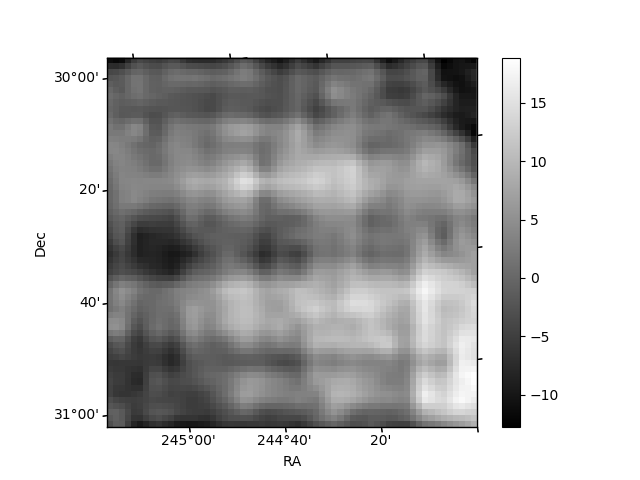
Histogram calculated using DETX and DETY for each event in the final _common_clean file
| Quadrant A | 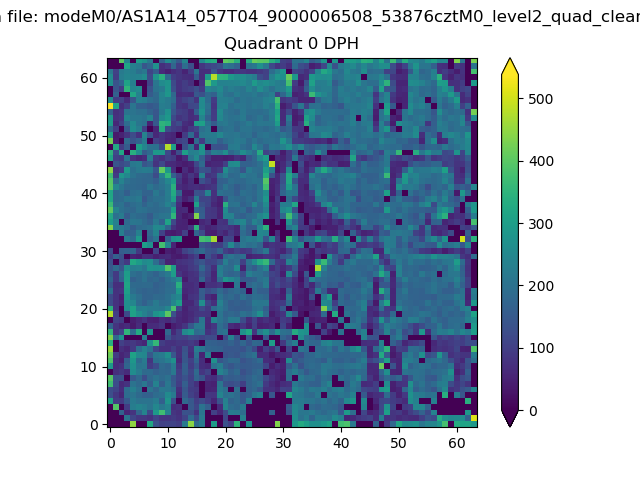 |
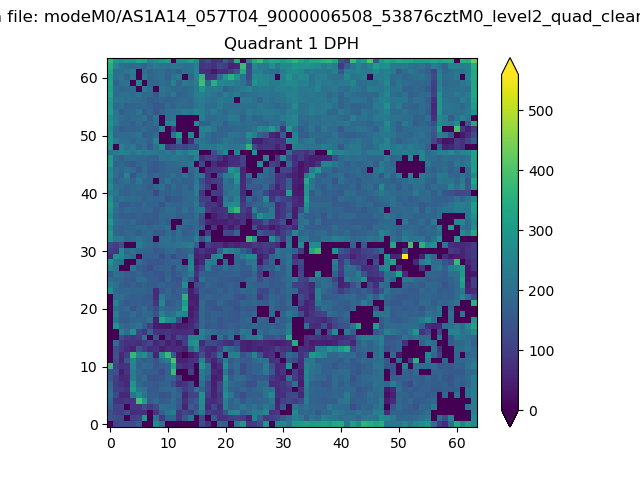 |
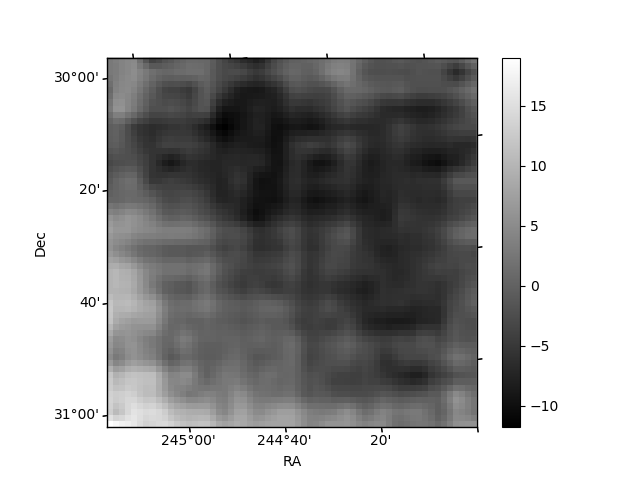
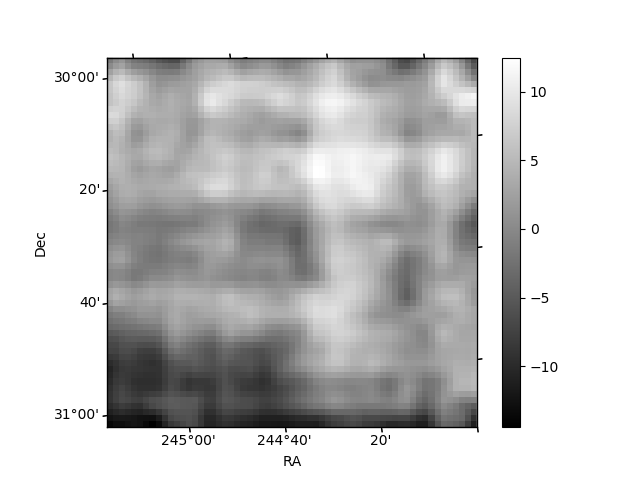
Quadrant B |
|---|---|---|---|
| Quadrant D | 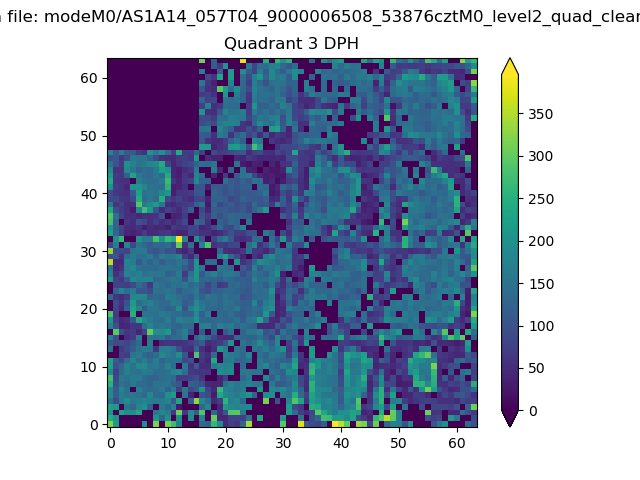 |
 |
Quadrant C |
| Plot type | Count rate plots | Images |
|---|---|---|
| Comparison with Poisson distribution Blue bars denote a histogram of data divided into 1 sec bins. Red curve is a Poisson curve with rate = median count rate of data. |
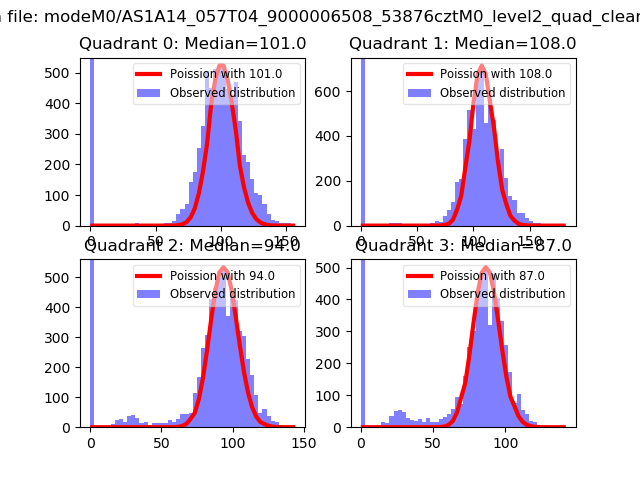 |
 |
| Quadrant-wise count rates Data is divided into 100 sec bins |
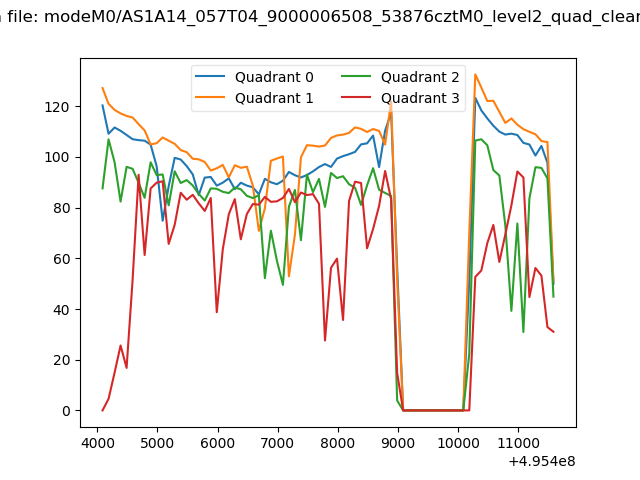 |
|
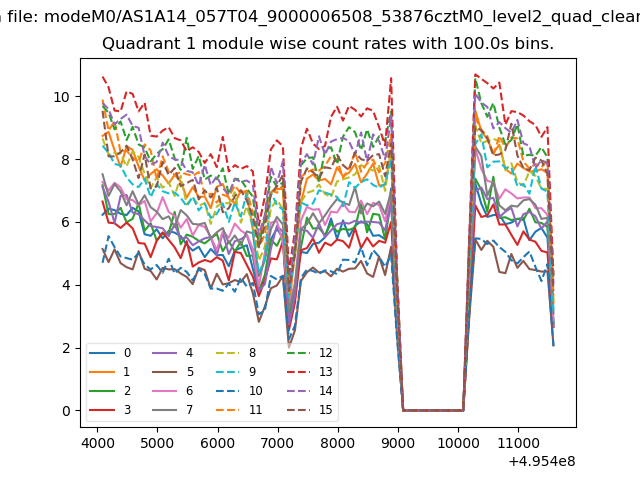
| Module-wise count rates for Quadrant A Data is divided into 100 sec bins |
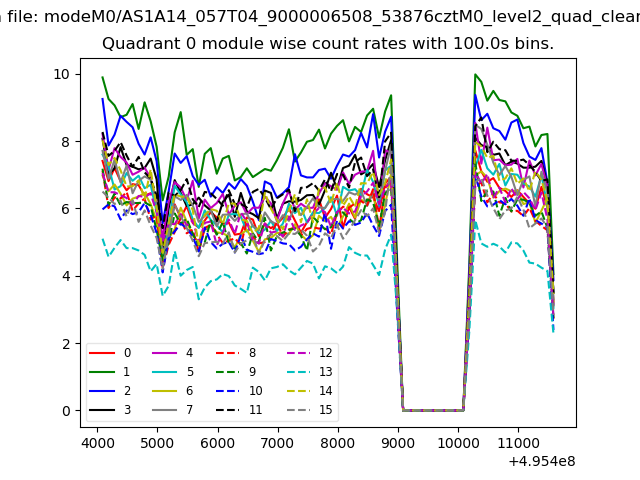 |
 |
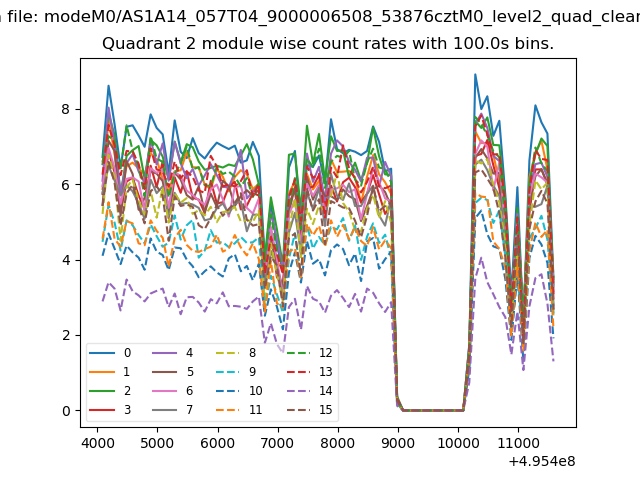
| Module-wise count rates for Quadrant B Data is divided into 100 sec bins |
 |
 |
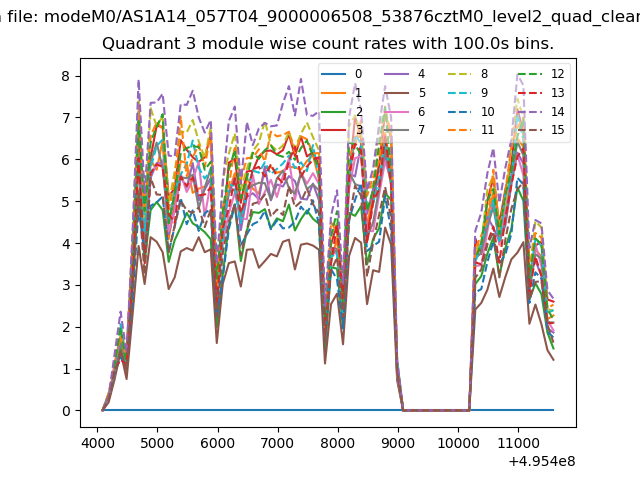
| Module-wise count rates for Quadrant C Data is divided into 100 sec bins |
 |
 |
| Module-wise count rates for Quadrant D Data is divided into 100 sec bins |
 |
 |
| Parameter | Plot |
|---|---|
| CZT HV Monitor | 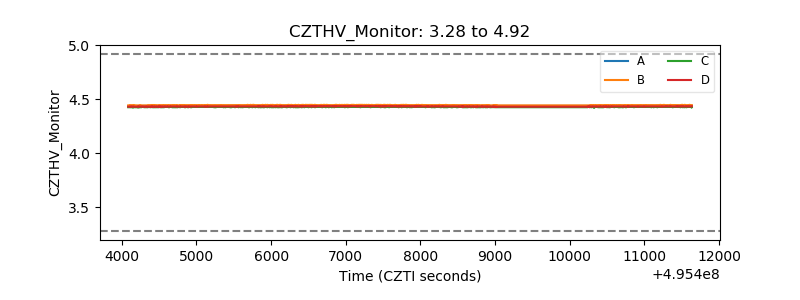 |
| D_VDD | 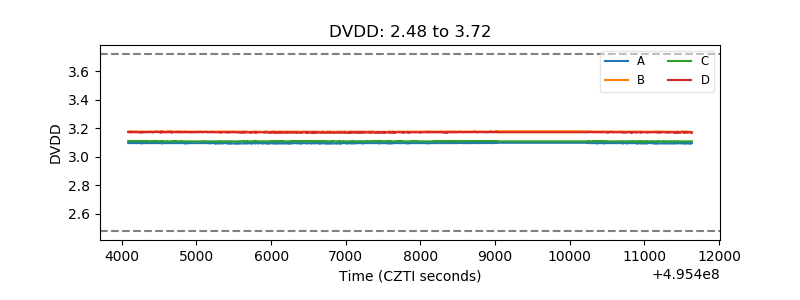 |
| Temperature 1 | 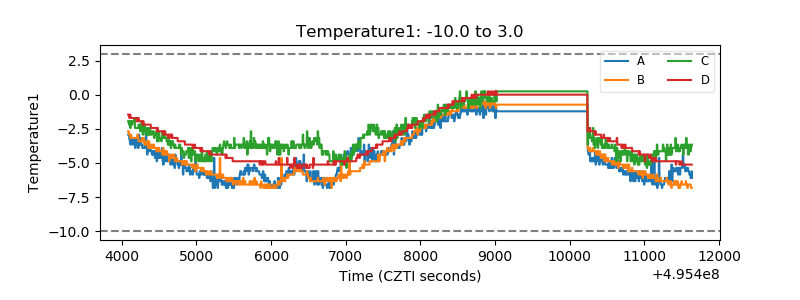 |
| Veto HV Monitor | 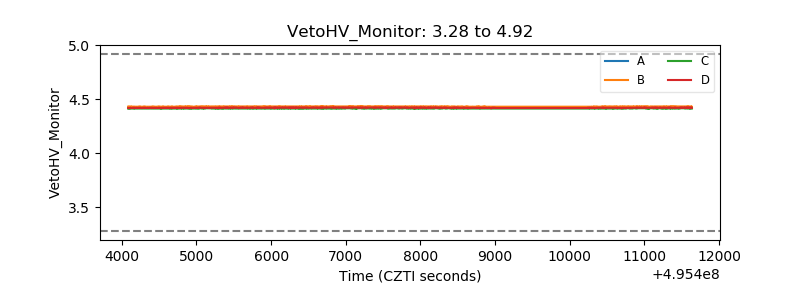 |
| Veto LLD | 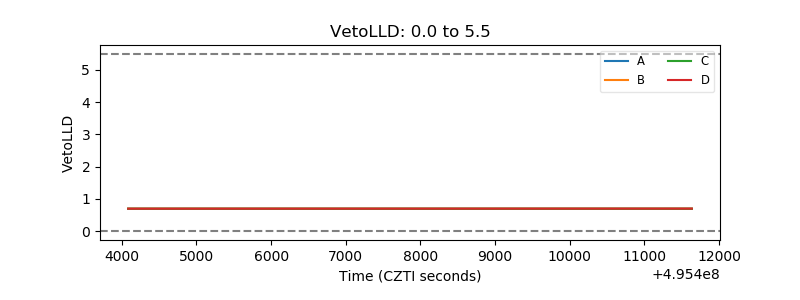 |
| Alpha Counter | 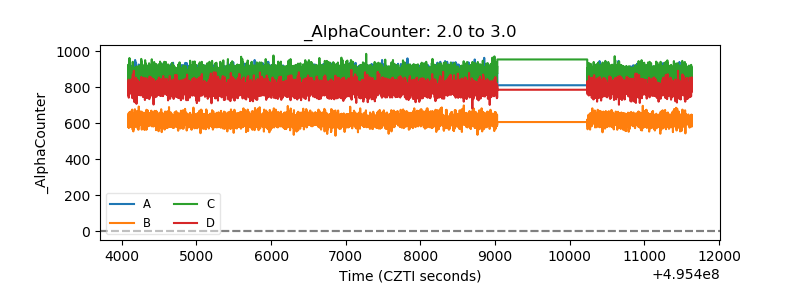 |
| _CPM_Rate | 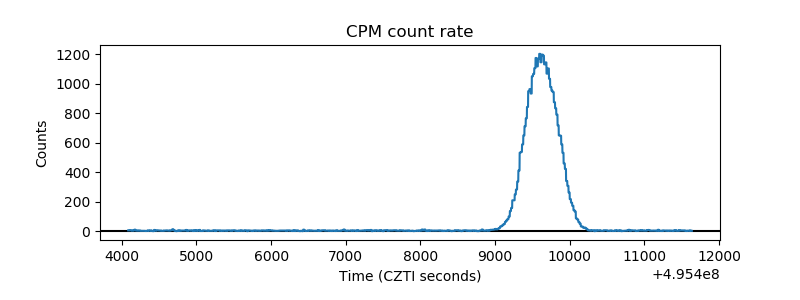 |
| CZT Counter | 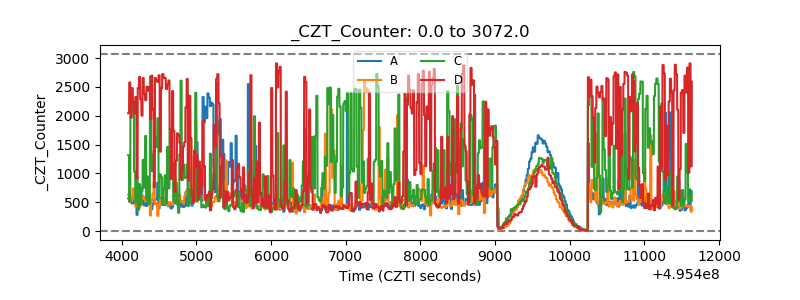 |
| +2.5 Volts monitor | 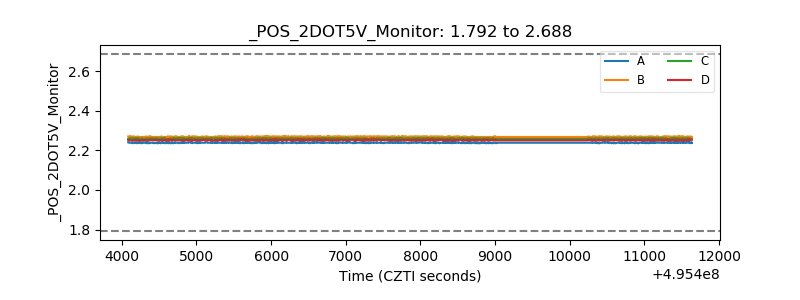 |
| +5 Volts monitor | 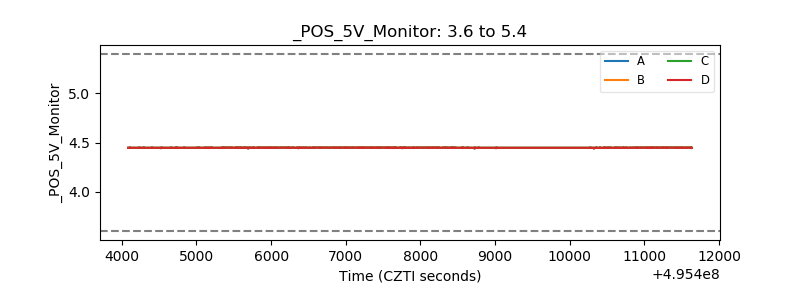 |
| _ROLL_ROT | 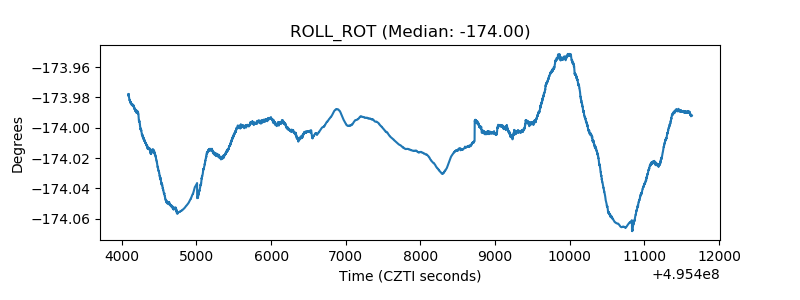 |
| _Roll_DEC | 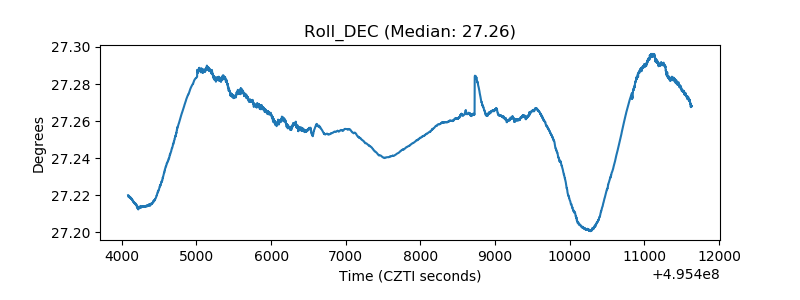 |
| _Roll_RA | 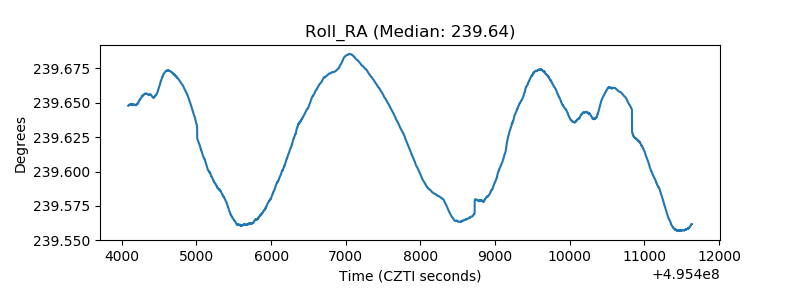 |
| Veto Counter | 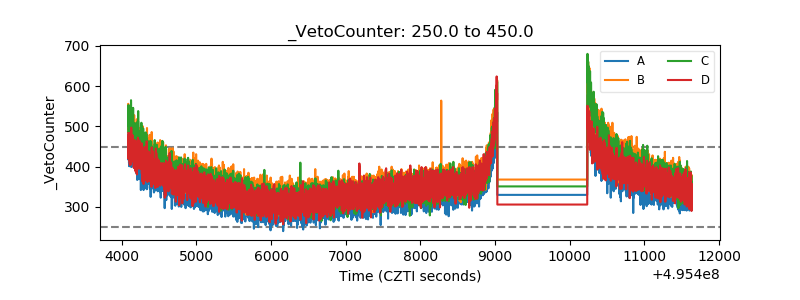 |