| Param | Original file | Final file |
|---|---|---|
| Filename | modeM0/AS1A14_057T04_9000006508_53877cztM0_level2.fits | modeM0/AS1A14_057T04_9000006508_53877cztM0_level2_quad_clean.evt |
| Size (bytes) | 794,401,920 | 87,822,720 |
| Size | 757.6 MB | 83.8 MB |
| Events in quadrant A | 4,975,578 | 645,264 |
| Events in quadrant B | 3,846,218 | 716,135 |
| Events in quadrant C | 6,538,938 | 576,199 |
| Events in quadrant D | 13,531,771 | 259,037 |
| Mode M0 | |||
|---|---|---|---|
| Quadrant | BADHDUFLAG | Total packets | Discarded packets |
| A | 0 | 19310 | 2 |
| B | 0 | 15972 | 2 |
| C | 0 | 24013 | 2 |
| D | 0 | 44699 | 4 |
| Mode SS | |||
|---|---|---|---|
| Quadrant | BADHDUFLAG | Total packets | Discarded packets |
| A | 0 | 134 | 0 |
| B | 0 | 134 | 0 |
| C | 0 | 134 | 0 |
| D | 0 | 134 | 0 |
| Mode M9 | |||
|---|---|---|---|
| Quadrant | BADHDUFLAG | Total packets | Discarded packets |
| A | 0 | 22 | 0 |
| B | 0 | 23 | 0 |
| C | 0 | 23 | 0 |
| D | 0 | 23 | 0 |
| Quadrant | Total seconds | Saturated seconds | Saturation percentage |
|---|---|---|---|
| A | 6632 | 391 | 5.895657% |
| B | 6632 | 170 | 2.563329% |
| C | 6632 | 886 | 13.359469% |
| D | 6631 | 4147 | 62.539587% |
Noise dominated data is calculated using 1-second bins in cleaned event files. If a bin has >2000 counts, and if more than 50% of those come from <1% of pixels, then it is considered to be noise-dominated and hence unusable.
| Quadrant | # 1 sec bins | Bins with >0 counts | Bins with >2000 counts | High rate bins dominated by noise | Noise dominated (total time) | Noise dominated (detector-on time) | Marked lightcurve |
|---|---|---|---|---|---|---|---|
| A | 7807 | 6633 | 258 | 258 | 3.30% | 3.89% | 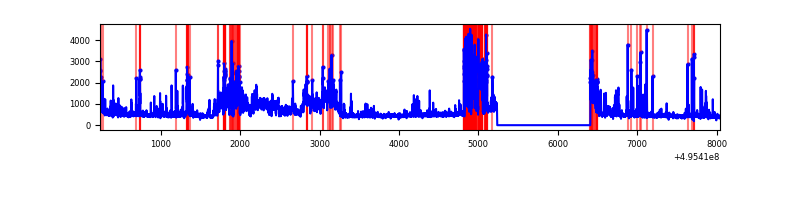 |
| B | 7807 | 6633 | 47 | 47 | 0.60% | 0.71% | 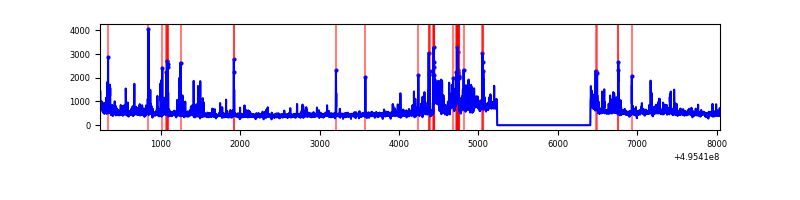 |
| C | 7807 | 6632 | 670 | 670 | 8.58% | 10.10% | 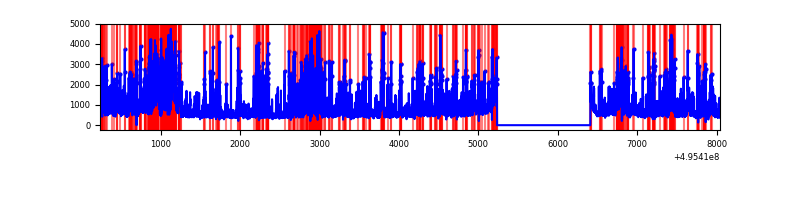 |
| D | 7805 | 6630 | 3650 | 3650 | 46.76% | 55.05% | 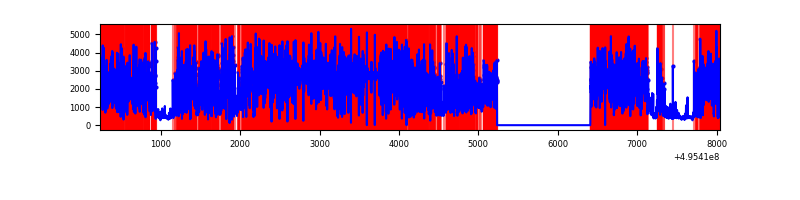 |
Top three noisy pixels from each quadrant. If the there are fewer than three noisy pixels in the level2.evt file, extra rows are filled as -1
| Pixel properties | Quadrant properties | ||||||
|---|---|---|---|---|---|---|---|
| Quadrant | DetID | PixID | Counts | Sigma | Mean | Median | Sigma |
| A | 12 | 115 | 1023931 | 5709.52 | 724 | 708 | 179.2 |
| A | 15 | 174 | 752909 | 4197.24 | 724 | 708 | 179.2 |
| A | 3 | 62 | 134373 | 745.84 | 724 | 708 | 179.2 |
| B | 7 | 0 | 244275 | 1551.72 | 739 | 714 | 157.0 |
| B | 5 | 185 | 186179 | 1181.59 | 739 | 714 | 157.0 |
| B | 0 | 213 | 121205 | 767.64 | 739 | 714 | 157.0 |
| C | 15 | 224 | 1968691 | 10453.68 | 682 | 680 | 188.3 |
| C | 15 | 158 | 773765 | 4106.47 | 682 | 680 | 188.3 |
| C | 13 | 3 | 306955 | 1626.87 | 682 | 680 | 188.3 |
| D | 8 | 176 | 9984584 | 72369.39 | 475 | 452 | 138.0 |
| D | 2 | 172 | 1102060 | 7984.94 | 475 | 452 | 138.0 |
| D | 13 | 153 | 168272 | 1216.43 | 475 | 452 | 138.0 |
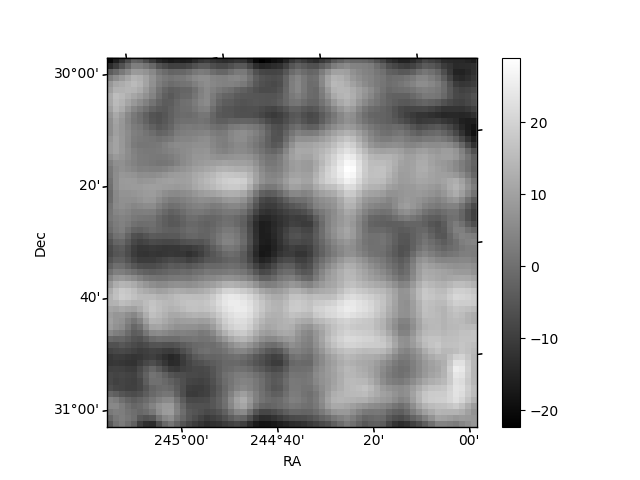
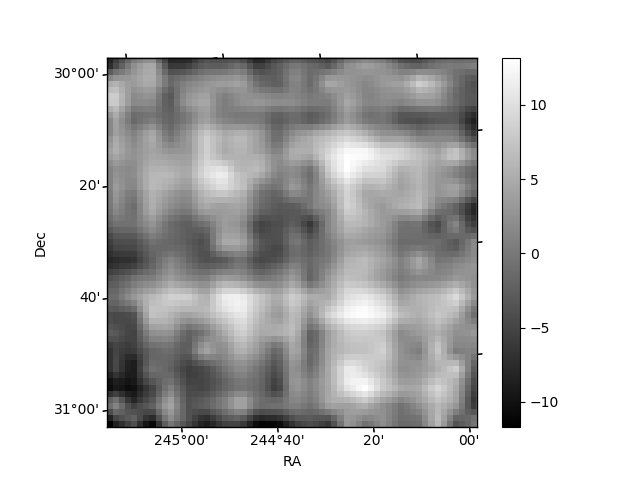
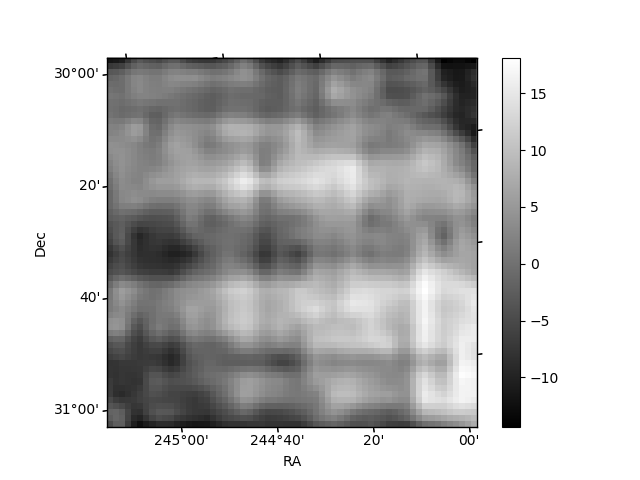
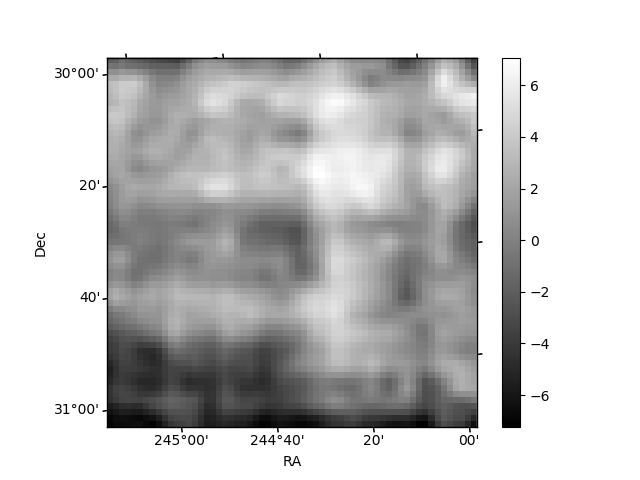
Histogram calculated using DETX and DETY for each event in the final _common_clean file
| Quadrant A | 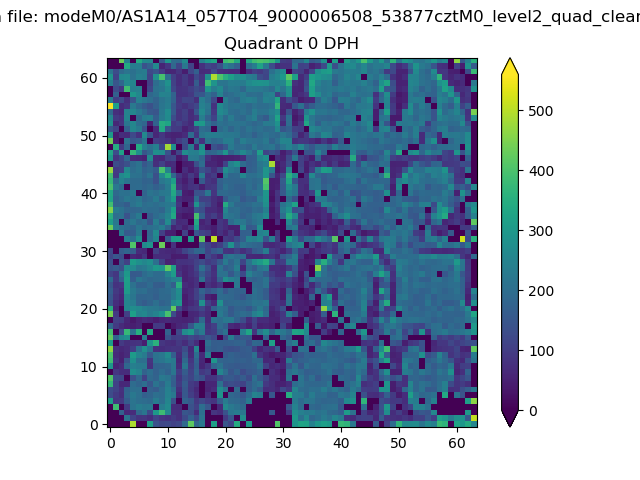 |
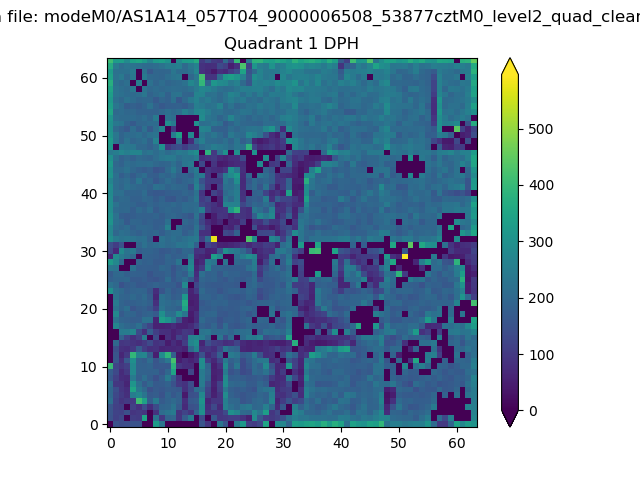 |
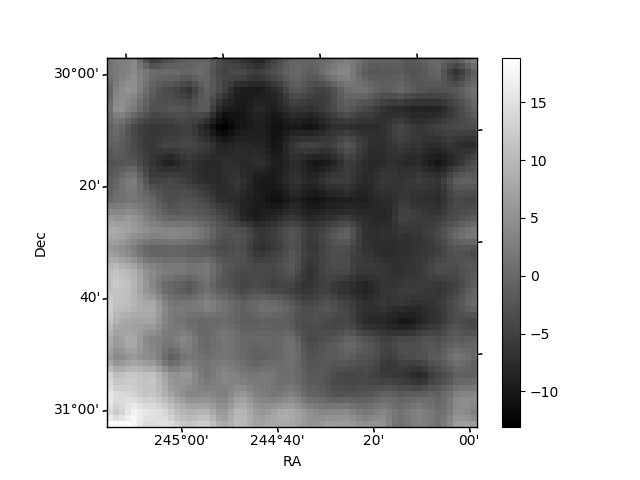
Quadrant B |
|---|---|---|---|
| Quadrant D | 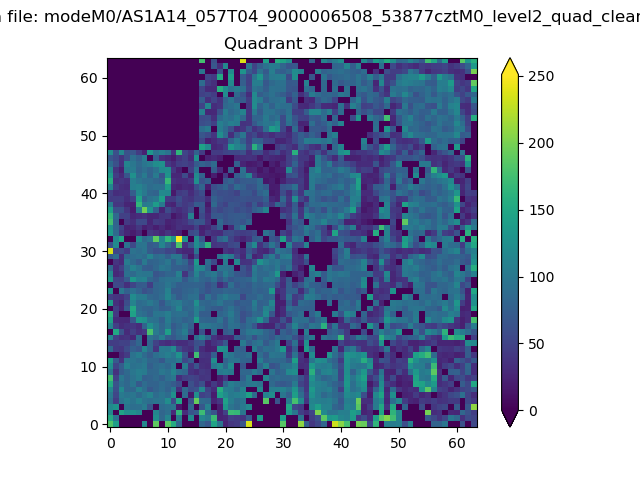 |
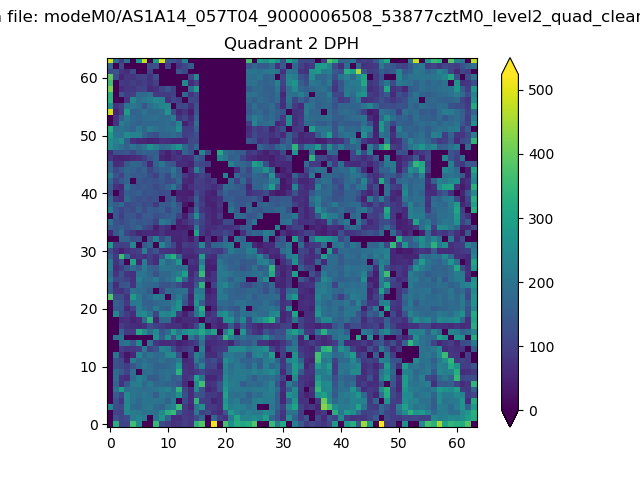 |
Quadrant C |
| Plot type | Count rate plots | Images |
|---|---|---|
| Comparison with Poisson distribution Blue bars denote a histogram of data divided into 1 sec bins. Red curve is a Poisson curve with rate = median count rate of data. |
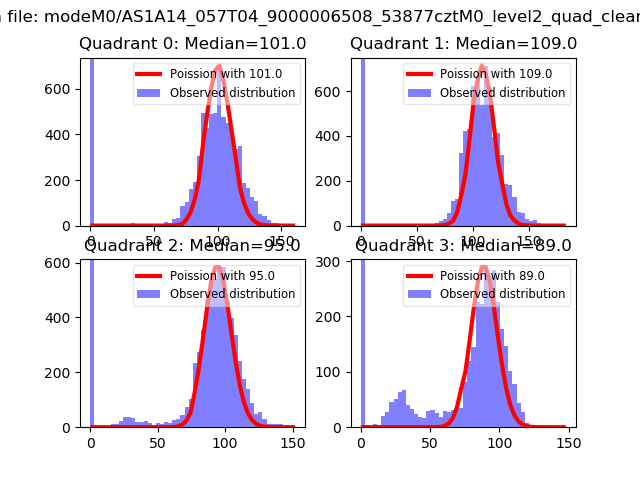 |
 |
| Quadrant-wise count rates Data is divided into 100 sec bins |
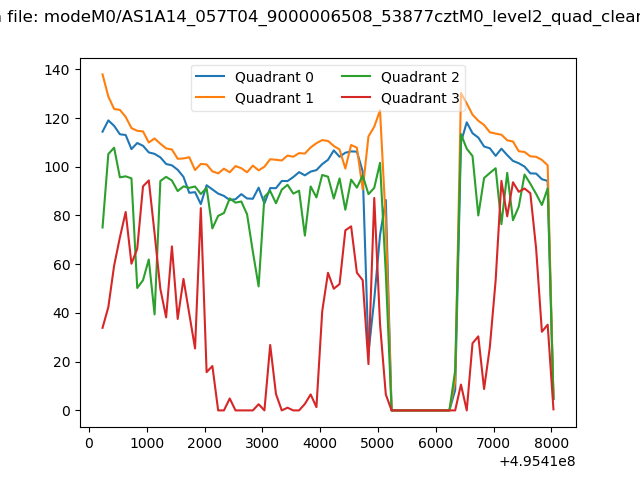 |
|
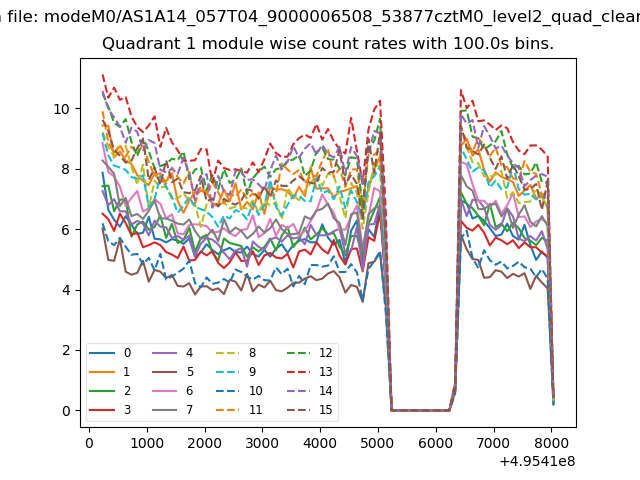
| Module-wise count rates for Quadrant A Data is divided into 100 sec bins |
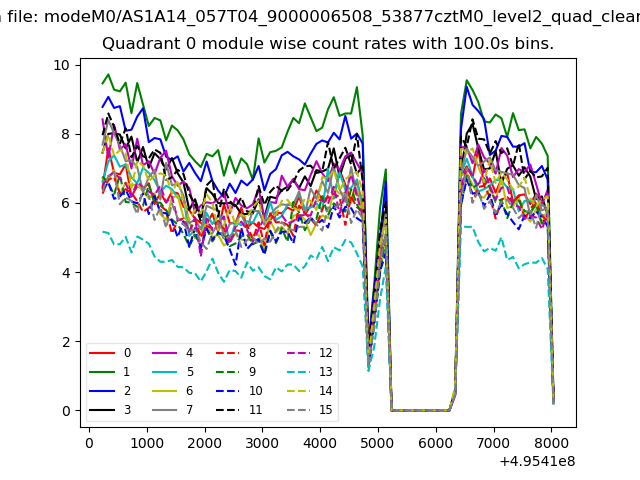 |
 |
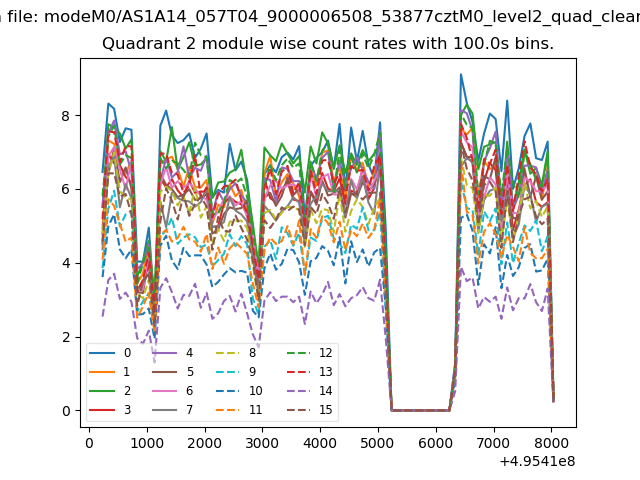
| Module-wise count rates for Quadrant B Data is divided into 100 sec bins |
 |
 |
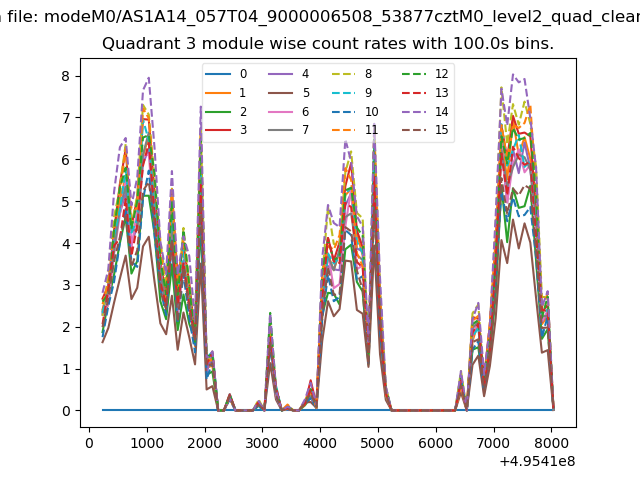
| Module-wise count rates for Quadrant C Data is divided into 100 sec bins |
 |
 |
| Module-wise count rates for Quadrant D Data is divided into 100 sec bins |
 |
 |
| Parameter | Plot |
|---|---|
| CZT HV Monitor | 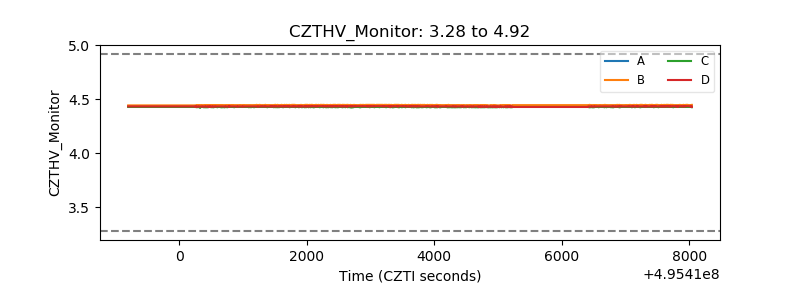 |
| D_VDD | 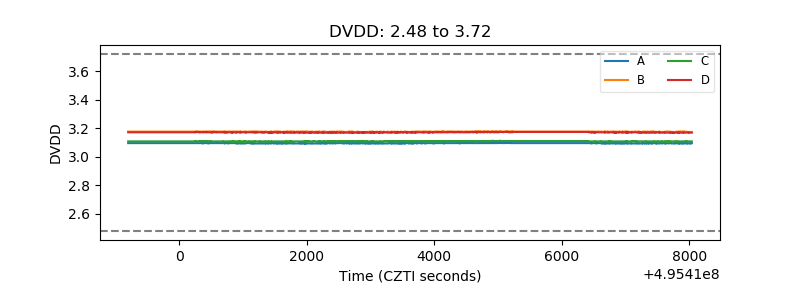 |
| Temperature 1 | 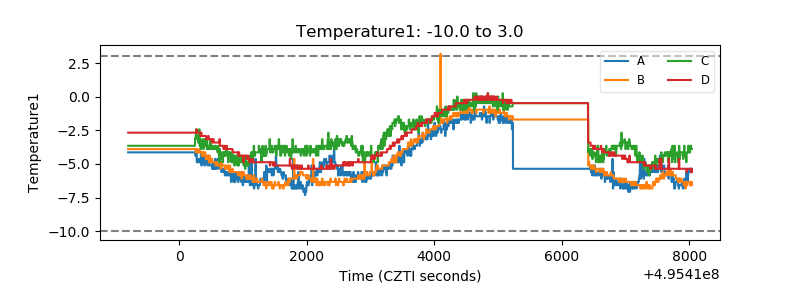 |
| Veto HV Monitor | 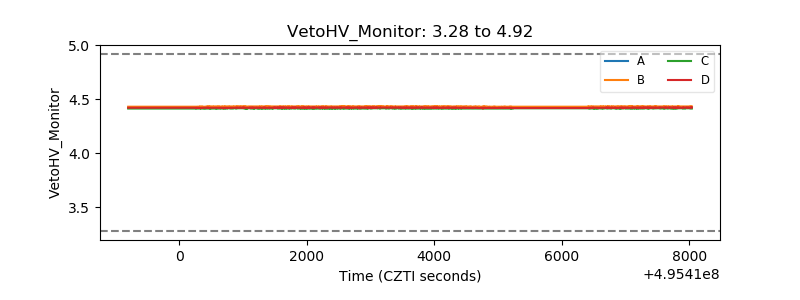 |
| Veto LLD | 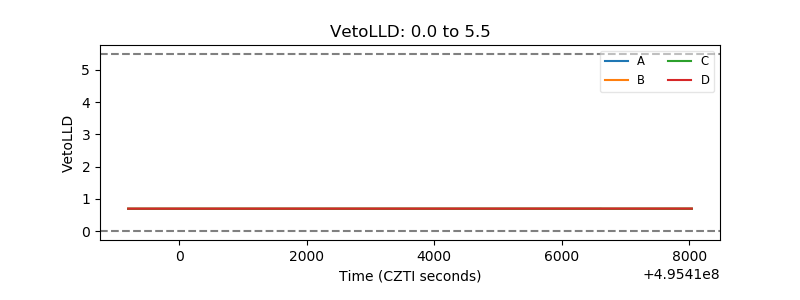 |
| Alpha Counter | 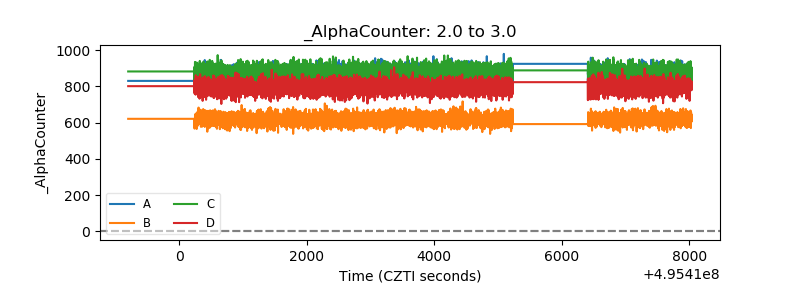 |
| _CPM_Rate | 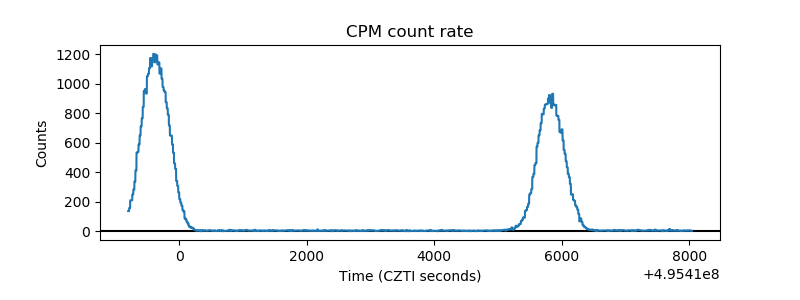 |
| CZT Counter | 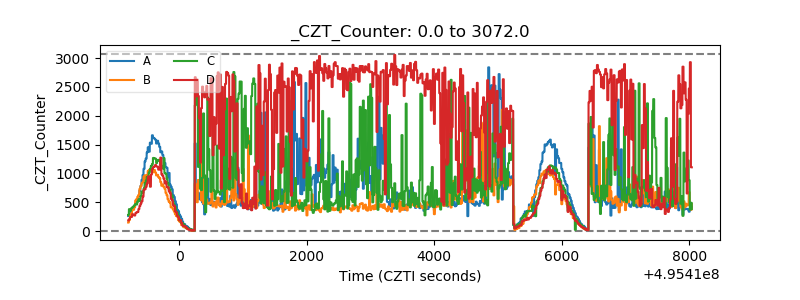 |
| +2.5 Volts monitor |  |
| +5 Volts monitor |  |
| _ROLL_ROT | 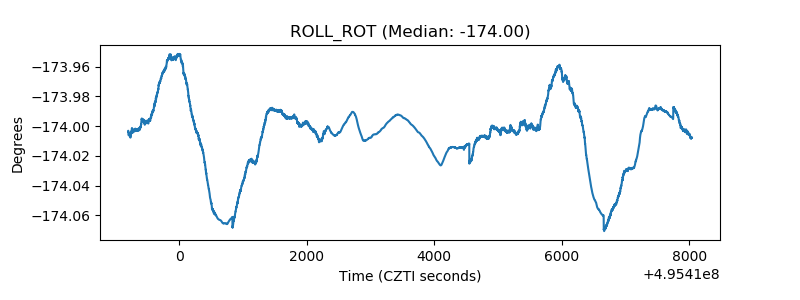 |
| _Roll_DEC | 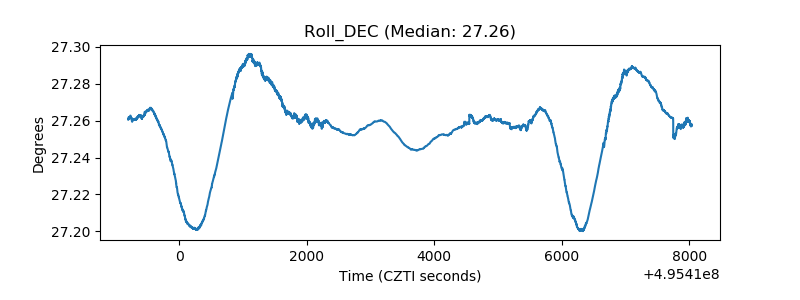 |
| _Roll_RA | 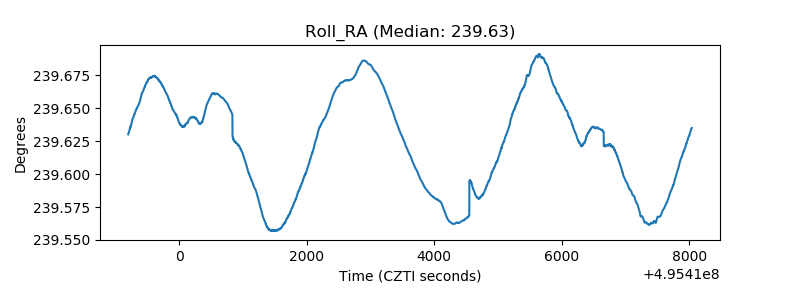 |
| Veto Counter | 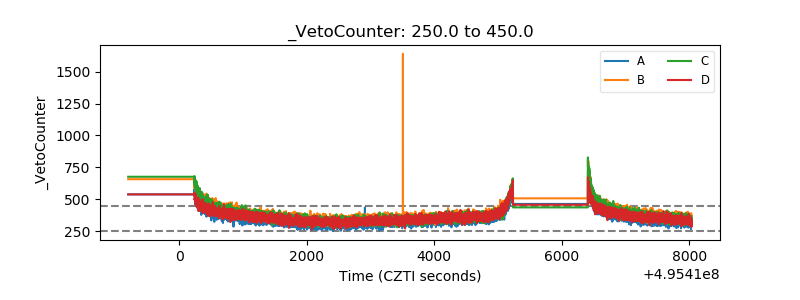 |