| Param | Original file | Final file |
|---|---|---|
| Filename | modeM0/AS1A14_057T04_9000006508_53878cztM0_level2.fits | modeM0/AS1A14_057T04_9000006508_53878cztM0_level2_quad_clean.evt |
| Size (bytes) | 1,403,127,360 | 144,653,760 |
| Size | 1.3 GB | 138.0 MB |
| Events in quadrant A | 8,204,501 | 1,056,919 |
| Events in quadrant B | 6,583,396 | 1,203,781 |
| Events in quadrant C | 13,633,889 | 848,632 |
| Events in quadrant D | 22,633,395 | 478,123 |
| Mode M0 | |||
|---|---|---|---|
| Quadrant | BADHDUFLAG | Total packets | Discarded packets |
| A | 0 | 32439 | 2 |
| B | 0 | 27279 | 2 |
| C | 0 | 48413 | 2 |
| D | 0 | 75060 | 2 |
| Mode SS | |||
|---|---|---|---|
| Quadrant | BADHDUFLAG | Total packets | Discarded packets |
| A | 0 | 232 | 0 |
| B | 0 | 232 | 0 |
| C | 0 | 232 | 0 |
| D | 0 | 232 | 0 |
| Mode M9 | |||
|---|---|---|---|
| Quadrant | BADHDUFLAG | Total packets | Discarded packets |
| A | 0 | 23 | 0 |
| B | 0 | 23 | 0 |
| C | 0 | 23 | 0 |
| D | 0 | 23 | 0 |
| Quadrant | Total seconds | Saturated seconds | Saturation percentage |
|---|---|---|---|
| A | 11450 | 887 | 7.746725% |
| B | 11450 | 312 | 2.724891% |
| C | 11450 | 2738 | 23.912664% |
| D | 11450 | 6676 | 58.305677% |
Noise dominated data is calculated using 1-second bins in cleaned event files. If a bin has >2000 counts, and if more than 50% of those come from <1% of pixels, then it is considered to be noise-dominated and hence unusable.
| Quadrant | # 1 sec bins | Bins with >0 counts | Bins with >2000 counts | High rate bins dominated by noise | Noise dominated (total time) | Noise dominated (detector-on time) | Marked lightcurve |
|---|---|---|---|---|---|---|---|
| A | 13750 | 11452 | 559 | 559 | 4.07% | 4.88% | 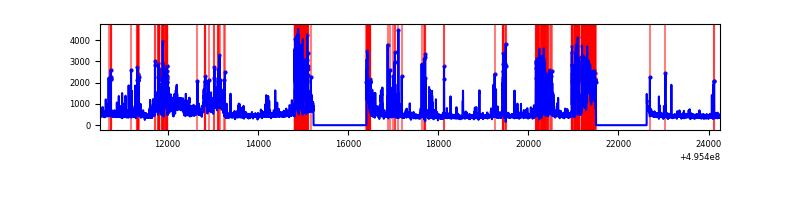 |
| B | 13750 | 11452 | 56 | 56 | 0.41% | 0.49% | 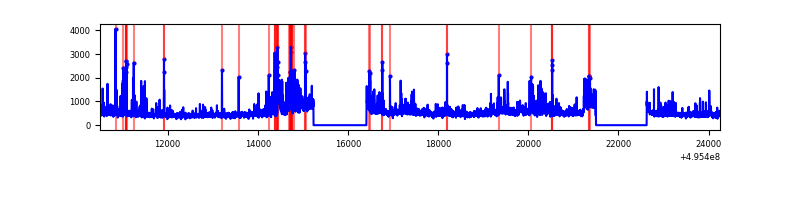 |
| C | 13750 | 11451 | 2141 | 2141 | 15.57% | 18.70% | 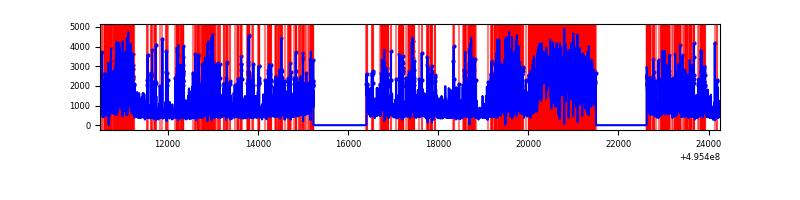 |
| D | 13750 | 11451 | 5915 | 5915 | 43.02% | 51.65% | 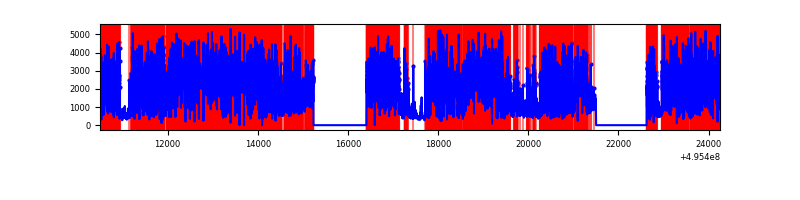 |
Top three noisy pixels from each quadrant. If the there are fewer than three noisy pixels in the level2.evt file, extra rows are filled as -1
| Pixel properties | Quadrant properties | ||||||
|---|---|---|---|---|---|---|---|
| Quadrant | DetID | PixID | Counts | Sigma | Mean | Median | Sigma |
| A | 15 | 174 | 1923138 | 6294.37 | 1230 | 1198 | 305.3 |
| A | 12 | 115 | 1024403 | 3351.0 | 1230 | 1198 | 305.3 |
| A | 3 | 62 | 183038 | 595.53 | 1230 | 1198 | 305.3 |
| B | 7 | 0 | 548244 | 2028.55 | 1267 | 1225 | 269.7 |
| B | 5 | 185 | 247749 | 914.2 | 1267 | 1225 | 269.7 |
| B | 0 | 213 | 150629 | 554.04 | 1267 | 1225 | 269.7 |
| C | 15 | 224 | 3665992 | 12257.11 | 1093 | 1088 | 299.0 |
| C | 15 | 158 | 1903210 | 6361.56 | 1093 | 1088 | 299.0 |
| C | 1 | 241 | 1542941 | 5156.66 | 1093 | 1088 | 299.0 |
| D | 8 | 176 | 17146254 | 68978.04 | 868 | 828 | 248.6 |
| D | 2 | 172 | 1251765 | 5032.66 | 868 | 828 | 248.6 |
| D | 13 | 153 | 252643 | 1013.08 | 868 | 828 | 248.6 |
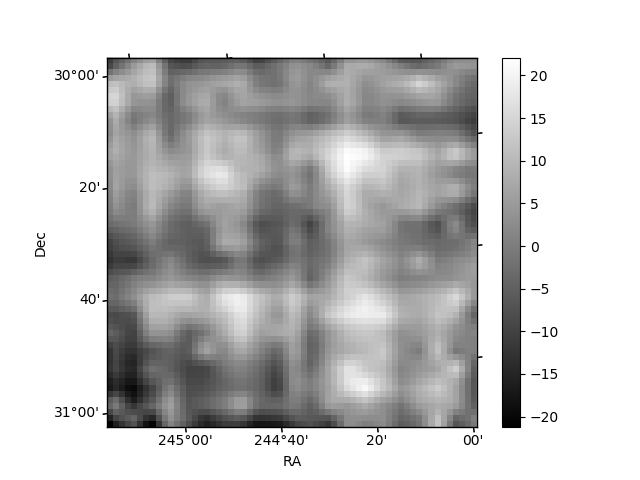
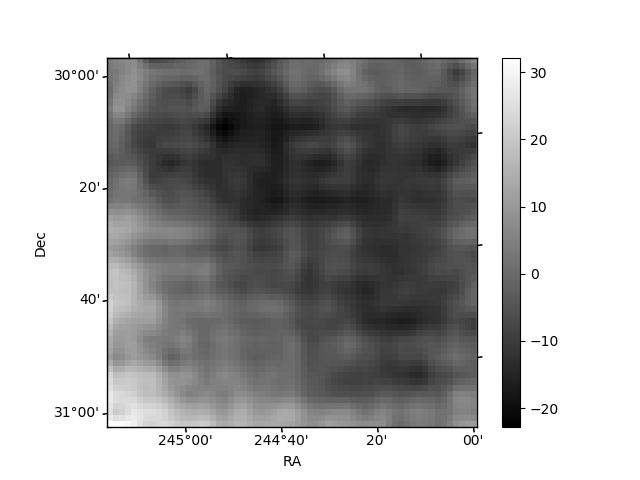
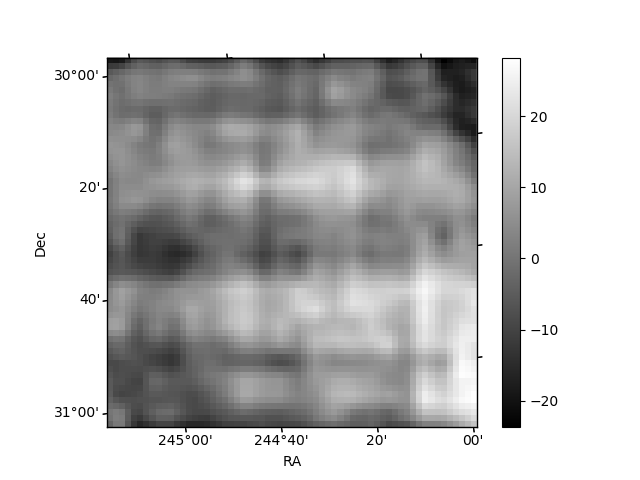
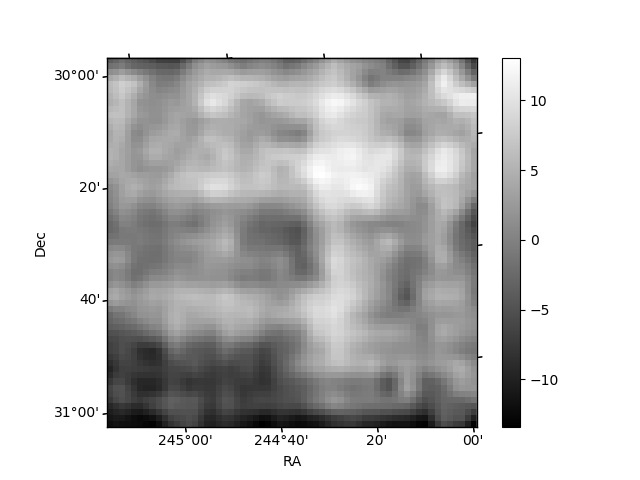
Histogram calculated using DETX and DETY for each event in the final _common_clean file
| Quadrant A | 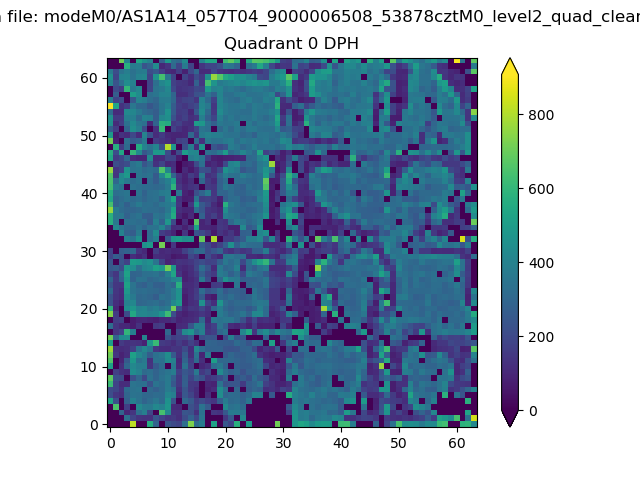 |
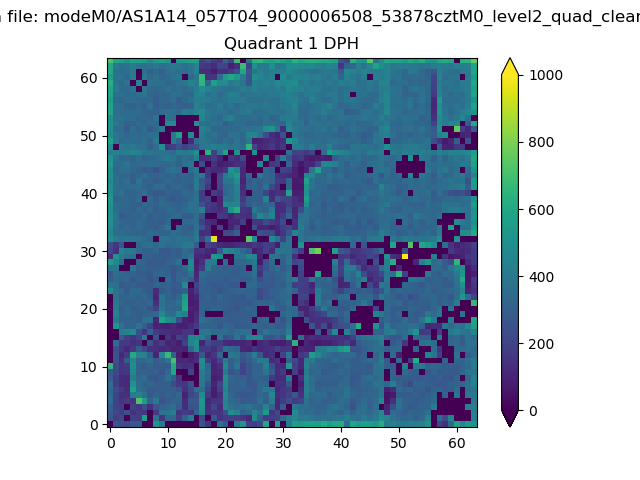 |
Quadrant B |
|---|---|---|---|
| Quadrant D | 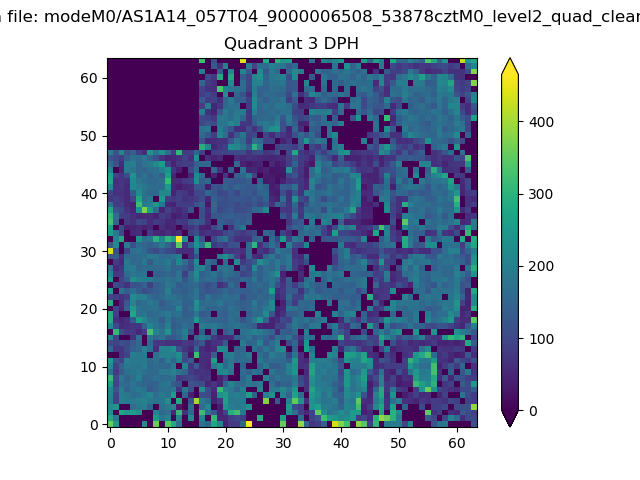 |
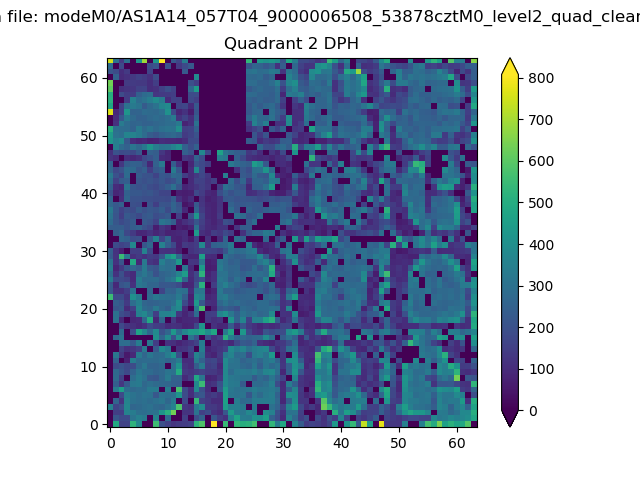 |
Quadrant C |
| Plot type | Count rate plots | Images |
|---|---|---|
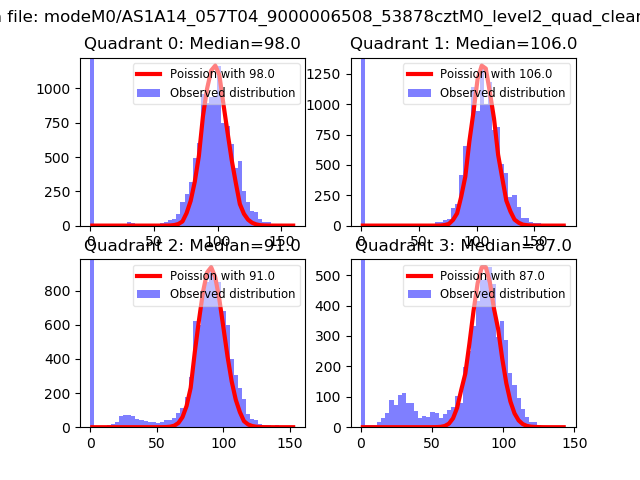
| Comparison with Poisson distribution Blue bars denote a histogram of data divided into 1 sec bins. Red curve is a Poisson curve with rate = median count rate of data. |
 |
 |
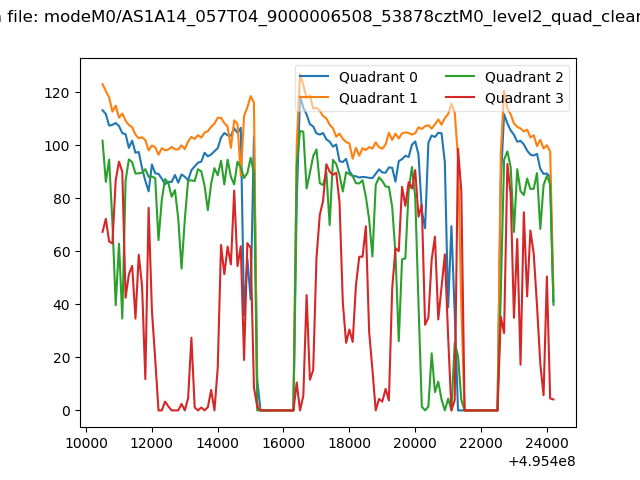
| Quadrant-wise count rates Data is divided into 100 sec bins |
 |
|
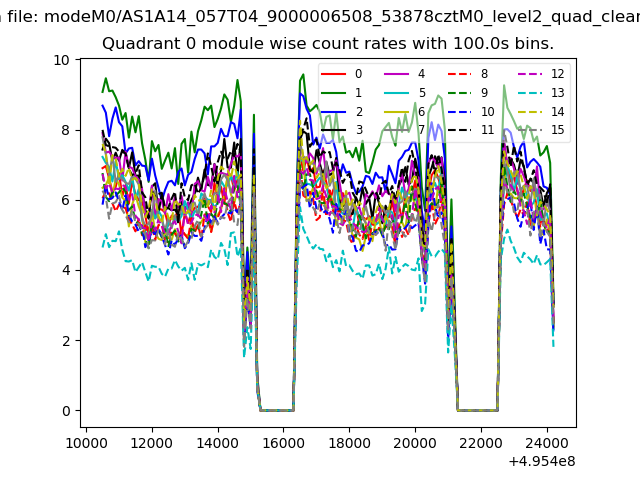
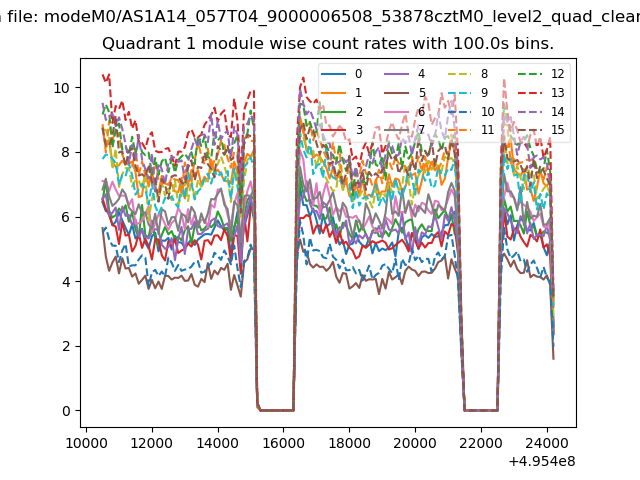
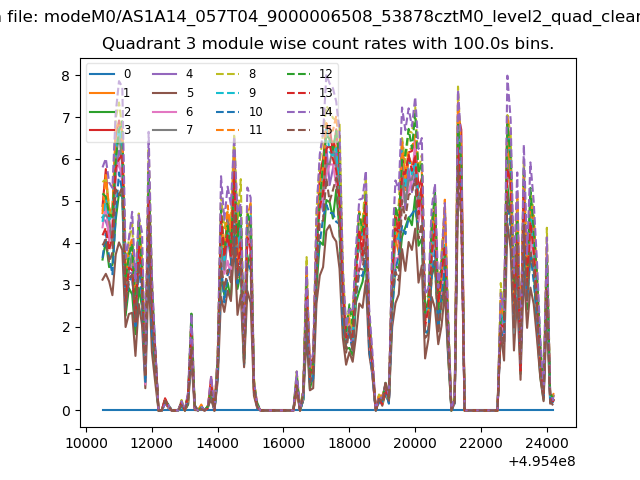
| Module-wise count rates for Quadrant A Data is divided into 100 sec bins |
 |
 |
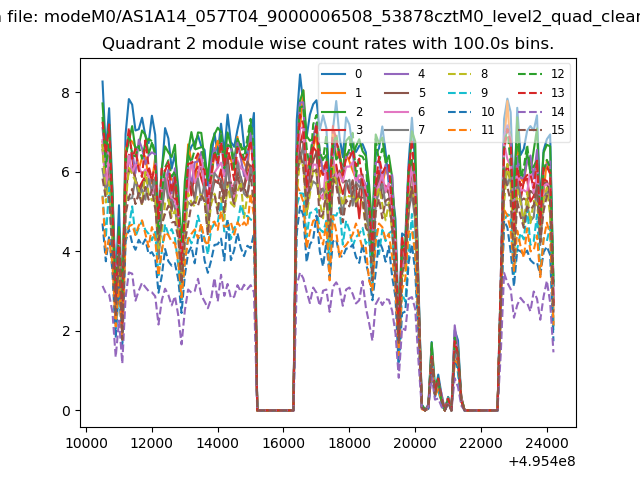
| Module-wise count rates for Quadrant B Data is divided into 100 sec bins |
 |
 |
| Module-wise count rates for Quadrant C Data is divided into 100 sec bins |
 |
 |
| Module-wise count rates for Quadrant D Data is divided into 100 sec bins |
 |
 |
| Parameter | Plot |
|---|---|
| CZT HV Monitor |  |
| D_VDD | 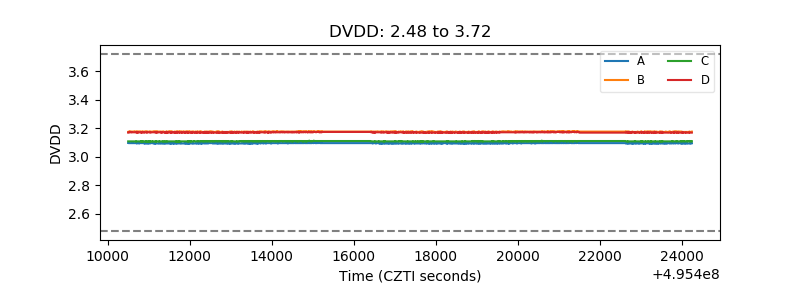 |
| Temperature 1 | 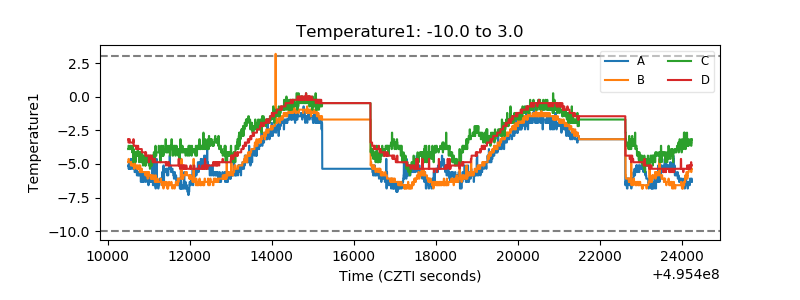 |
| Veto HV Monitor | 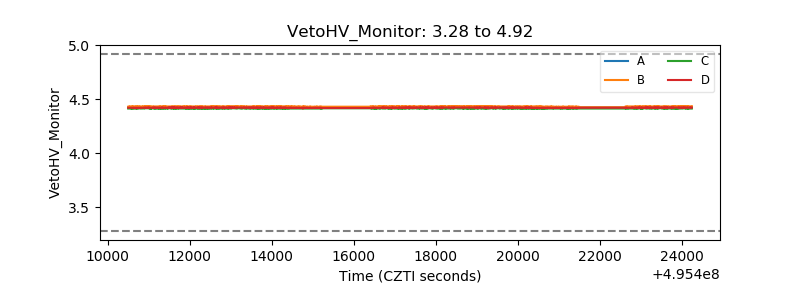 |
| Veto LLD | 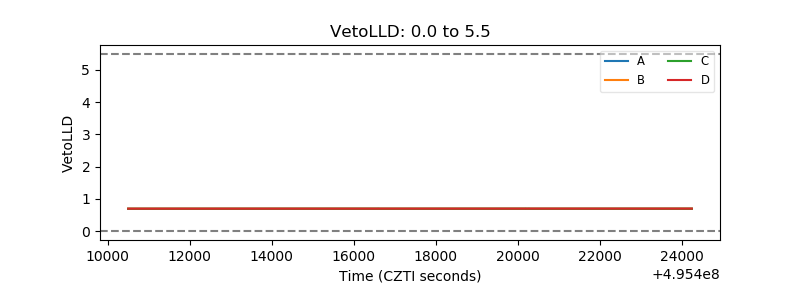 |
| Alpha Counter | 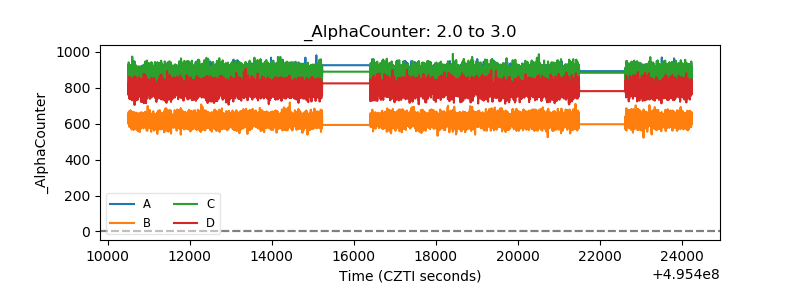 |
| _CPM_Rate | 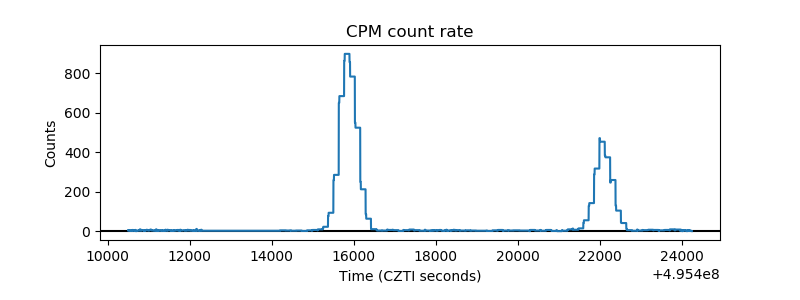 |
| CZT Counter | 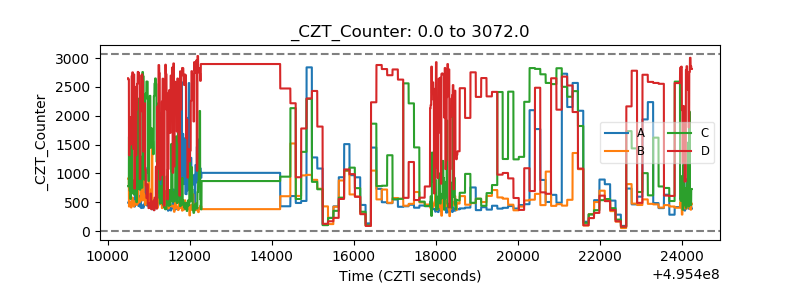 |
| +2.5 Volts monitor | 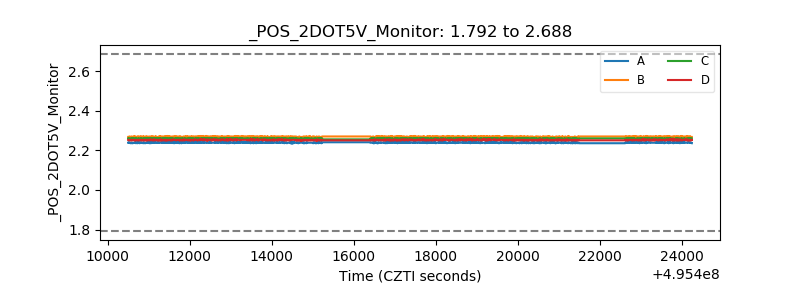 |
| +5 Volts monitor |  |
| _ROLL_ROT | 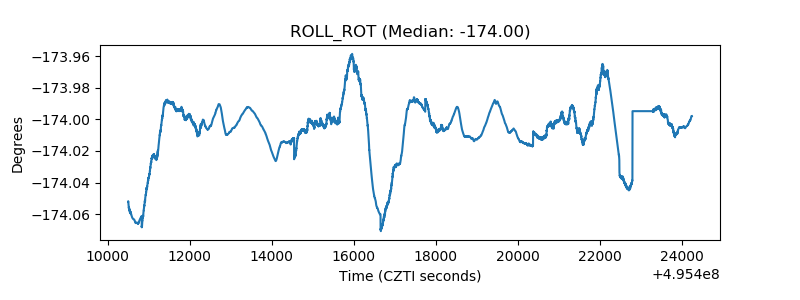 |
| _Roll_DEC | 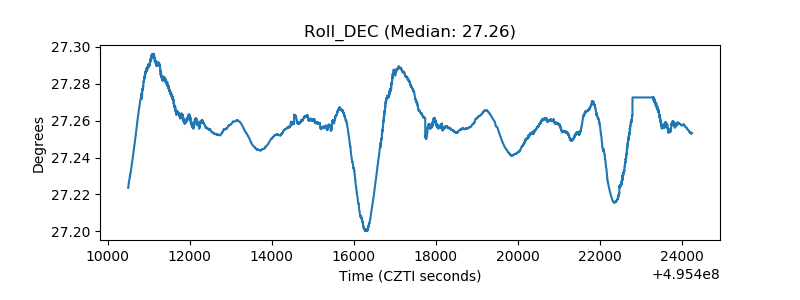 |
| _Roll_RA | 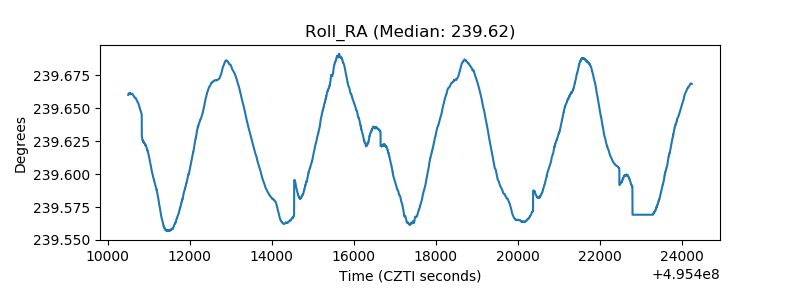 |
| Veto Counter | 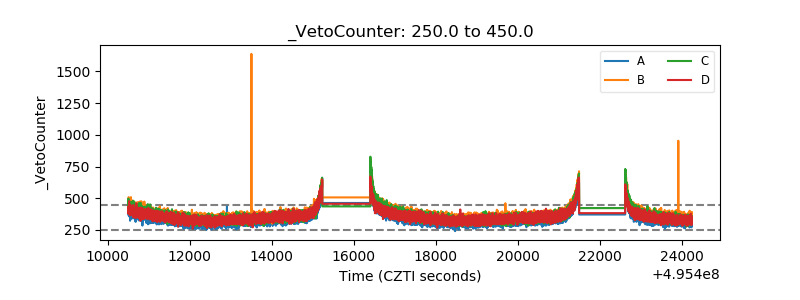 |