| Param | Original file | Final file |
|---|---|---|
| Filename | modeM0/AS1A14_057T04_9000006508_53879cztM0_level2.fits | modeM0/AS1A14_057T04_9000006508_53879cztM0_level2_quad_clean.evt |
| Size (bytes) | 669,493,440 | 81,449,280 |
| Size | 638.5 MB | 77.7 MB |
| Events in quadrant A | 3,481,531 | 575,798 |
| Events in quadrant B | 3,040,049 | 638,132 |
| Events in quadrant C | 7,507,041 | 477,282 |
| Events in quadrant D | 10,268,529 | 338,599 |
| Mode M0 | |||
|---|---|---|---|
| Quadrant | BADHDUFLAG | Total packets | Discarded packets |
| A | 0 | 14919 | 1 |
| B | 0 | 13435 | 1 |
| C | 0 | 26626 | 2 |
| D | 0 | 34822 | 1 |
| Mode SS | |||
|---|---|---|---|
| Quadrant | BADHDUFLAG | Total packets | Discarded packets |
| A | 0 | 126 | 0 |
| B | 0 | 126 | 0 |
| C | 0 | 126 | 0 |
| D | 0 | 126 | 0 |
| Mode M9 | |||
|---|---|---|---|
| Quadrant | BADHDUFLAG | Total packets | Discarded packets |
| A | 0 | 10 | 0 |
| B | 0 | 10 | 0 |
| C | 0 | 10 | 0 |
| D | 0 | 10 | 0 |
| Quadrant | Total seconds | Saturated seconds | Saturation percentage |
|---|---|---|---|
| A | 6254 | 343 | 5.484490% |
| B | 6254 | 137 | 2.190598% |
| C | 6253 | 1334 | 21.333760% |
| D | 6253 | 2679 | 42.843435% |
Noise dominated data is calculated using 1-second bins in cleaned event files. If a bin has >2000 counts, and if more than 50% of those come from <1% of pixels, then it is considered to be noise-dominated and hence unusable.
| Quadrant | # 1 sec bins | Bins with >0 counts | Bins with >2000 counts | High rate bins dominated by noise | Noise dominated (total time) | Noise dominated (detector-on time) | Marked lightcurve |
|---|---|---|---|---|---|---|---|
| A | 7179 | 6255 | 165 | 165 | 2.30% | 2.64% | 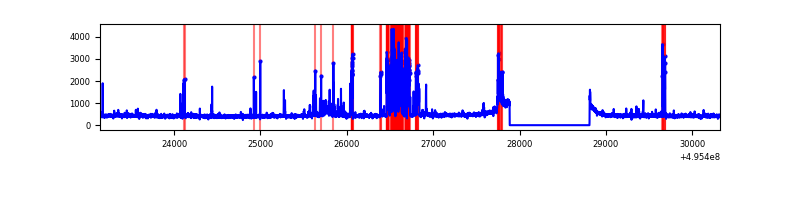 |
| B | 7179 | 6255 | 11 | 11 | 0.15% | 0.18% | 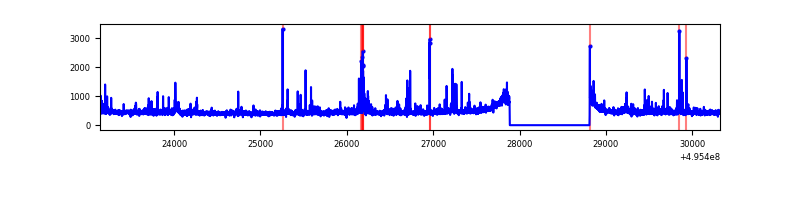 |
| C | 7178 | 6254 | 1025 | 1025 | 14.28% | 16.39% | 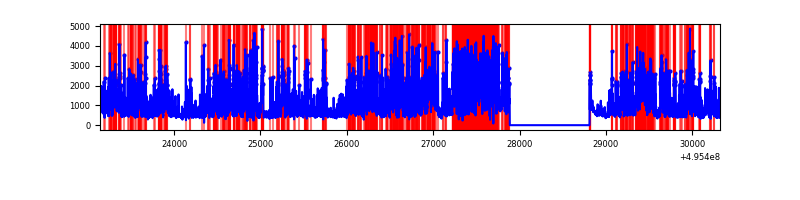 |
| D | 7178 | 6254 | 2252 | 2252 | 31.37% | 36.01% | 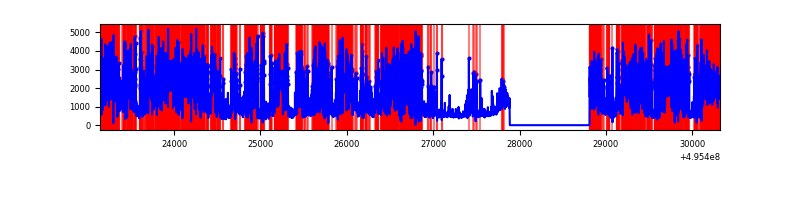 |
Top three noisy pixels from each quadrant. If the there are fewer than three noisy pixels in the level2.evt file, extra rows are filled as -1
| Pixel properties | Quadrant properties | ||||||
|---|---|---|---|---|---|---|---|
| Quadrant | DetID | PixID | Counts | Sigma | Mean | Median | Sigma |
| A | 15 | 174 | 700830 | 4111.07 | 686 | 668 | 170.3 |
| A | 3 | 62 | 54516 | 316.17 | 686 | 668 | 170.3 |
| A | 12 | 96 | 19333 | 109.59 | 686 | 668 | 170.3 |
| B | 5 | 185 | 80157 | 537.36 | 689 | 666 | 147.9 |
| B | 0 | 171 | 63681 | 425.98 | 689 | 666 | 147.9 |
| B | 0 | 213 | 58210 | 389.0 | 689 | 666 | 147.9 |
| C | 15 | 224 | 2724628 | 16367.78 | 607 | 599 | 166.4 |
| C | 15 | 158 | 1317115 | 7910.51 | 607 | 599 | 166.4 |
| C | 15 | 209 | 632115 | 3794.57 | 607 | 599 | 166.4 |
| D | 8 | 176 | 7009058 | 45263.87 | 537 | 513 | 154.8 |
| D | 2 | 172 | 381526 | 2460.72 | 537 | 513 | 154.8 |
| D | 6 | 239 | 326295 | 2104.02 | 537 | 513 | 154.8 |
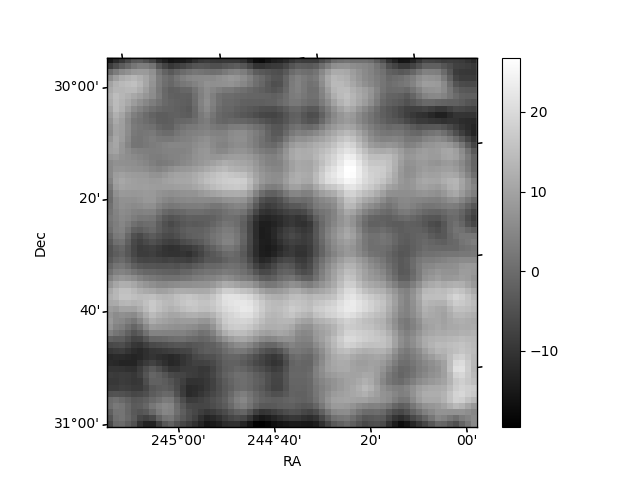
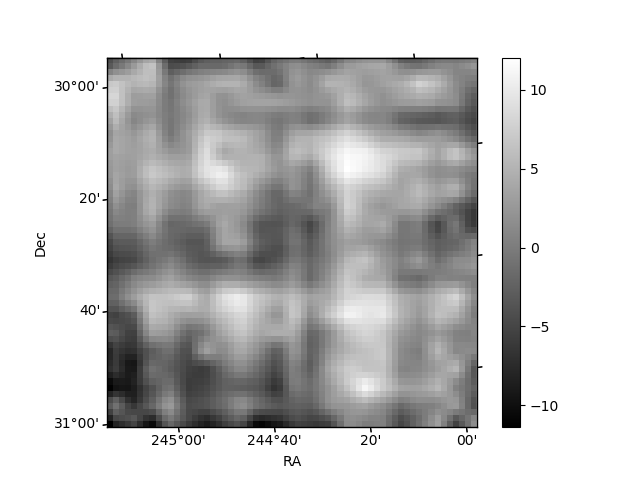
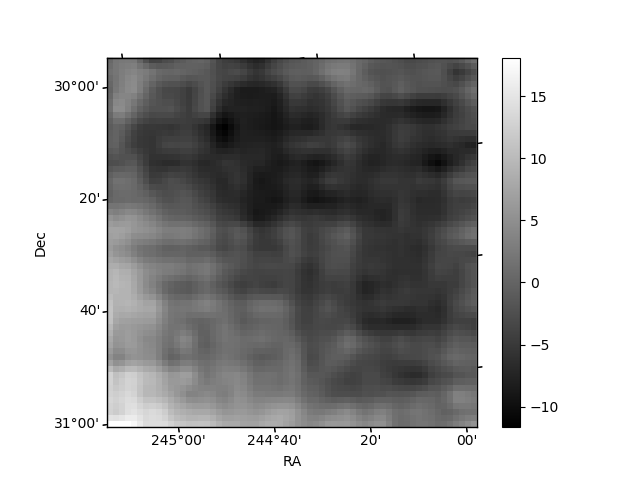
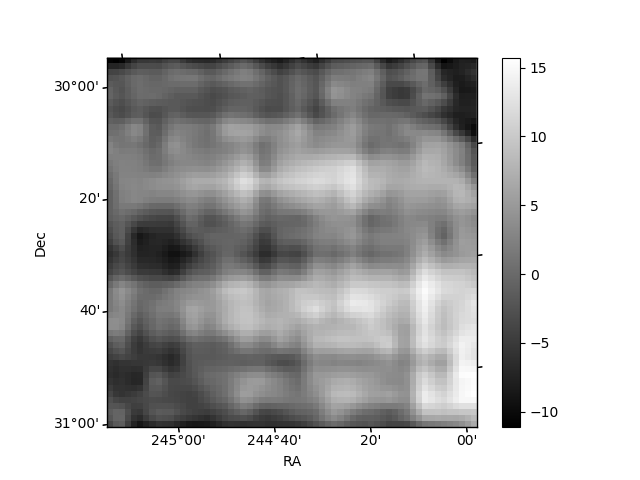
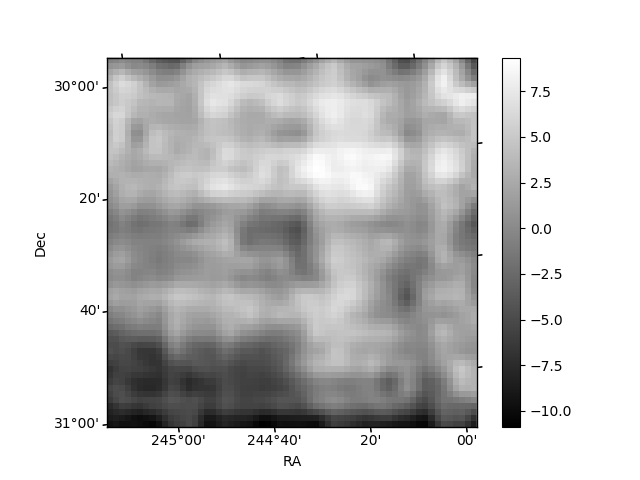
Histogram calculated using DETX and DETY for each event in the final _common_clean file
| Quadrant A | 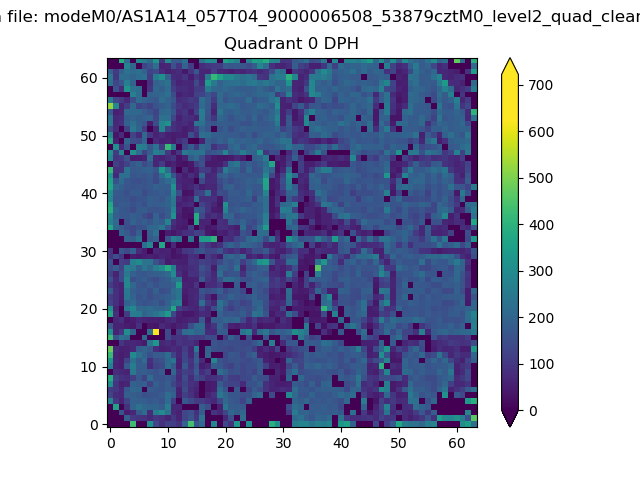 |
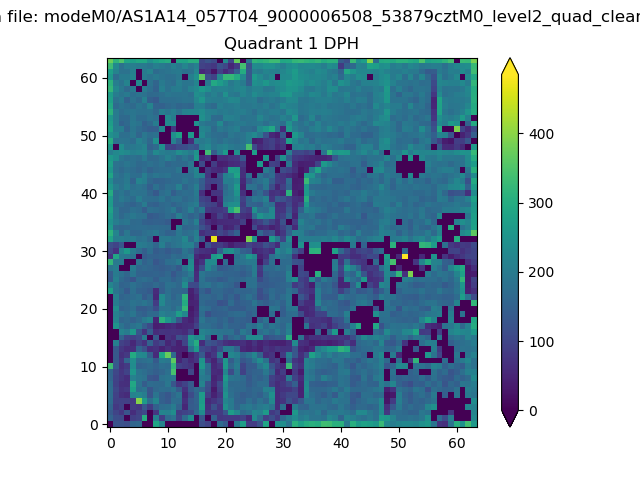 |
Quadrant B |
|---|---|---|---|
| Quadrant D | 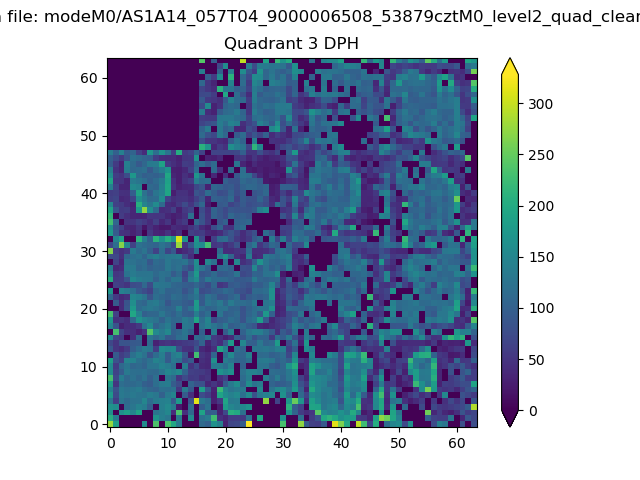 |
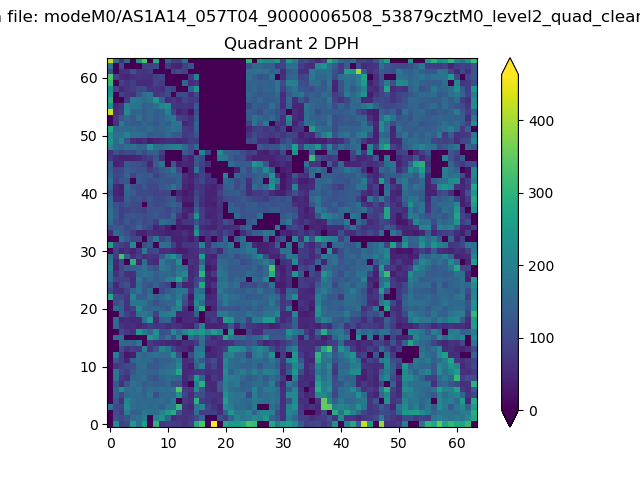 |
Quadrant C |
| Plot type | Count rate plots | Images |
|---|---|---|
| Comparison with Poisson distribution Blue bars denote a histogram of data divided into 1 sec bins. Red curve is a Poisson curve with rate = median count rate of data. |
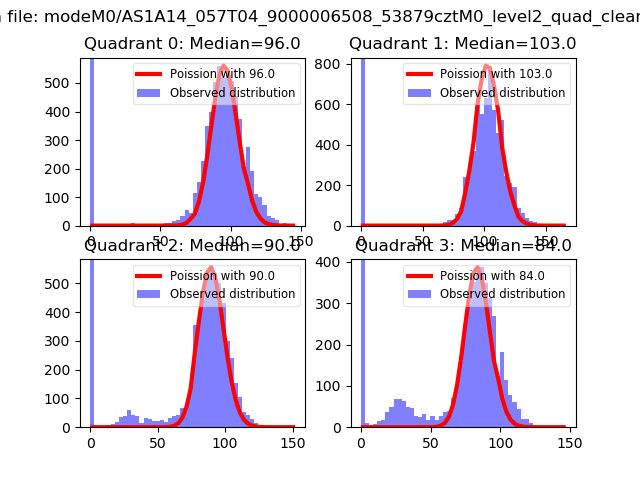 |
 |
| Quadrant-wise count rates Data is divided into 100 sec bins |
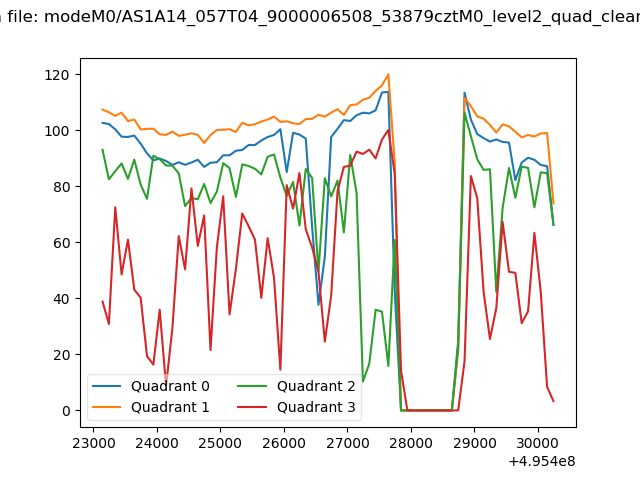 |
|
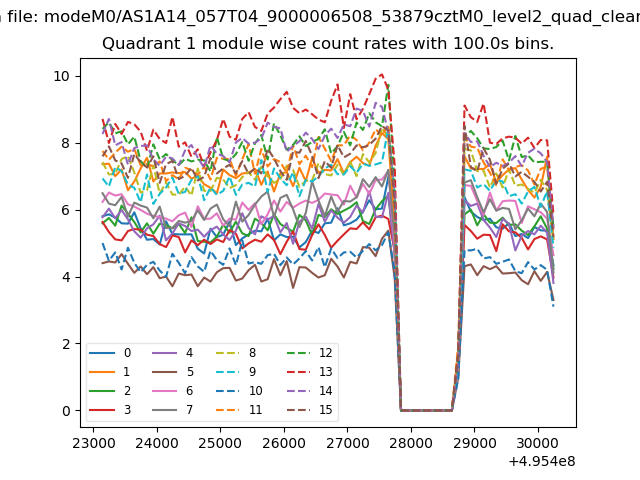
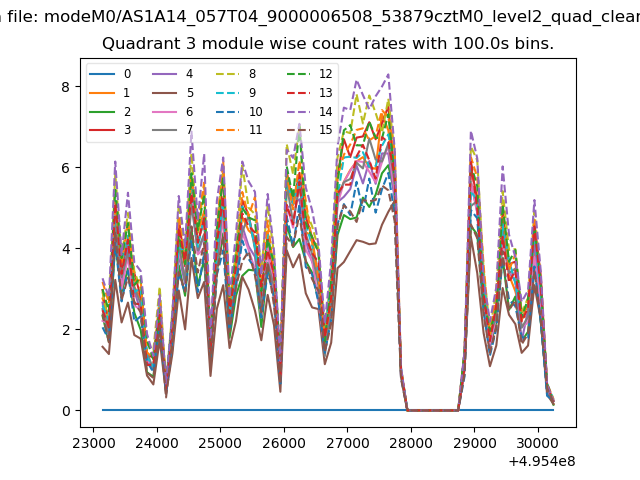
| Module-wise count rates for Quadrant A Data is divided into 100 sec bins |
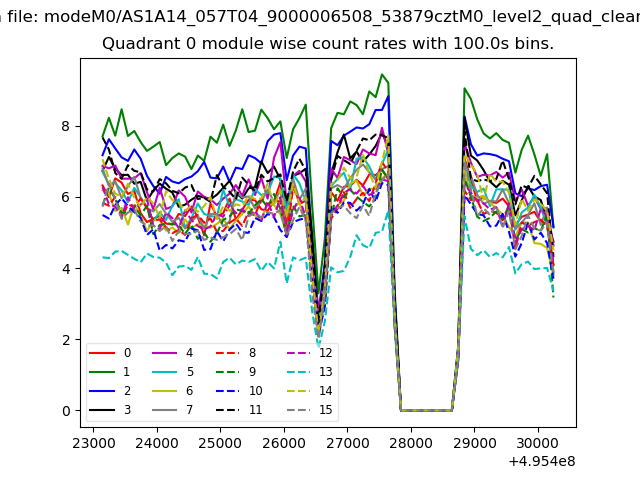 |
 |
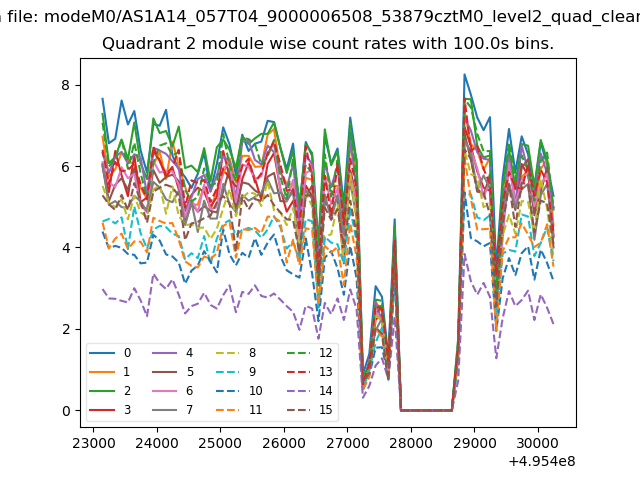
| Module-wise count rates for Quadrant B Data is divided into 100 sec bins |
 |
 |
| Module-wise count rates for Quadrant C Data is divided into 100 sec bins |
 |
 |
| Module-wise count rates for Quadrant D Data is divided into 100 sec bins |
 |
 |
| Parameter | Plot |
|---|---|
| CZT HV Monitor | 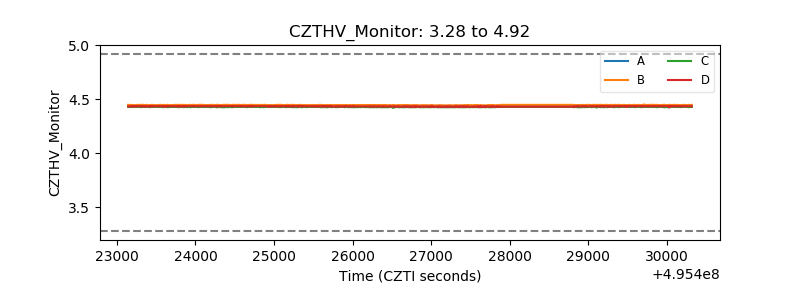 |
| D_VDD | 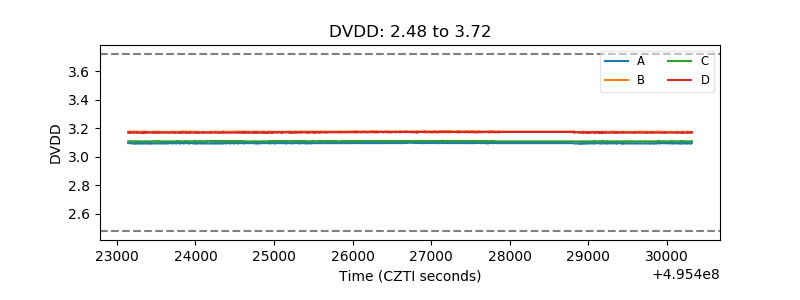 |
| Temperature 1 | 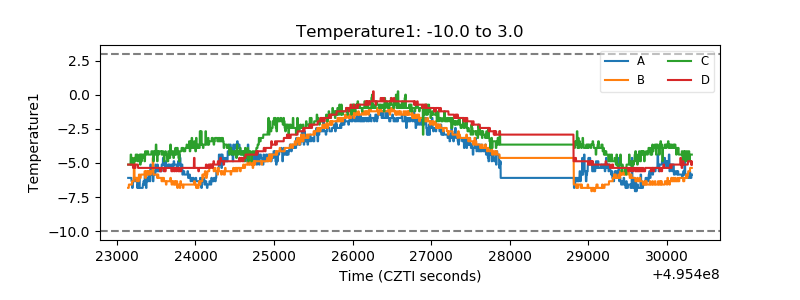 |
| Veto HV Monitor | 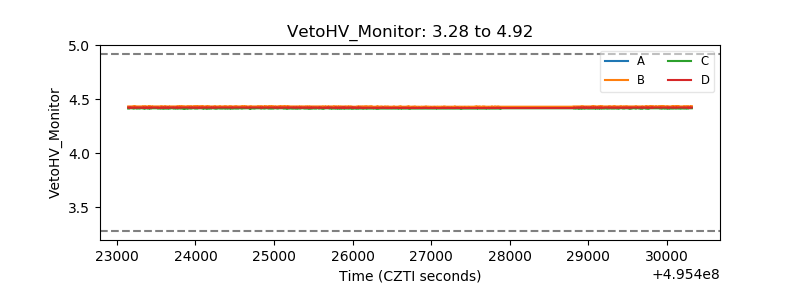 |
| Veto LLD | 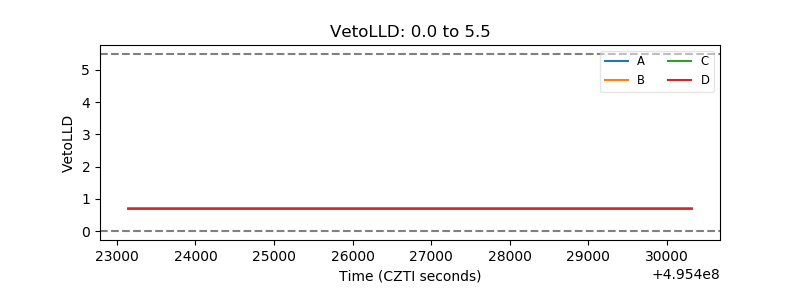 |
| Alpha Counter | 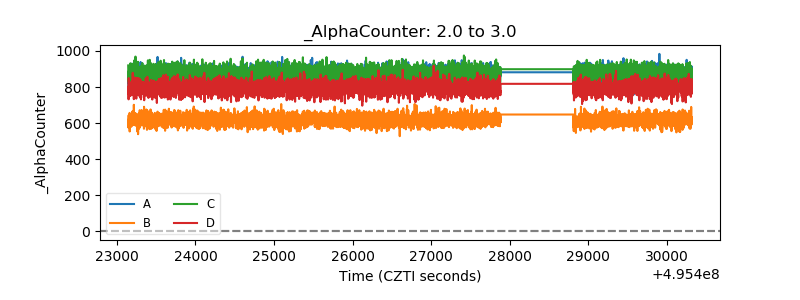 |
| _CPM_Rate | 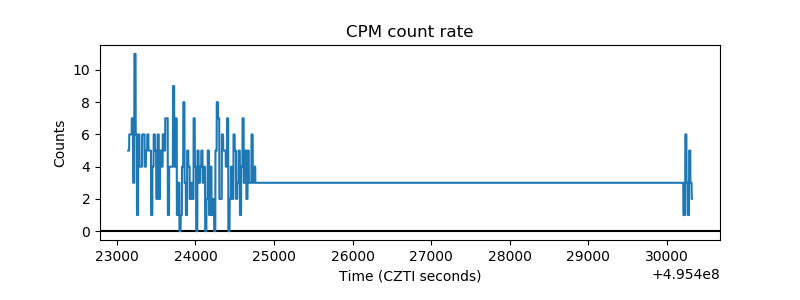 |
| CZT Counter | 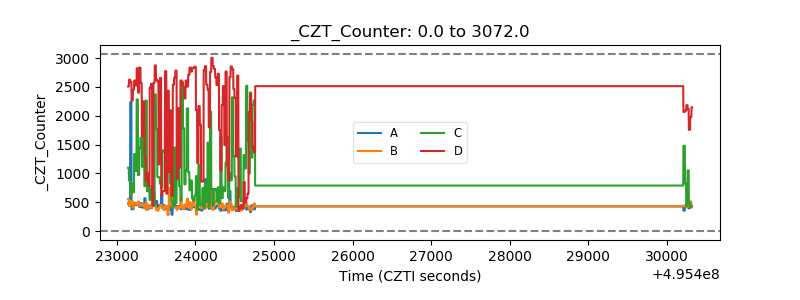 |
| +2.5 Volts monitor | 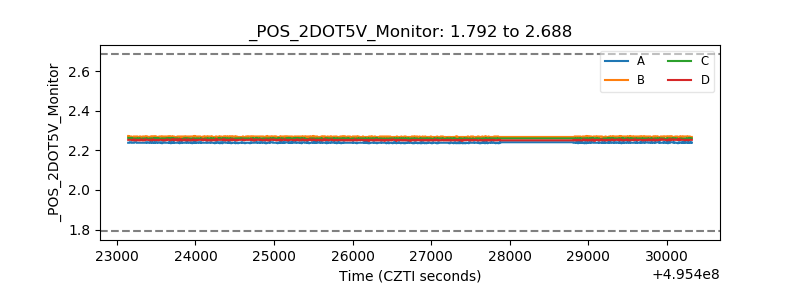 |
| +5 Volts monitor |  |
| _ROLL_ROT | 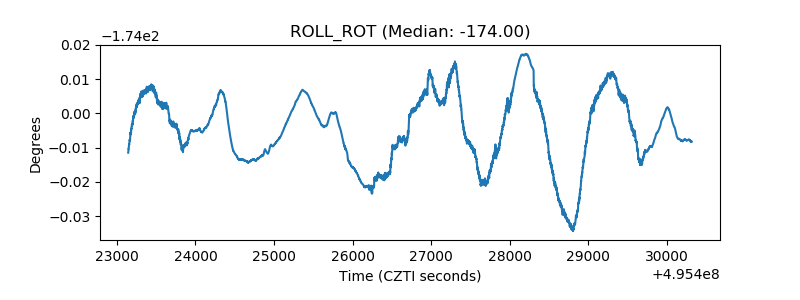 |
| _Roll_DEC | 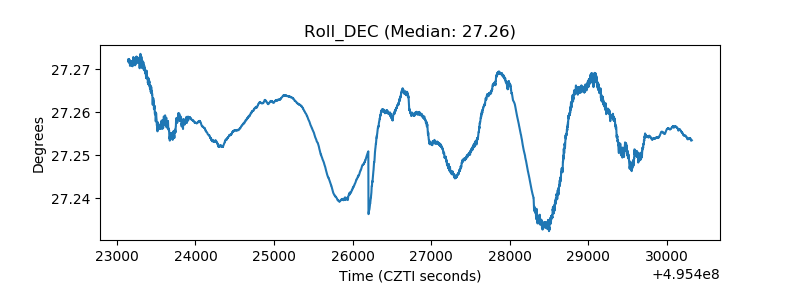 |
| _Roll_RA | 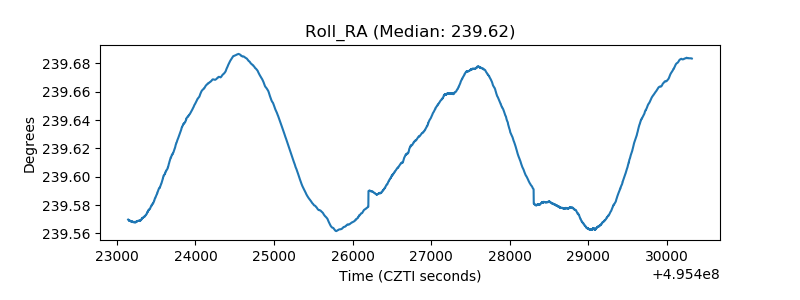 |
| Veto Counter | 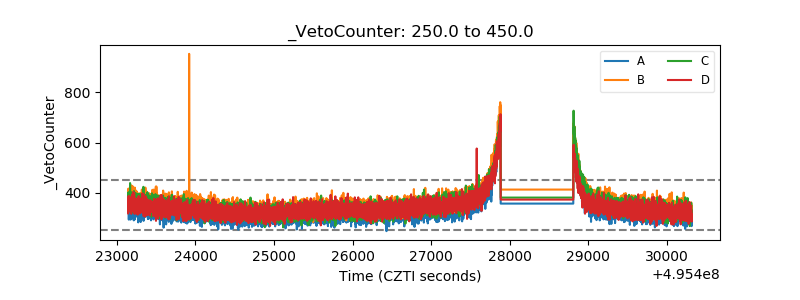 |