| Param | Original file | Final file |
|---|---|---|
| Filename | modeM0/AS1A14_057T04_9000006508_53880cztM0_level2.fits | modeM0/AS1A14_057T04_9000006508_53880cztM0_level2_quad_clean.evt |
| Size (bytes) | 902,361,600 | 81,247,680 |
| Size | 860.6 MB | 77.5 MB |
| Events in quadrant A | 5,209,222 | 581,024 |
| Events in quadrant B | 3,645,563 | 684,778 |
| Events in quadrant C | 9,360,320 | 467,488 |
| Events in quadrant D | 14,640,543 | 234,698 |
| Mode M0 | |||
|---|---|---|---|
| Quadrant | BADHDUFLAG | Total packets | Discarded packets |
| A | 0 | 20523 | 1 |
| B | 0 | 15877 | 1 |
| C | 0 | 32706 | 1 |
| D | 0 | 48309 | 1 |
| Mode SS | |||
|---|---|---|---|
| Quadrant | BADHDUFLAG | Total packets | Discarded packets |
| A | 0 | 144 | 0 |
| B | 0 | 144 | 0 |
| C | 0 | 144 | 0 |
| D | 0 | 144 | 0 |
| Mode M9 | |||
|---|---|---|---|
| Quadrant | BADHDUFLAG | Total packets | Discarded packets |
| A | 0 | 4 | 0 |
| B | 0 | 4 | 0 |
| C | 0 | 4 | 0 |
| D | 0 | 4 | 0 |
| Quadrant | Total seconds | Saturated seconds | Saturation percentage |
|---|---|---|---|
| A | 7057 | 964 | 13.660196% |
| B | 7057 | 389 | 5.512257% |
| C | 7057 | 2212 | 31.344764% |
| D | 7057 | 4682 | 66.345473% |
Noise dominated data is calculated using 1-second bins in cleaned event files. If a bin has >2000 counts, and if more than 50% of those come from <1% of pixels, then it is considered to be noise-dominated and hence unusable.
| Quadrant | # 1 sec bins | Bins with >0 counts | Bins with >2000 counts | High rate bins dominated by noise | Noise dominated (total time) | Noise dominated (detector-on time) | Marked lightcurve |
|---|---|---|---|---|---|---|---|
| A | 7432 | 7058 | 635 | 635 | 8.54% | 9.00% | 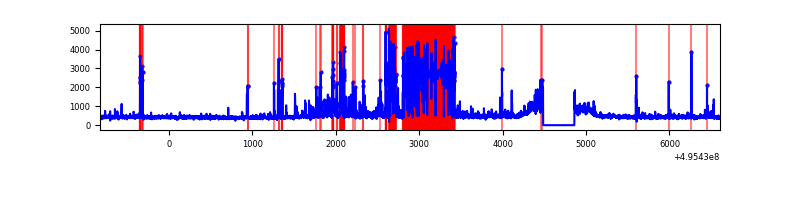 |
| B | 7432 | 7058 | 42 | 42 | 0.57% | 0.60% | 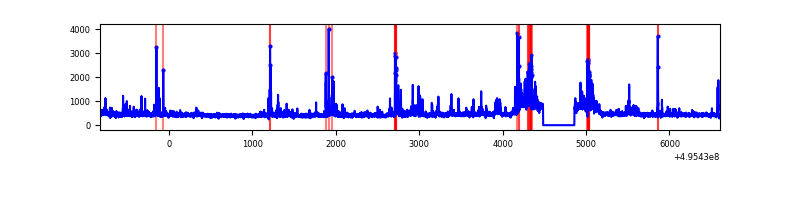 |
| C | 7432 | 7057 | 1500 | 1500 | 20.18% | 21.26% | 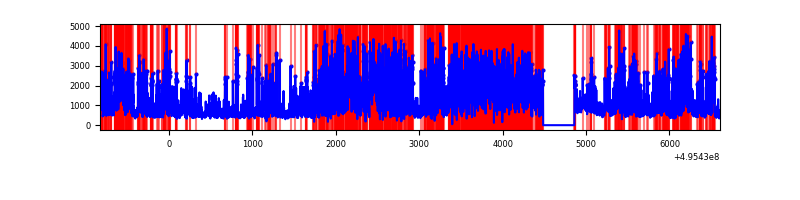 |
| D | 7432 | 7058 | 3904 | 3904 | 52.53% | 55.31% | 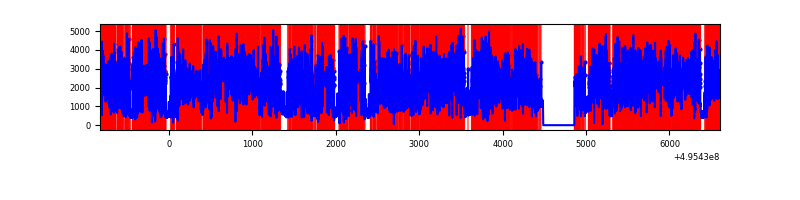 |
Top three noisy pixels from each quadrant. If the there are fewer than three noisy pixels in the level2.evt file, extra rows are filled as -1
| Pixel properties | Quadrant properties | ||||||
|---|---|---|---|---|---|---|---|
| Quadrant | DetID | PixID | Counts | Sigma | Mean | Median | Sigma |
| A | 15 | 174 | 1893963 | 10408.24 | 738 | 718 | 181.9 |
| A | 3 | 62 | 302740 | 1660.39 | 738 | 718 | 181.9 |
| A | 4 | 249 | 61026 | 331.55 | 738 | 718 | 181.9 |
| B | 5 | 185 | 191023 | 1143.43 | 771 | 744 | 166.4 |
| B | 0 | 213 | 152492 | 911.89 | 771 | 744 | 166.4 |
| B | 6 | 255 | 69231 | 411.56 | 771 | 744 | 166.4 |
| C | 15 | 158 | 3909878 | 21778.64 | 655 | 648 | 179.5 |
| C | 15 | 224 | 1828594 | 10183.63 | 655 | 648 | 179.5 |
| C | 15 | 209 | 669610 | 3726.84 | 655 | 648 | 179.5 |
| D | 8 | 176 | 10934085 | 74760.84 | 507 | 482 | 146.2 |
| D | 6 | 239 | 765838 | 5233.28 | 507 | 482 | 146.2 |
| D | 2 | 172 | 653305 | 4463.82 | 507 | 482 | 146.2 |
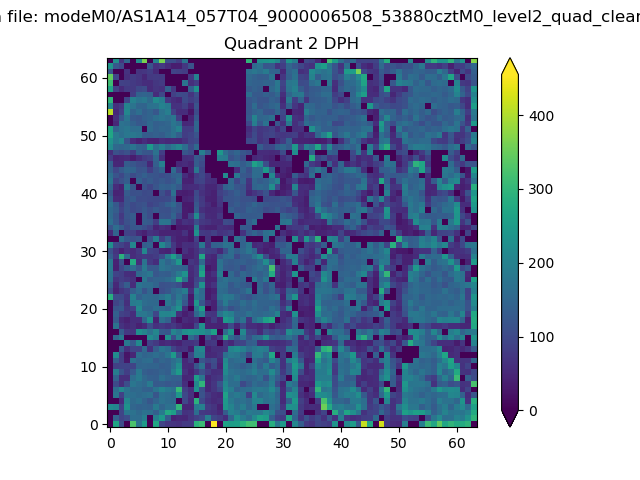
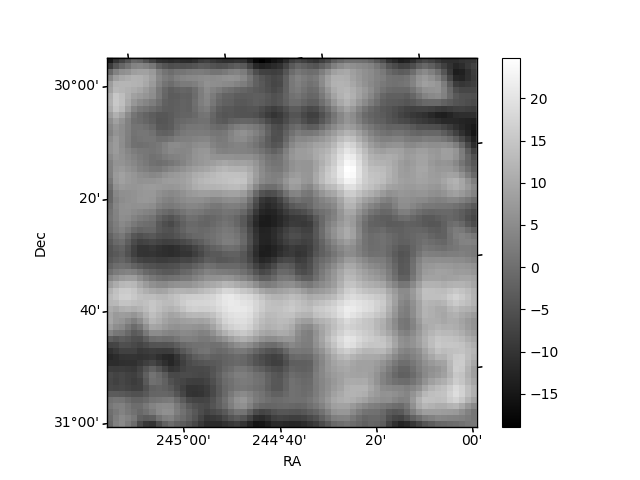
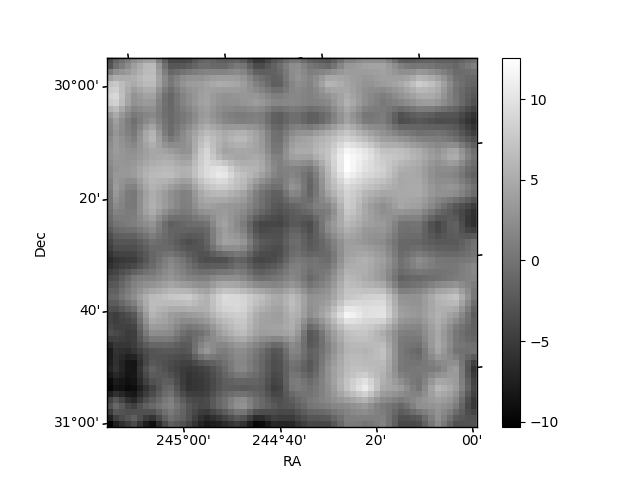
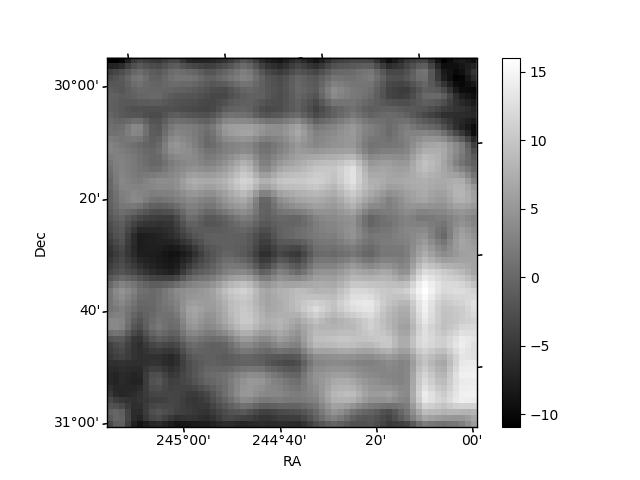
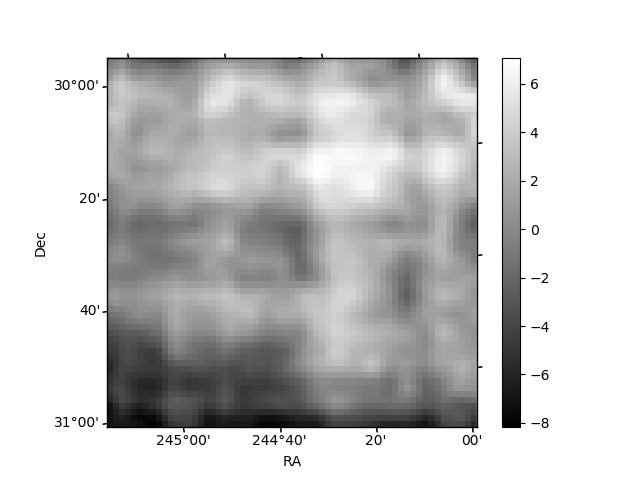
Histogram calculated using DETX and DETY for each event in the final _common_clean file
| Quadrant A | 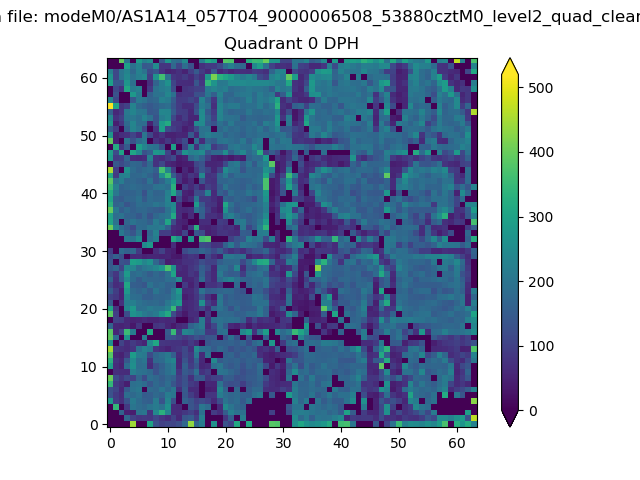 |
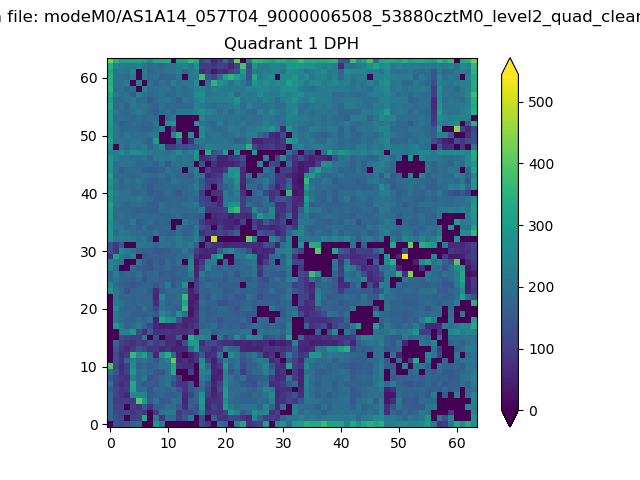 |
Quadrant B |
|---|---|---|---|
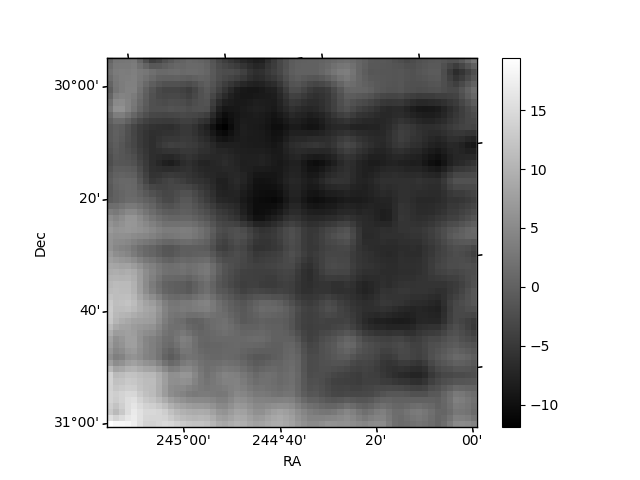
| Quadrant D | 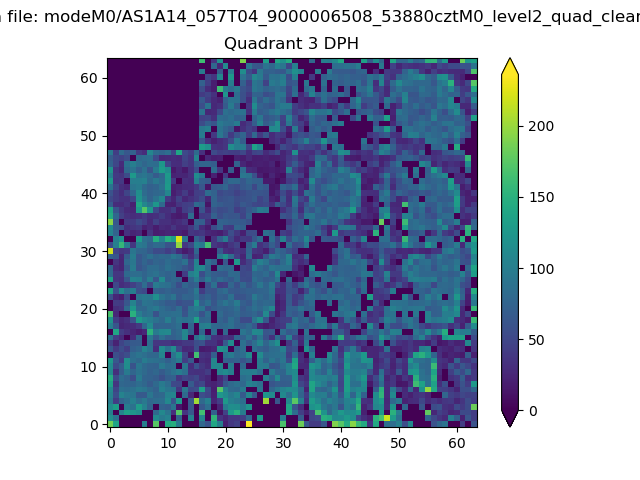 |
 |
Quadrant C |
| Plot type | Count rate plots | Images |
|---|---|---|
| Comparison with Poisson distribution Blue bars denote a histogram of data divided into 1 sec bins. Red curve is a Poisson curve with rate = median count rate of data. |
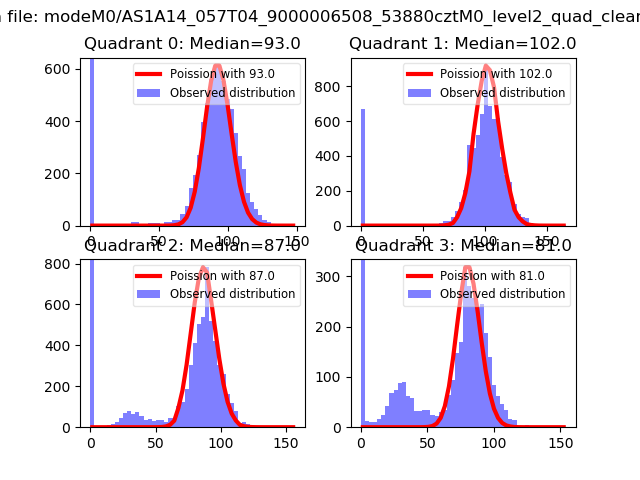 |
 |
| Quadrant-wise count rates Data is divided into 100 sec bins |
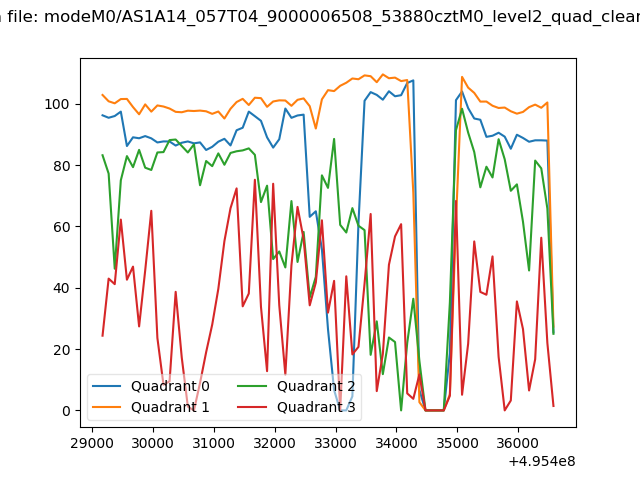 |
|
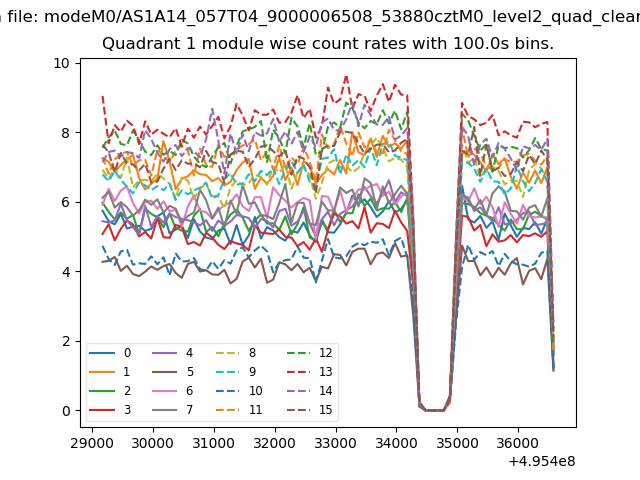
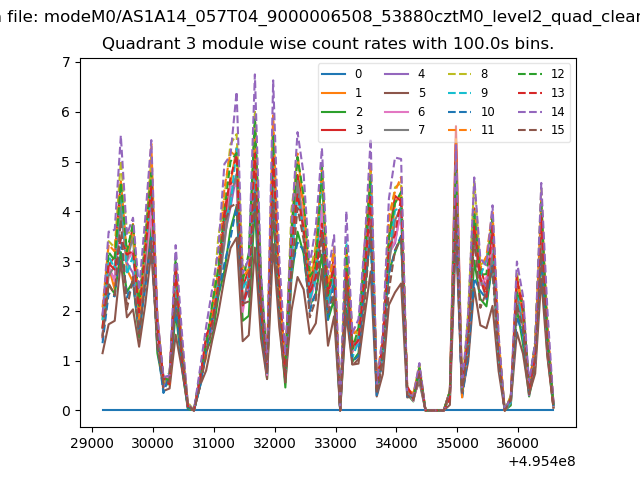
| Module-wise count rates for Quadrant A Data is divided into 100 sec bins |
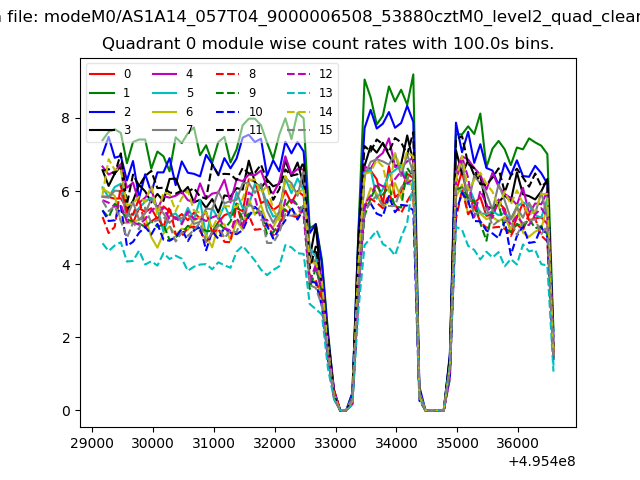 |
 |
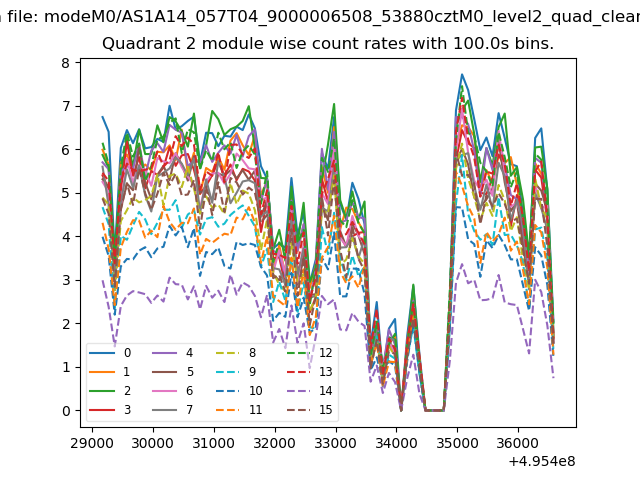
| Module-wise count rates for Quadrant B Data is divided into 100 sec bins |
 |
 |
| Module-wise count rates for Quadrant C Data is divided into 100 sec bins |
 |
 |
| Module-wise count rates for Quadrant D Data is divided into 100 sec bins |
 |
 |
| Parameter | Plot |
|---|---|
| CZT HV Monitor | 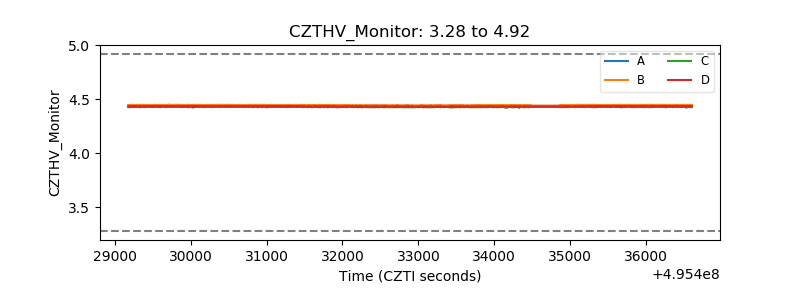 |
| D_VDD | 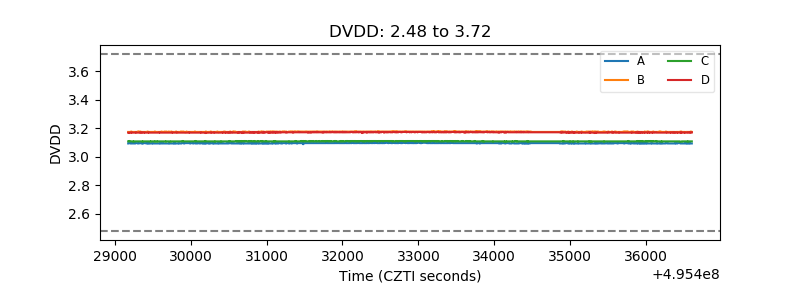 |
| Temperature 1 | 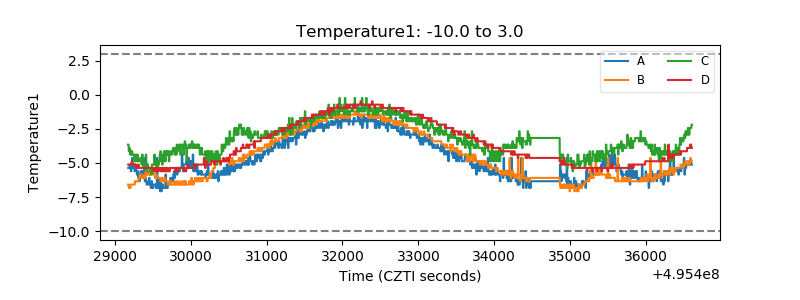 |
| Veto HV Monitor |  |
| Veto LLD | 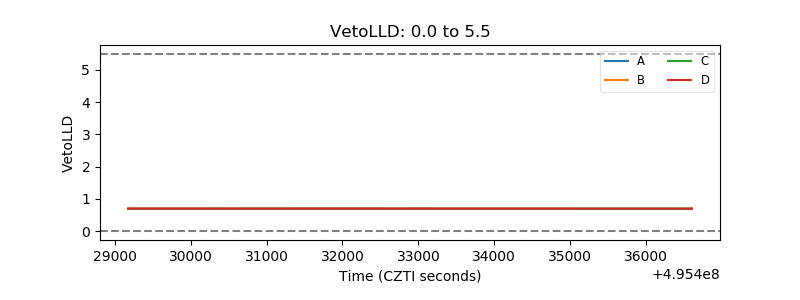 |
| Alpha Counter | 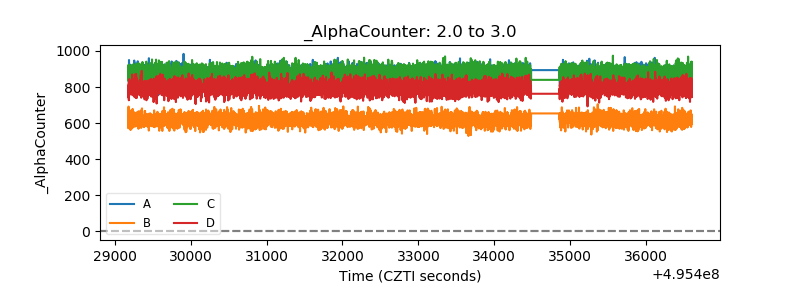 |
| _CPM_Rate | 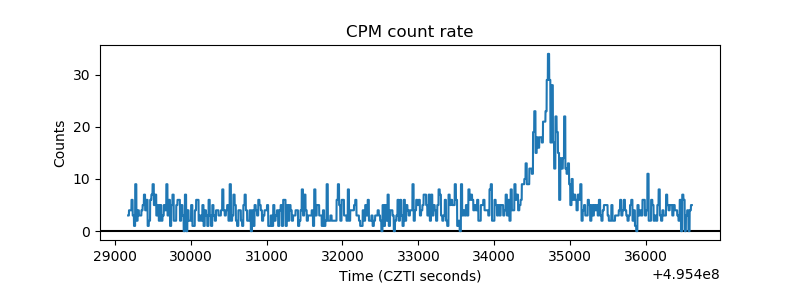 |
| CZT Counter |  |
| +2.5 Volts monitor |  |
| +5 Volts monitor |  |
| _ROLL_ROT | 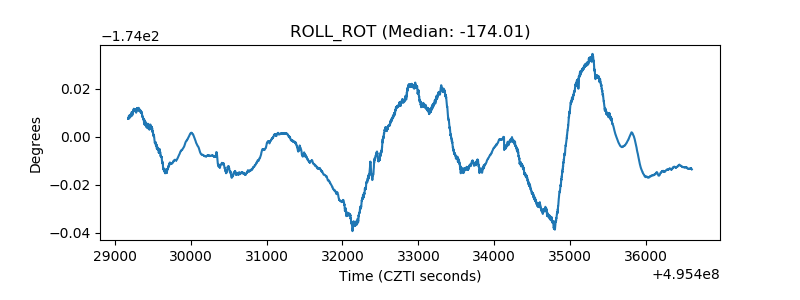 |
| _Roll_DEC | 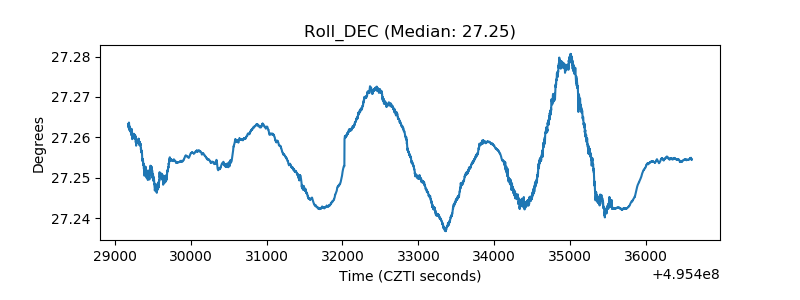 |
| _Roll_RA | 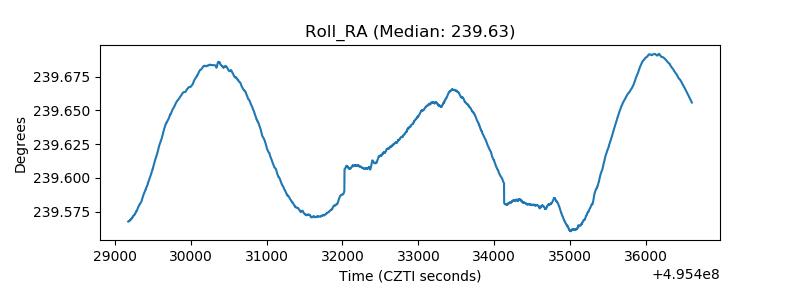 |
| Veto Counter | 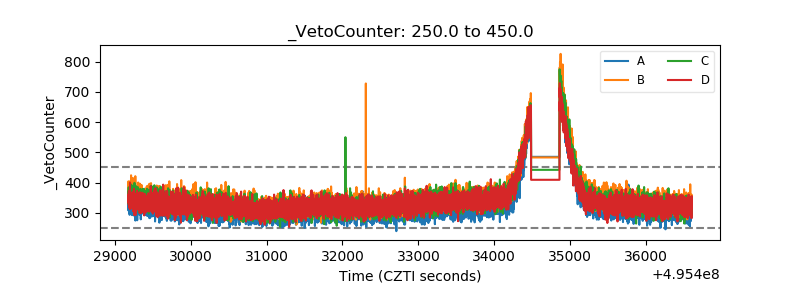 |