| Param | Original file | Final file |
|---|---|---|
| Filename | modeM0/AS1A14_057T04_9000006508_53881cztM0_level2.fits | modeM0/AS1A14_057T04_9000006508_53881cztM0_level2_quad_clean.evt |
| Size (bytes) | 893,324,160 | 90,126,720 |
| Size | 851.9 MB | 86.0 MB |
| Events in quadrant A | 5,199,991 | 636,761 |
| Events in quadrant B | 4,039,987 | 729,227 |
| Events in quadrant C | 9,626,022 | 540,980 |
| Events in quadrant D | 13,633,248 | 309,665 |
| Mode M0 | |||
|---|---|---|---|
| Quadrant | BADHDUFLAG | Total packets | Discarded packets |
| A | 0 | 20672 | 0 |
| B | 0 | 17217 | 0 |
| C | 0 | 33687 | 0 |
| D | 0 | 45556 | 0 |
| Mode SS | |||
|---|---|---|---|
| Quadrant | BADHDUFLAG | Total packets | Discarded packets |
| A | 0 | 148 | 0 |
| B | 0 | 148 | 0 |
| C | 0 | 148 | 0 |
| D | 0 | 148 | 0 |
| Quadrant | Total seconds | Saturated seconds | Saturation percentage |
|---|---|---|---|
| A | 7349 | 677 | 9.212138% |
| B | 7348 | 226 | 3.075667% |
| C | 7348 | 1749 | 23.802395% |
| D | 7349 | 4049 | 55.095931% |
Noise dominated data is calculated using 1-second bins in cleaned event files. If a bin has >2000 counts, and if more than 50% of those come from <1% of pixels, then it is considered to be noise-dominated and hence unusable.
| Quadrant | # 1 sec bins | Bins with >0 counts | Bins with >2000 counts | High rate bins dominated by noise | Noise dominated (total time) | Noise dominated (detector-on time) | Marked lightcurve |
|---|---|---|---|---|---|---|---|
| A | 7349 | 7349 | 546 | 546 | 7.43% | 7.43% |  |
| B | 7348 | 7348 | 122 | 122 | 1.66% | 1.66% | 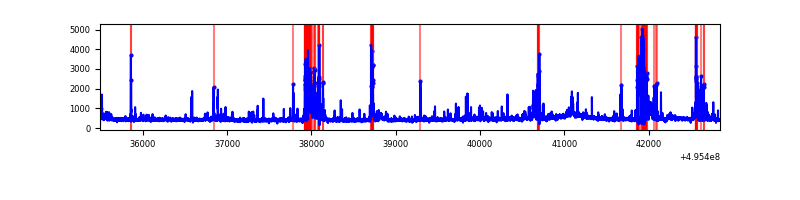 |
| C | 7348 | 7348 | 1380 | 1380 | 18.78% | 18.78% | 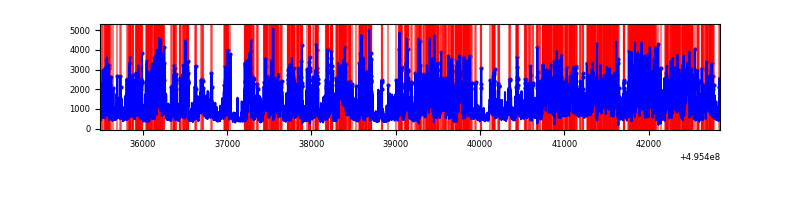 |
| D | 7349 | 7349 | 3561 | 3561 | 48.46% | 48.46% | 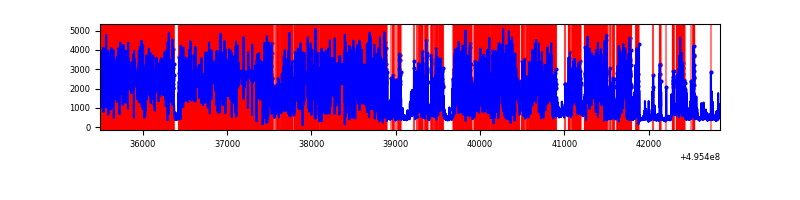 |
Top three noisy pixels from each quadrant. If the there are fewer than three noisy pixels in the level2.evt file, extra rows are filled as -1
| Pixel properties | Quadrant properties | ||||||
|---|---|---|---|---|---|---|---|
| Quadrant | DetID | PixID | Counts | Sigma | Mean | Median | Sigma |
| A | 15 | 174 | 1795581 | 9432.56 | 769 | 748 | 190.3 |
| A | 3 | 62 | 309858 | 1624.5 | 769 | 748 | 190.3 |
| A | 10 | 253 | 48824 | 252.66 | 769 | 748 | 190.3 |
| B | 0 | 213 | 444439 | 2618.77 | 785 | 756 | 169.4 |
| B | 5 | 185 | 224718 | 1321.9 | 785 | 756 | 169.4 |
| B | 7 | 129 | 58702 | 342.02 | 785 | 756 | 169.4 |
| C | 15 | 209 | 2844447 | 14801.84 | 703 | 695 | 192.1 |
| C | 15 | 224 | 2385605 | 12413.55 | 703 | 695 | 192.1 |
| C | 15 | 158 | 522310 | 2715.03 | 703 | 695 | 192.1 |
| D | 8 | 176 | 9865295 | 63675.78 | 542 | 516 | 154.9 |
| D | 6 | 239 | 864002 | 5573.68 | 542 | 516 | 154.9 |
| D | 2 | 172 | 376585 | 2427.47 | 542 | 516 | 154.9 |
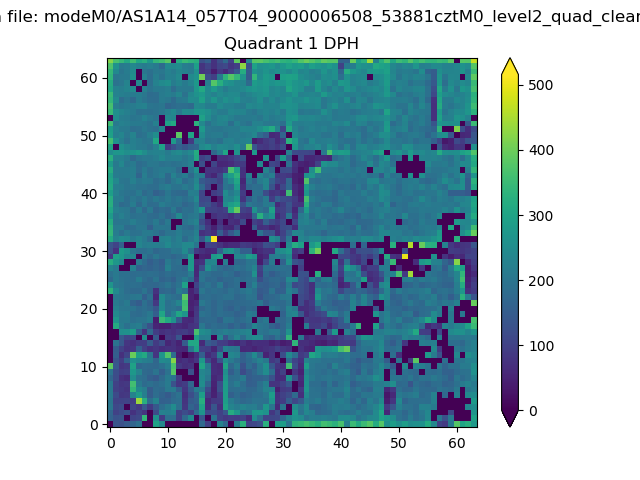
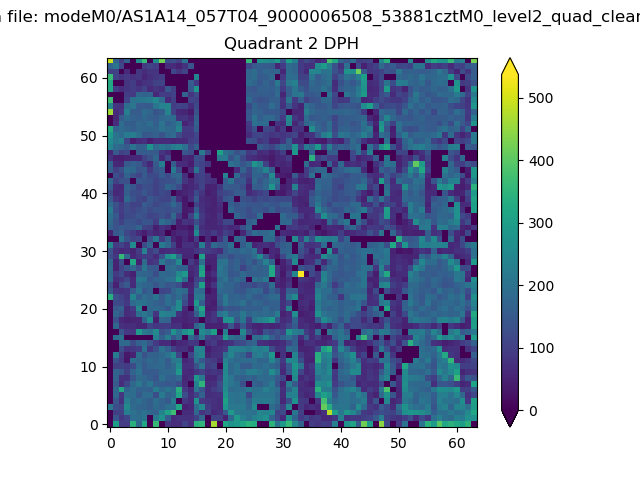
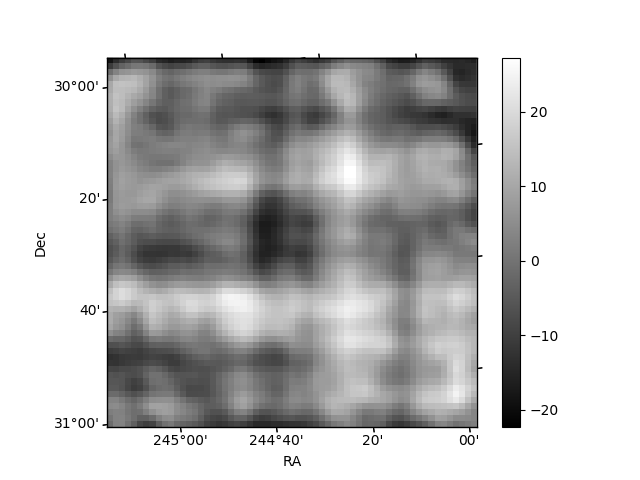
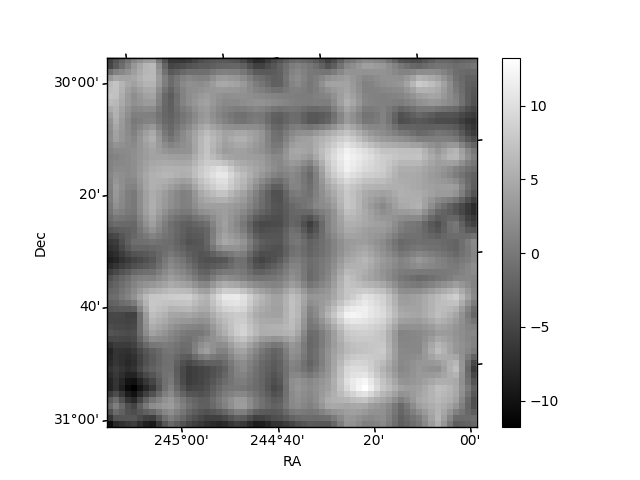
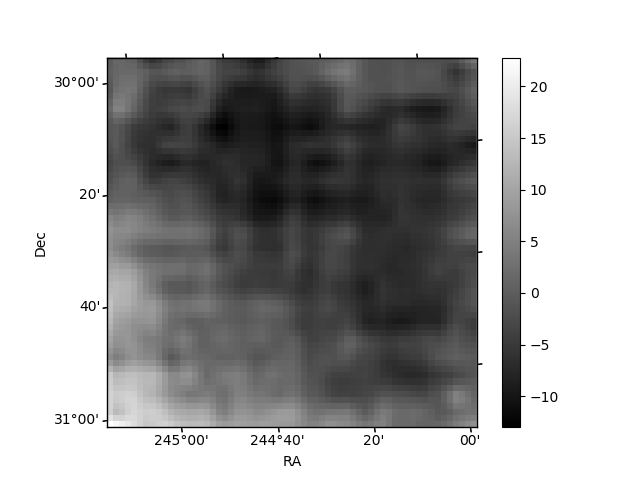
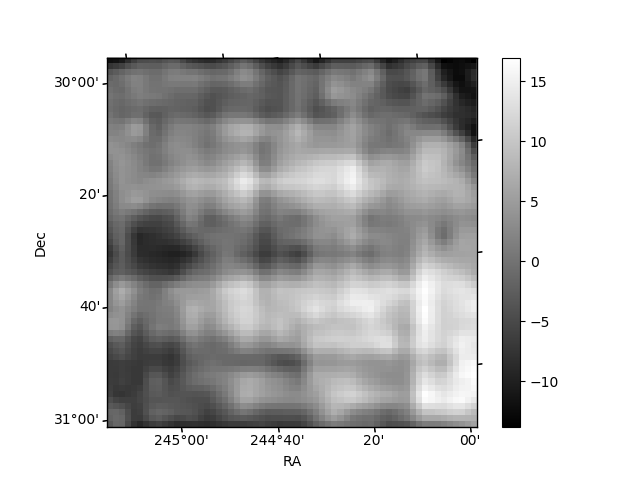
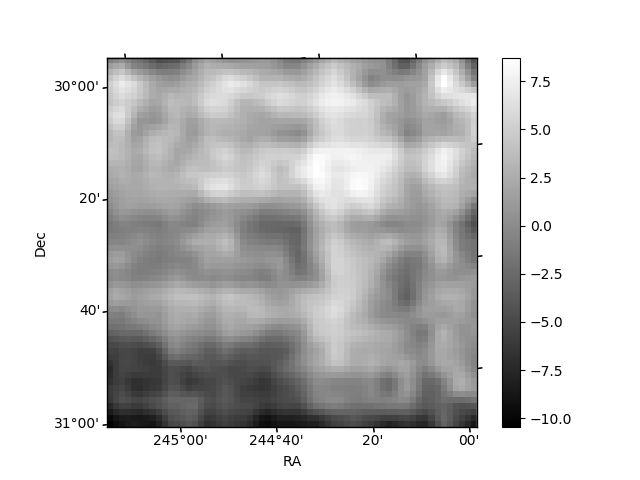
Histogram calculated using DETX and DETY for each event in the final _common_clean file
| Quadrant A | 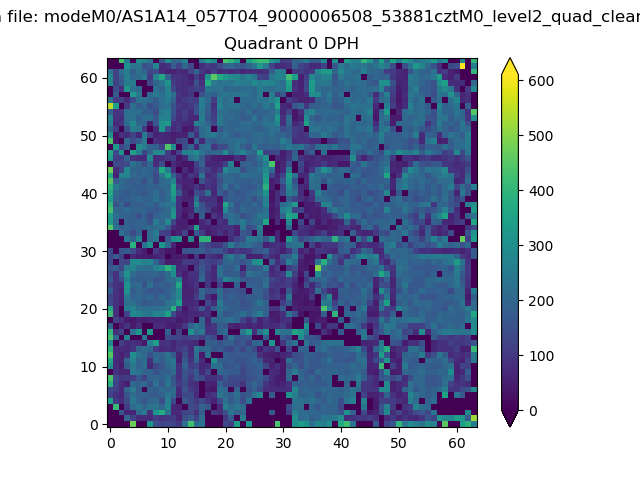 |
 |
Quadrant B |
|---|---|---|---|
| Quadrant D | 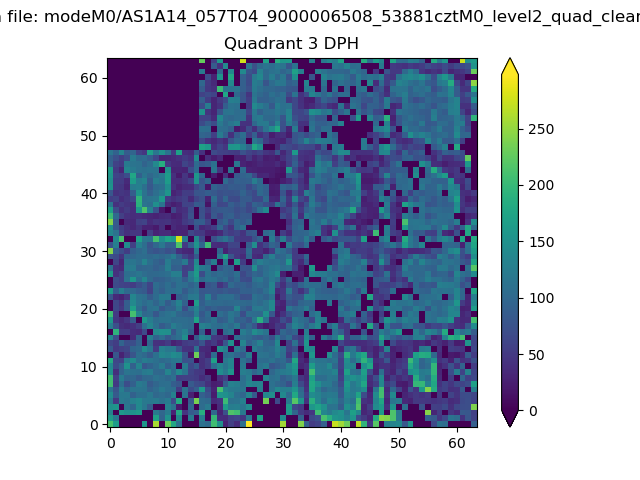 |
 |
Quadrant C |
| Plot type | Count rate plots | Images |
|---|---|---|
| Comparison with Poisson distribution Blue bars denote a histogram of data divided into 1 sec bins. Red curve is a Poisson curve with rate = median count rate of data. |
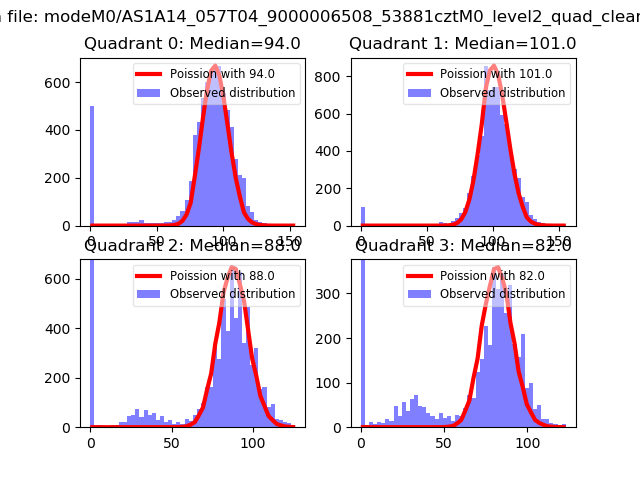 |
 |
| Quadrant-wise count rates Data is divided into 100 sec bins |
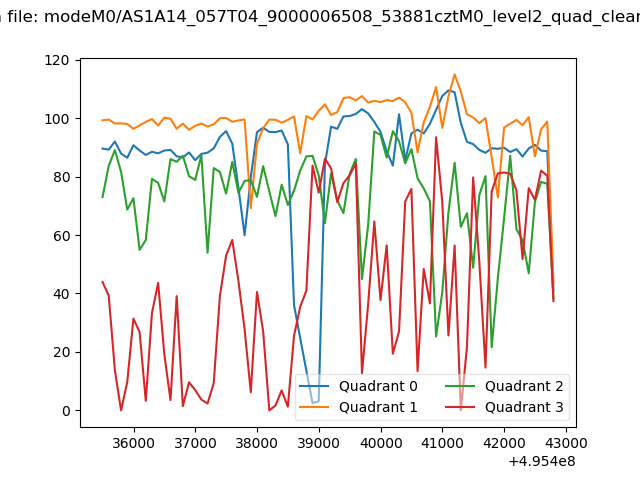 |
|
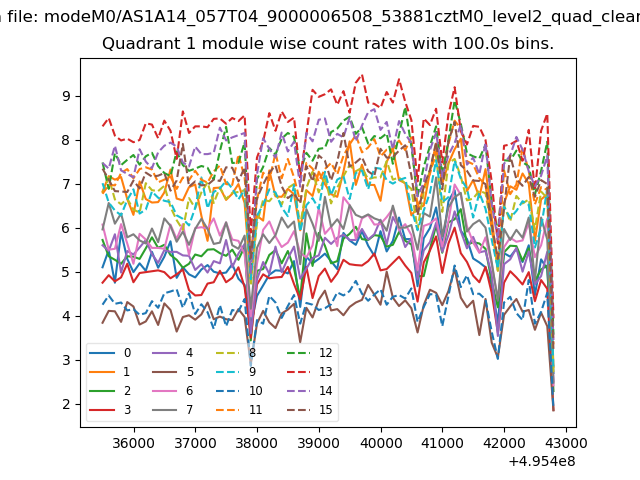
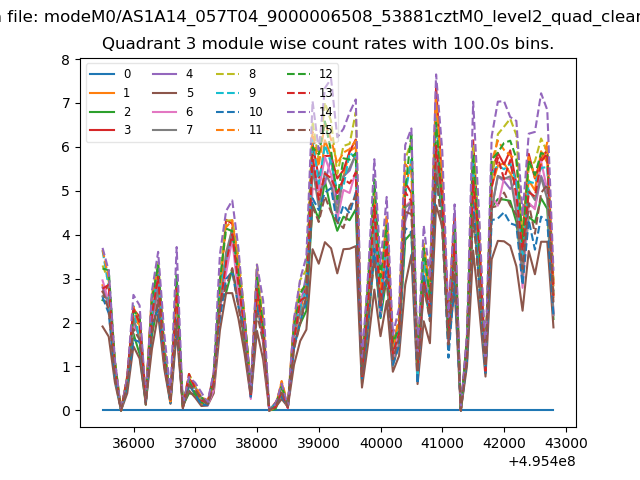
| Module-wise count rates for Quadrant A Data is divided into 100 sec bins |
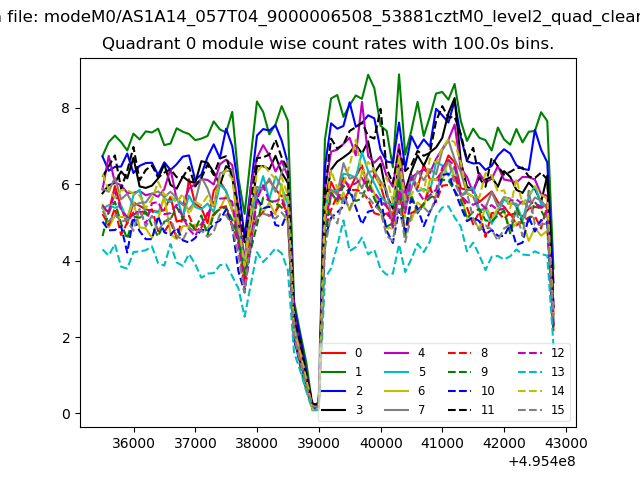 |
 |
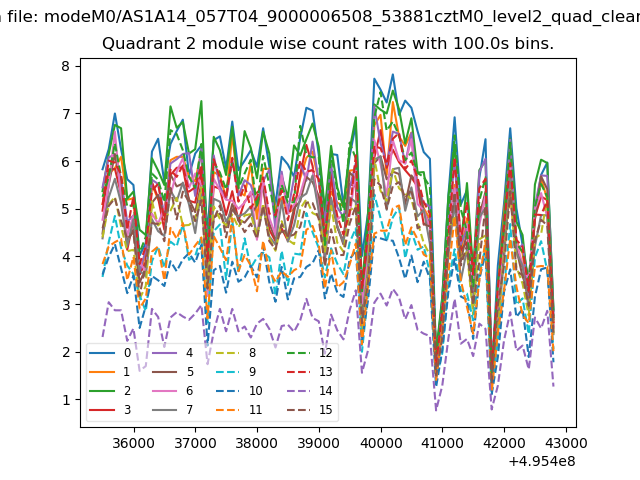
| Module-wise count rates for Quadrant B Data is divided into 100 sec bins |
 |
 |
| Module-wise count rates for Quadrant C Data is divided into 100 sec bins |
 |
 |
| Module-wise count rates for Quadrant D Data is divided into 100 sec bins |
 |
 |
| Parameter | Plot |
|---|---|
| CZT HV Monitor | 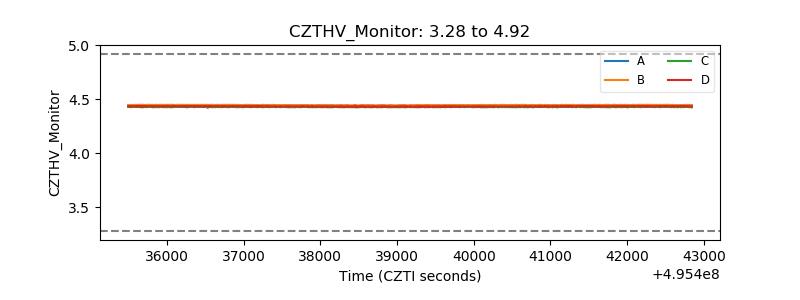 |
| D_VDD | 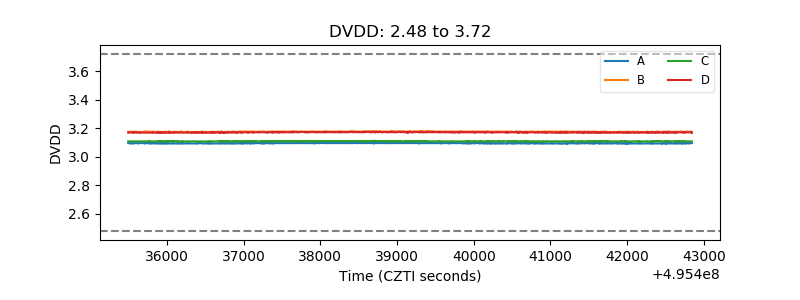 |
| Temperature 1 | 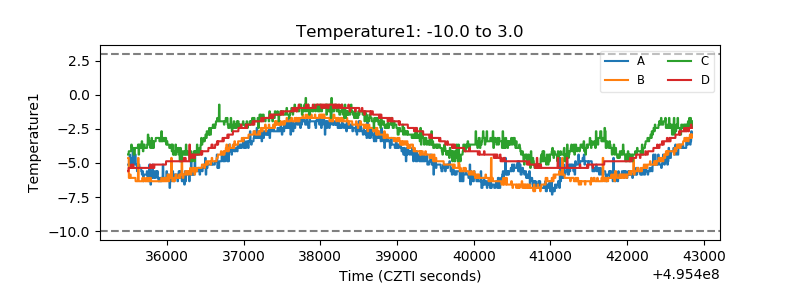 |
| Veto HV Monitor | 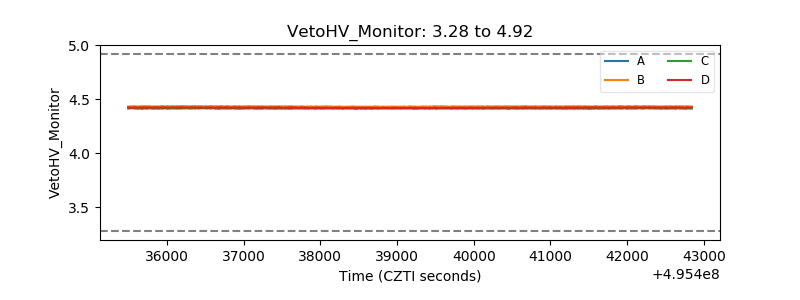 |
| Veto LLD | 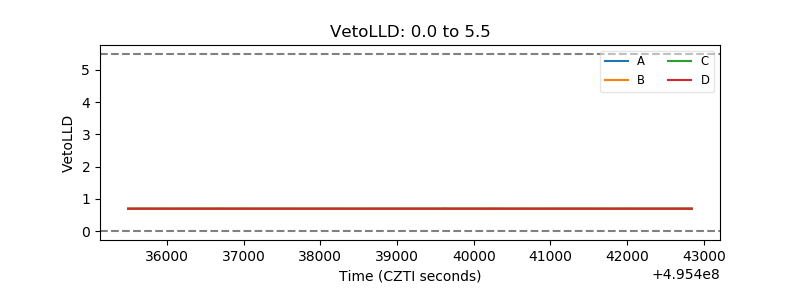 |
| Alpha Counter | 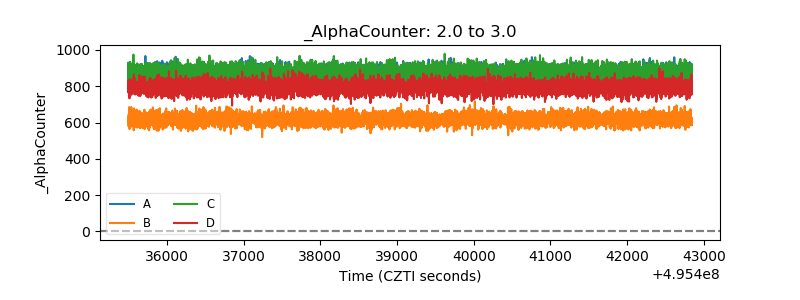 |
| _CPM_Rate | 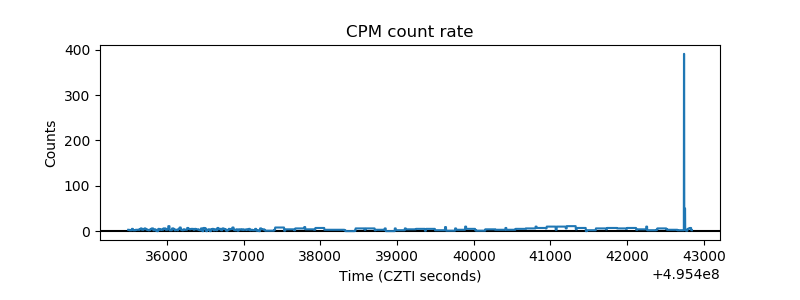 |
| CZT Counter | 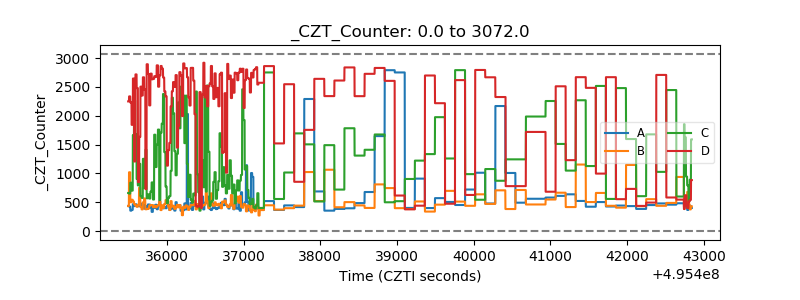 |
| +2.5 Volts monitor |  |
| +5 Volts monitor | 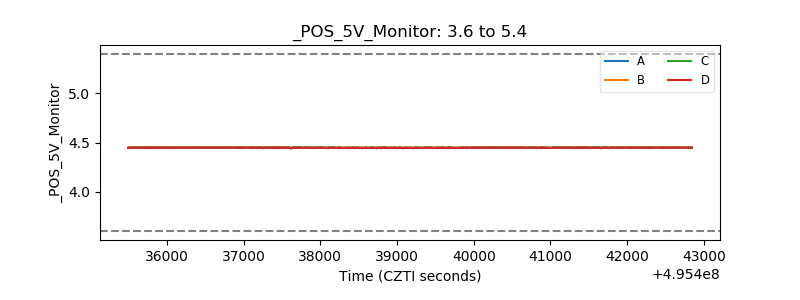 |
| _ROLL_ROT | 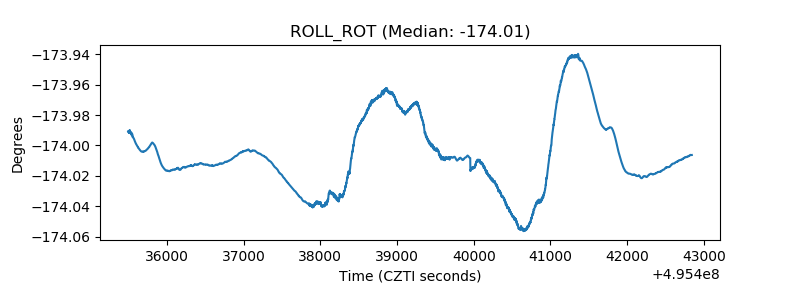 |
| _Roll_DEC | 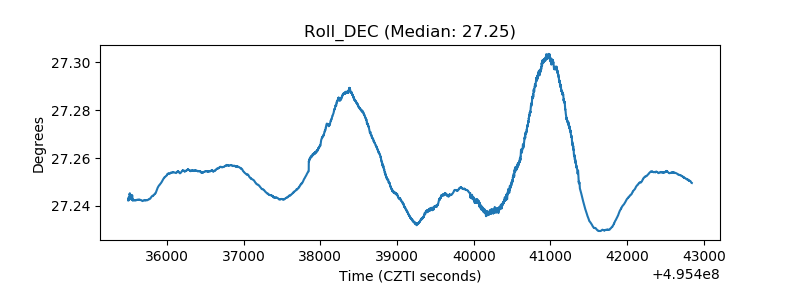 |
| _Roll_RA | 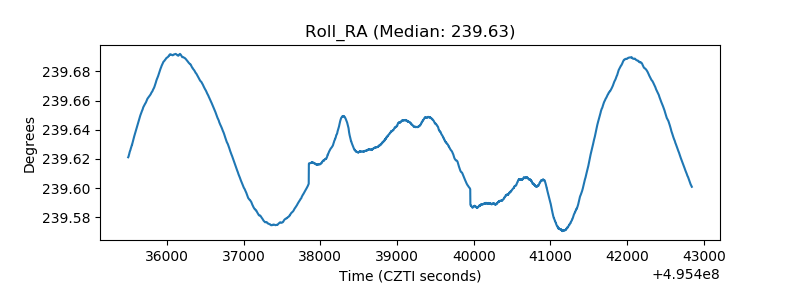 |
| Veto Counter | 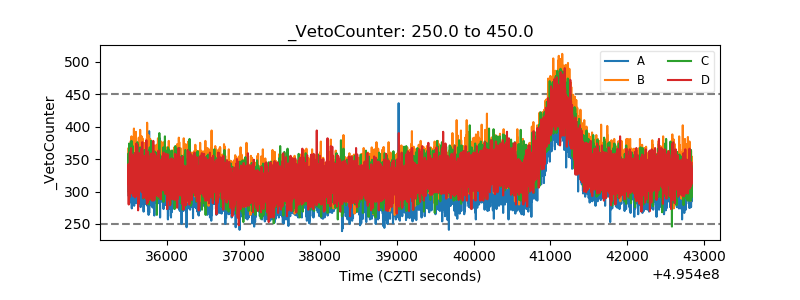 |