| Param | Original file | Final file |
|---|---|---|
| Filename | modeM0/AS1A14_057T04_9000006508_53886cztM0_level2.fits | modeM0/AS1A14_057T04_9000006508_53886cztM0_level2_quad_clean.evt |
| Size (bytes) | 2,052,498,240 | 221,299,200 |
| Size | 1.9 GB | 211.0 MB |
| Events in quadrant A | 12,065,391 | 1,563,006 |
| Events in quadrant B | 9,230,871 | 1,762,256 |
| Events in quadrant C | 20,615,235 | 1,326,306 |
| Events in quadrant D | 32,682,317 | 810,403 |
| Mode M0 | |||
|---|---|---|---|
| Quadrant | BADHDUFLAG | Total packets | Discarded packets |
| A | 0 | 48387 | 3 |
| B | 0 | 39894 | 3 |
| C | 0 | 73699 | 3 |
| D | 0 | 109458 | 3 |
| Mode SS | |||
|---|---|---|---|
| Quadrant | BADHDUFLAG | Total packets | Discarded packets |
| A | 0 | 368 | 0 |
| B | 0 | 368 | 0 |
| C | 0 | 368 | 0 |
| D | 0 | 368 | 0 |
| Mode M9 | |||
|---|---|---|---|
| Quadrant | BADHDUFLAG | Total packets | Discarded packets |
| A | 0 | 15 | 0 |
| B | 0 | 15 | 0 |
| C | 0 | 15 | 0 |
| D | 0 | 15 | 0 |
| Quadrant | Total seconds | Saturated seconds | Saturation percentage |
|---|---|---|---|
| A | 17936 | 1270 | 7.080731% |
| B | 17937 | 292 | 1.627920% |
| C | 17937 | 3479 | 19.395663% |
| D | 17937 | 8805 | 49.088476% |
Noise dominated data is calculated using 1-second bins in cleaned event files. If a bin has >2000 counts, and if more than 50% of those come from <1% of pixels, then it is considered to be noise-dominated and hence unusable.
| Quadrant | # 1 sec bins | Bins with >0 counts | Bins with >2000 counts | High rate bins dominated by noise | Noise dominated (total time) | Noise dominated (detector-on time) | Marked lightcurve |
|---|---|---|---|---|---|---|---|
| A | 19536 | 17940 | 939 | 939 | 4.81% | 5.23% | 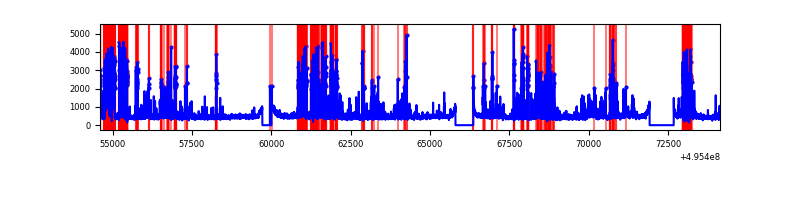 |
| B | 19537 | 17941 | 70 | 70 | 0.36% | 0.39% | 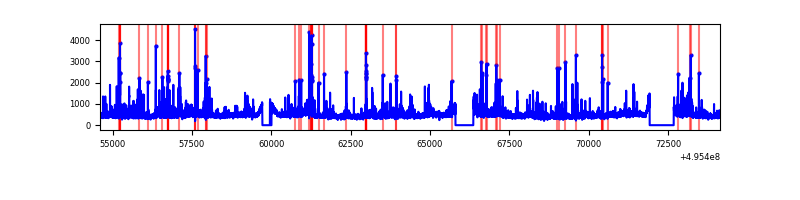 |
| C | 19537 | 17940 | 2762 | 2762 | 14.14% | 15.40% | 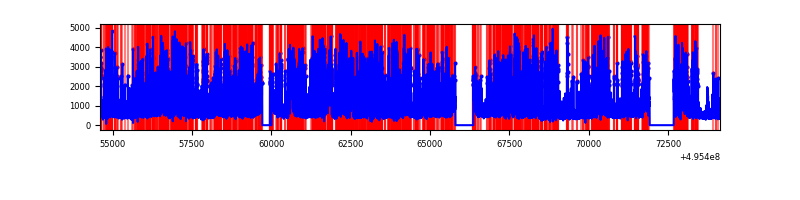 |
| D | 19537 | 17940 | 7754 | 7754 | 39.69% | 43.22% | 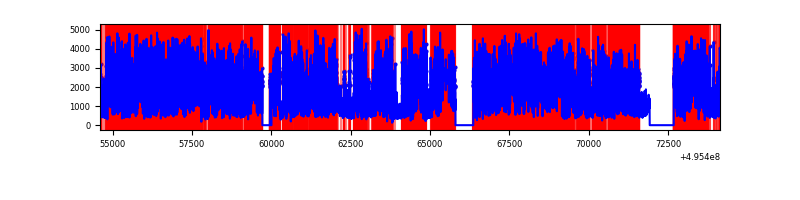 |
Top three noisy pixels from each quadrant. If the there are fewer than three noisy pixels in the level2.evt file, extra rows are filled as -1
| Pixel properties | Quadrant properties | ||||||
|---|---|---|---|---|---|---|---|
| Quadrant | DetID | PixID | Counts | Sigma | Mean | Median | Sigma |
| A | 15 | 174 | 3369880 | 7143.5 | 1897 | 1852 | 471.5 |
| A | 4 | 249 | 543766 | 1149.39 | 1897 | 1852 | 471.5 |
| A | 0 | 8 | 256664 | 540.45 | 1897 | 1852 | 471.5 |
| B | 0 | 213 | 293730 | 713.66 | 1922 | 1852 | 409.0 |
| B | 7 | 0 | 259968 | 631.11 | 1922 | 1852 | 409.0 |
| B | 0 | 171 | 234564 | 569.0 | 1922 | 1852 | 409.0 |
| C | 15 | 224 | 10563041 | 21858.18 | 1747 | 1733 | 483.2 |
| C | 1 | 241 | 855642 | 1767.29 | 1747 | 1733 | 483.2 |
| C | 12 | 2 | 655495 | 1353.06 | 1747 | 1733 | 483.2 |
| D | 8 | 176 | 21256274 | 51052.13 | 1433 | 1368 | 416.3 |
| D | 6 | 239 | 2900396 | 6963.17 | 1433 | 1368 | 416.3 |
| D | 13 | 153 | 457501 | 1095.59 | 1433 | 1368 | 416.3 |
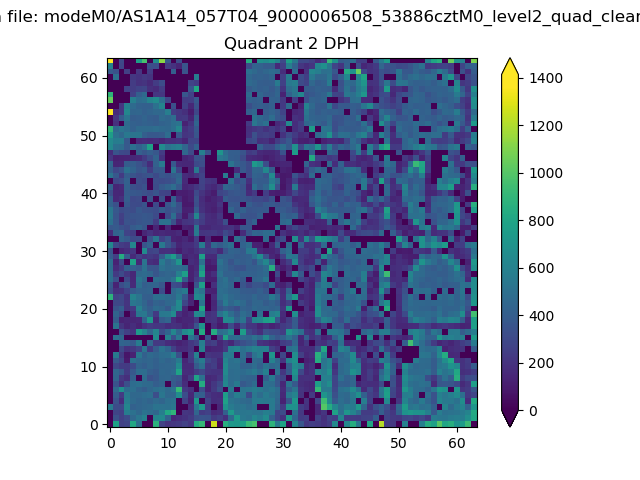
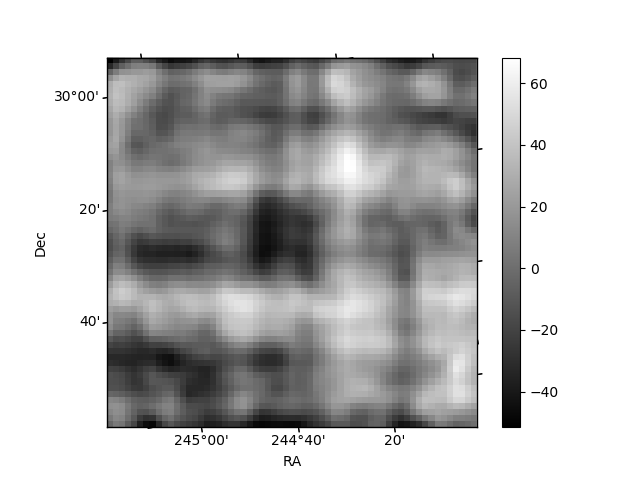
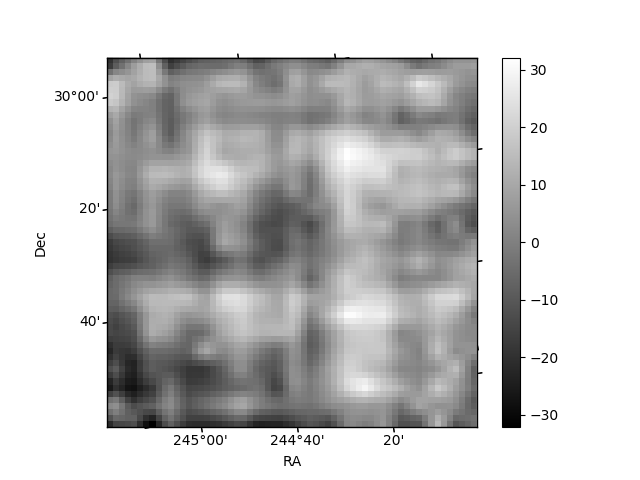
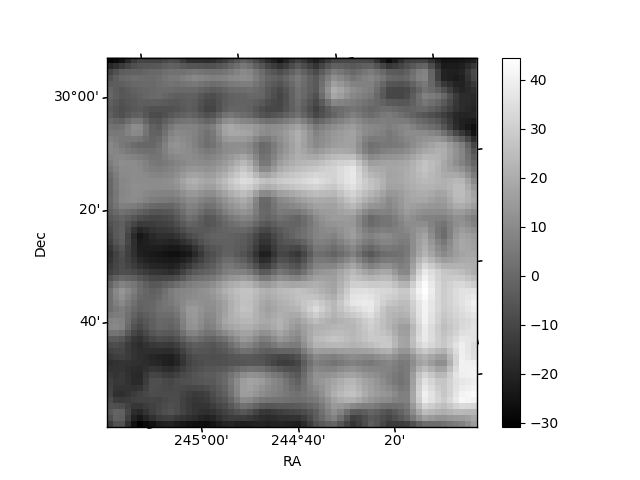
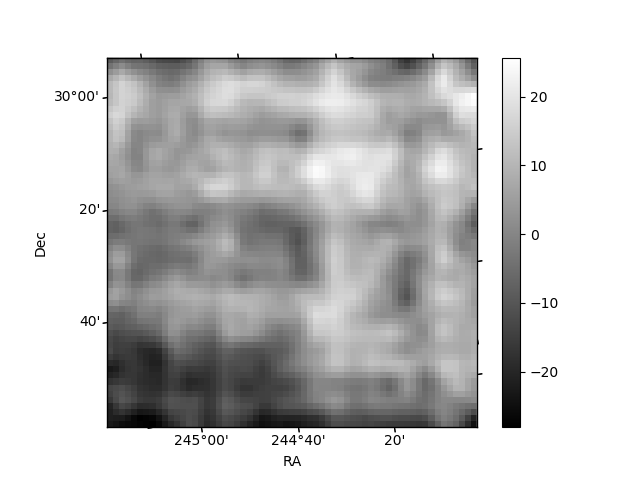
Histogram calculated using DETX and DETY for each event in the final _common_clean file
| Quadrant A | 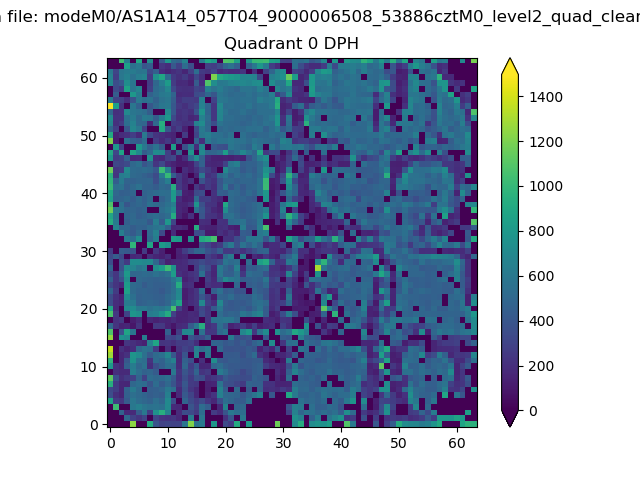 |
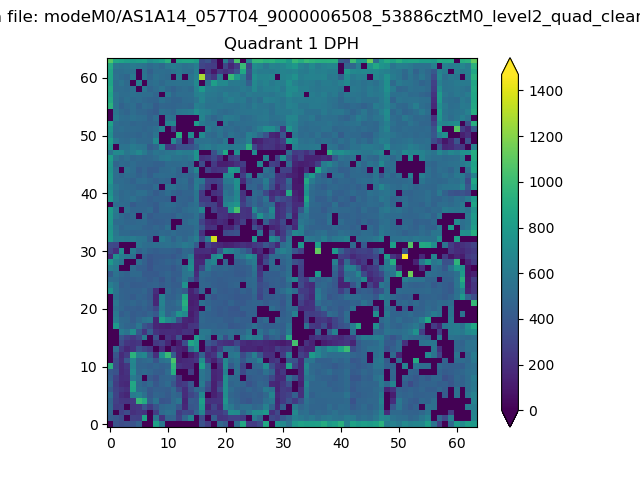 |
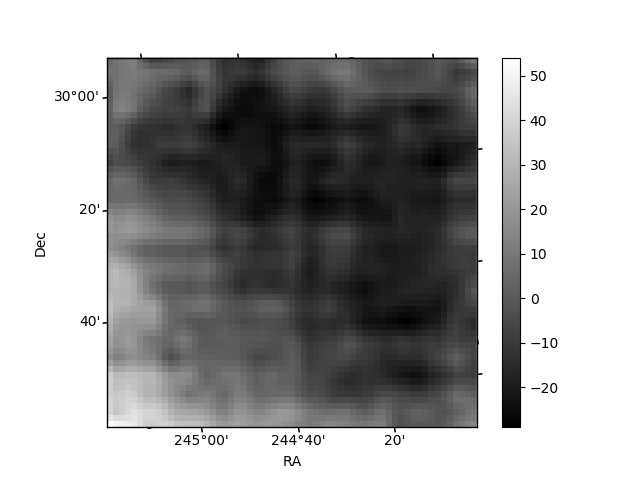
Quadrant B |
|---|---|---|---|
| Quadrant D | 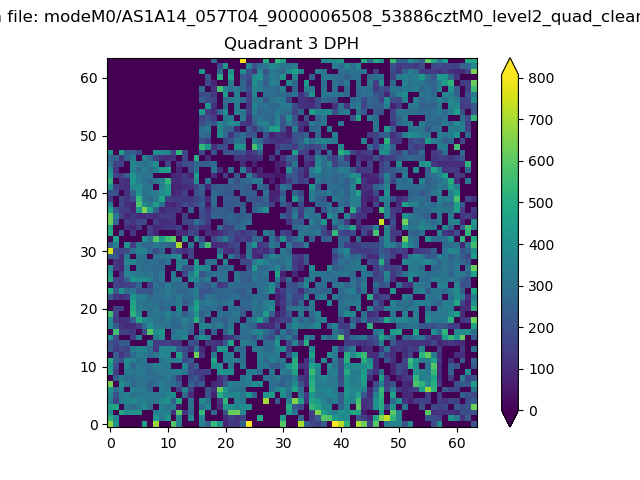 |
 |
Quadrant C |
| Plot type | Count rate plots | Images |
|---|---|---|
| Comparison with Poisson distribution Blue bars denote a histogram of data divided into 1 sec bins. Red curve is a Poisson curve with rate = median count rate of data. |
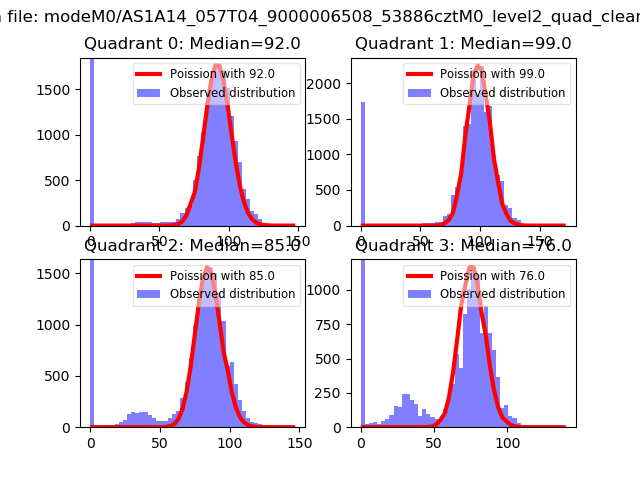 |
 |
| Quadrant-wise count rates Data is divided into 100 sec bins |
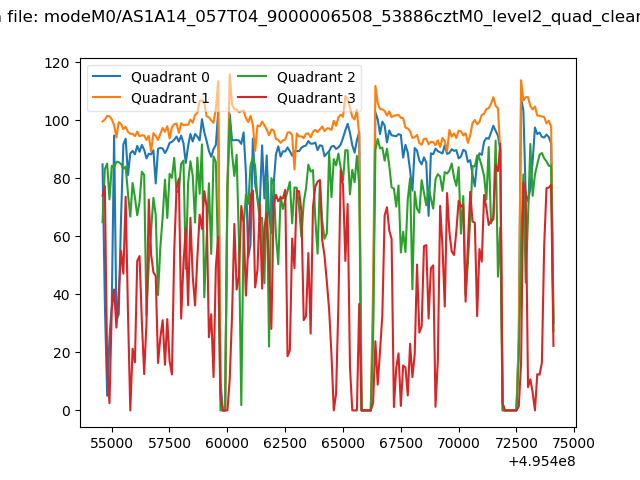 |
|
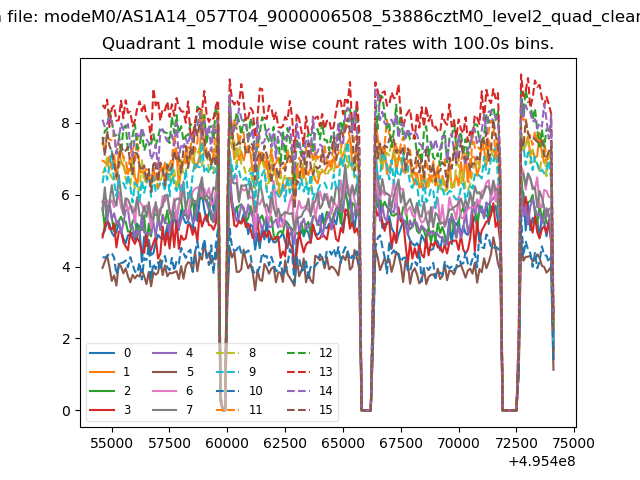
| Module-wise count rates for Quadrant A Data is divided into 100 sec bins |
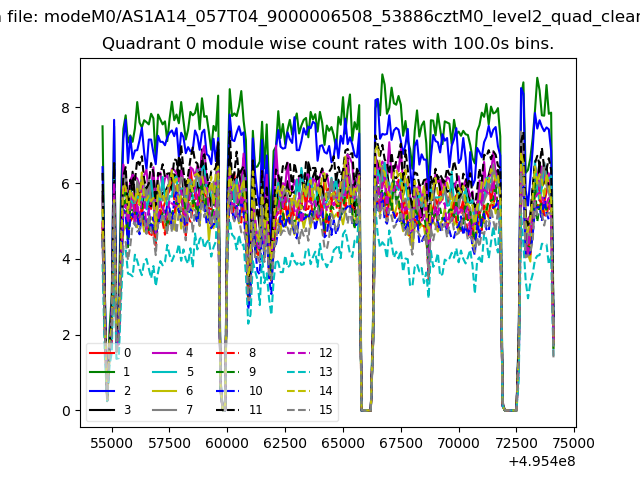 |
 |
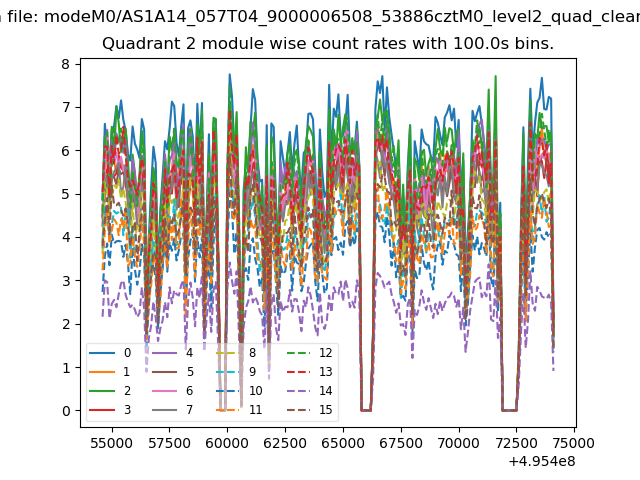
| Module-wise count rates for Quadrant B Data is divided into 100 sec bins |
 |
 |
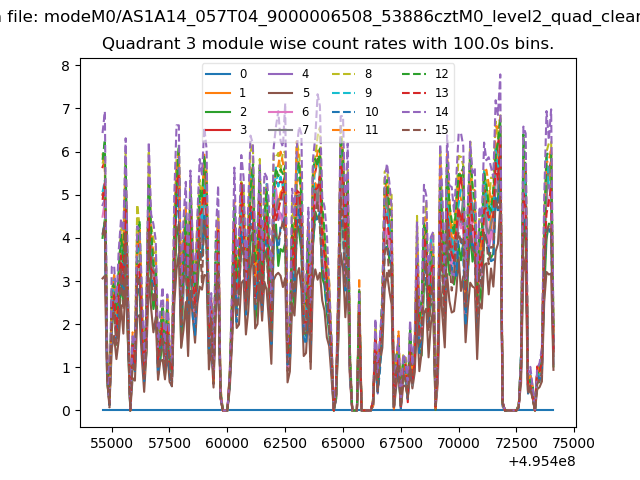
| Module-wise count rates for Quadrant C Data is divided into 100 sec bins |
 |
 |
| Module-wise count rates for Quadrant D Data is divided into 100 sec bins |
 |
 |
| Parameter | Plot |
|---|---|
| CZT HV Monitor | 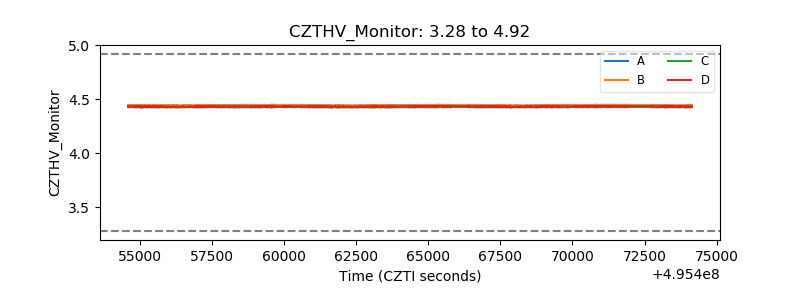 |
| D_VDD | 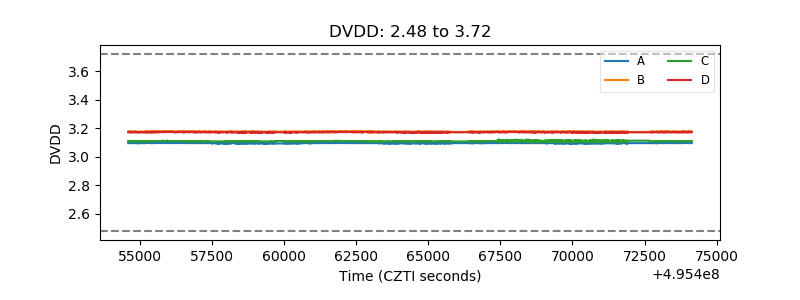 |
| Temperature 1 | 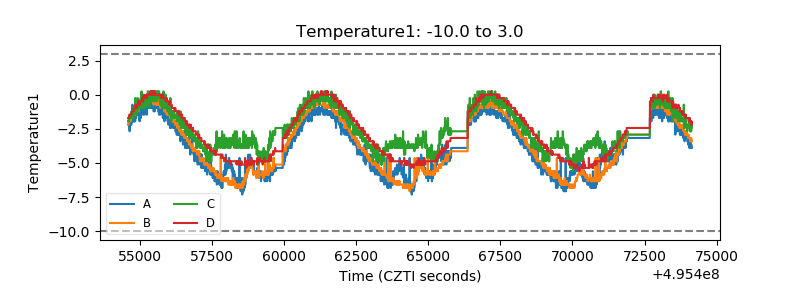 |
| Veto HV Monitor | 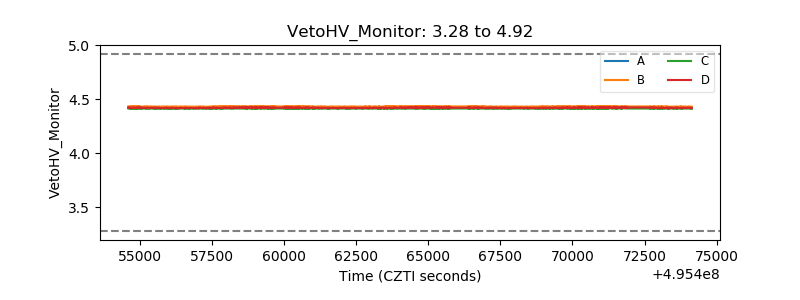 |
| Veto LLD | 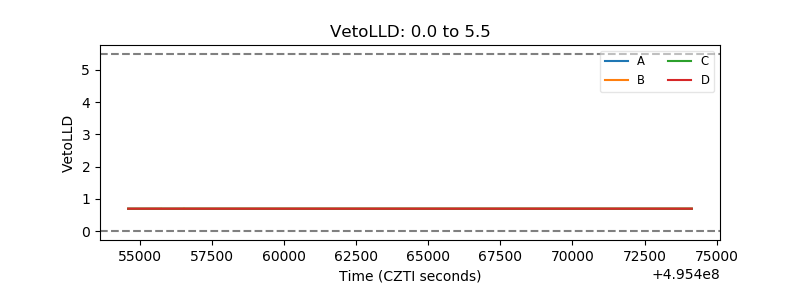 |
| Alpha Counter |  |
| _CPM_Rate | 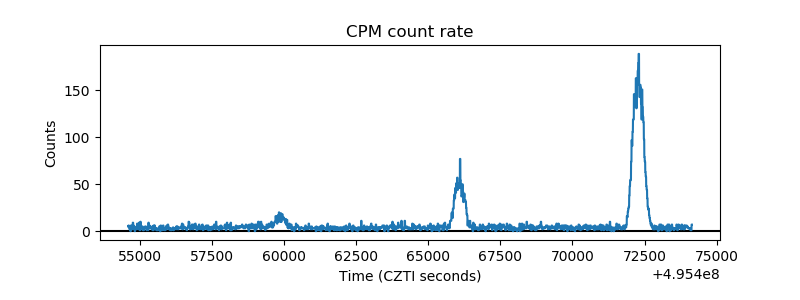 |
| CZT Counter | 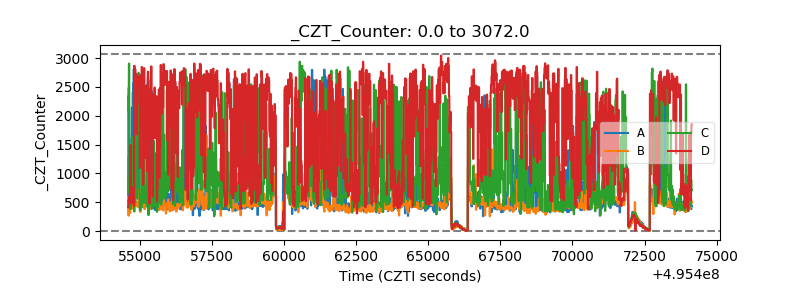 |
| +2.5 Volts monitor |  |
| +5 Volts monitor |  |
| _ROLL_ROT | 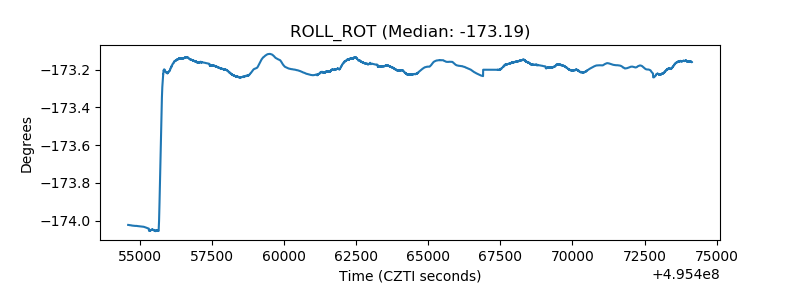 |
| _Roll_DEC | 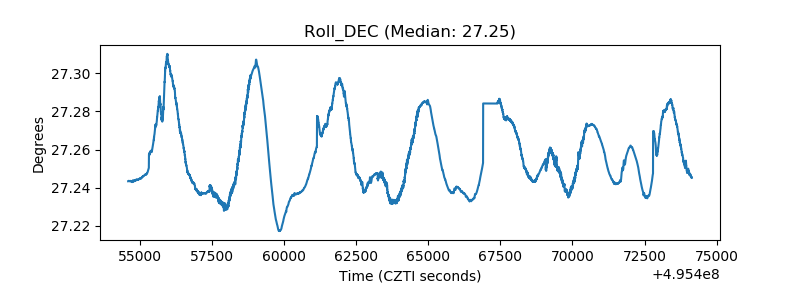 |
| _Roll_RA | 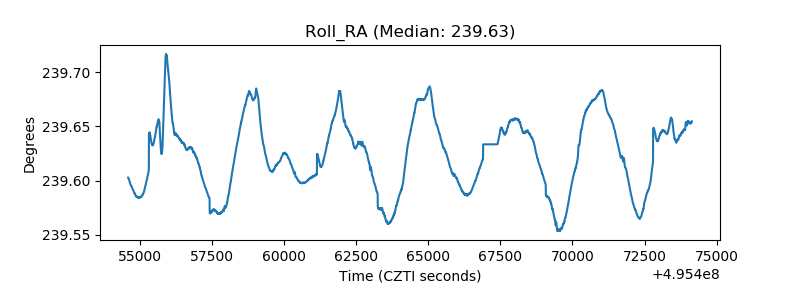 |
| Veto Counter | 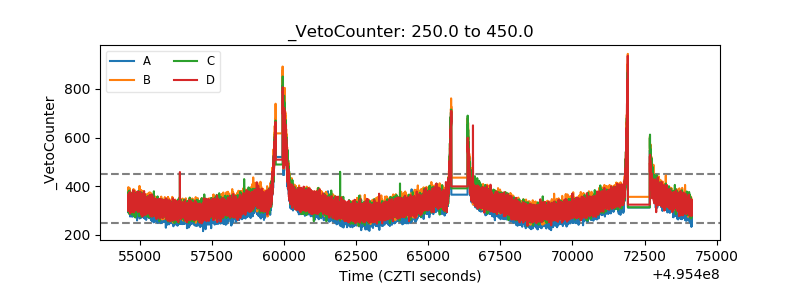 |