| Param | Original file | Final file |
|---|---|---|
| Filename | modeM0/AS1A14_057T04_9000006508_53889cztM0_level2.fits | modeM0/AS1A14_057T04_9000006508_53889cztM0_level2_quad_clean.evt |
| Size (bytes) | 851,739,840 | 78,655,680 |
| Size | 812.3 MB | 75.0 MB |
| Events in quadrant A | 4,943,957 | 602,618 |
| Events in quadrant B | 3,644,897 | 675,002 |
| Events in quadrant C | 8,628,134 | 448,452 |
| Events in quadrant D | 13,809,139 | 202,067 |
| Mode M0 | |||
|---|---|---|---|
| Quadrant | BADHDUFLAG | Total packets | Discarded packets |
| A | 0 | 19307 | 2 |
| B | 0 | 15249 | 2 |
| C | 0 | 30124 | 2 |
| D | 0 | 45536 | 7 |
| Mode SS | |||
|---|---|---|---|
| Quadrant | BADHDUFLAG | Total packets | Discarded packets |
| A | 0 | 132 | 0 |
| B | 0 | 132 | 0 |
| C | 0 | 132 | 0 |
| D | 0 | 132 | 0 |
| Mode M9 | |||
|---|---|---|---|
| Quadrant | BADHDUFLAG | Total packets | Discarded packets |
| A | 0 | 11 | 0 |
| B | 0 | 11 | 0 |
| C | 0 | 11 | 0 |
| D | 0 | 11 | 0 |
| Quadrant | Total seconds | Saturated seconds | Saturation percentage |
|---|---|---|---|
| A | 6494 | 476 | 7.329843% |
| B | 6495 | 82 | 1.262510% |
| C | 6495 | 1916 | 29.499615% |
| D | 6494 | 4437 | 68.324607% |
Noise dominated data is calculated using 1-second bins in cleaned event files. If a bin has >2000 counts, and if more than 50% of those come from <1% of pixels, then it is considered to be noise-dominated and hence unusable.
| Quadrant | # 1 sec bins | Bins with >0 counts | Bins with >2000 counts | High rate bins dominated by noise | Noise dominated (total time) | Noise dominated (detector-on time) | Marked lightcurve |
|---|---|---|---|---|---|---|---|
| A | 7559 | 6495 | 459 | 459 | 6.07% | 7.07% | 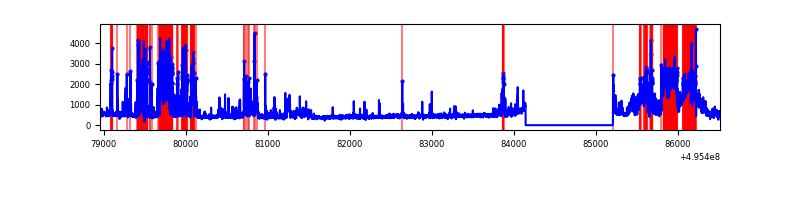 |
| B | 7560 | 6496 | 23 | 23 | 0.30% | 0.35% | 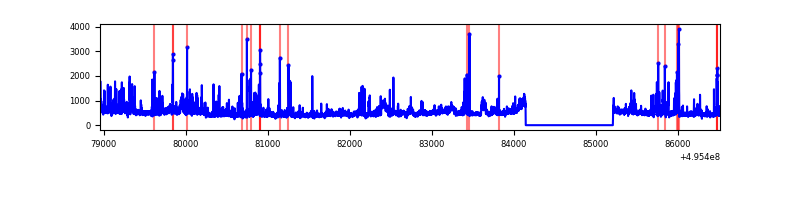 |
| C | 7560 | 6495 | 1503 | 1503 | 19.88% | 23.14% | 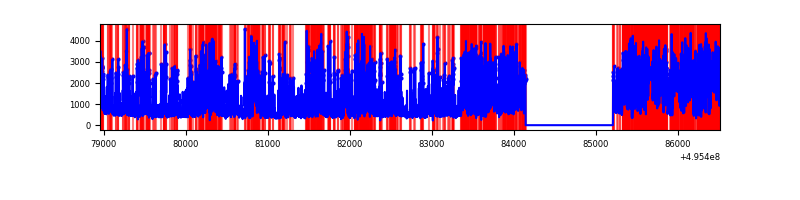 |
| D | 7558 | 6493 | 4012 | 4012 | 53.08% | 61.79% | 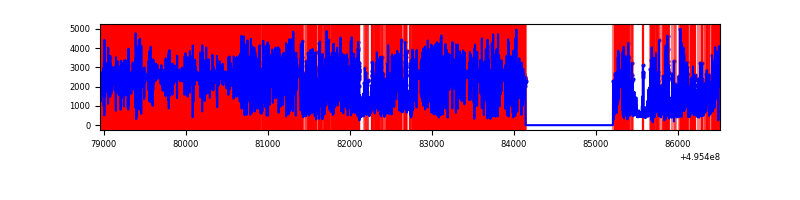 |
Top three noisy pixels from each quadrant. If the there are fewer than three noisy pixels in the level2.evt file, extra rows are filled as -1
| Pixel properties | Quadrant properties | ||||||
|---|---|---|---|---|---|---|---|
| Quadrant | DetID | PixID | Counts | Sigma | Mean | Median | Sigma |
| A | 12 | 115 | 1049711 | 6122.22 | 691 | 674 | 171.3 |
| A | 15 | 174 | 834317 | 4865.17 | 691 | 674 | 171.3 |
| A | 4 | 249 | 119765 | 695.02 | 691 | 674 | 171.3 |
| B | 5 | 250 | 213215 | 1430.04 | 701 | 676 | 148.6 |
| B | 5 | 185 | 154835 | 1037.24 | 701 | 676 | 148.6 |
| B | 10 | 247 | 101691 | 679.67 | 701 | 676 | 148.6 |
| C | 15 | 224 | 4222744 | 25895.29 | 592 | 589 | 163.0 |
| C | 15 | 209 | 1448159 | 8878.22 | 592 | 589 | 163.0 |
| C | 4 | 5 | 144081 | 880.06 | 592 | 589 | 163.0 |
| D | 8 | 176 | 11140079 | 101134.21 | 379 | 363 | 110.1 |
| D | 6 | 239 | 273689 | 2481.45 | 379 | 363 | 110.1 |
| D | 13 | 153 | 171879 | 1557.14 | 379 | 363 | 110.1 |
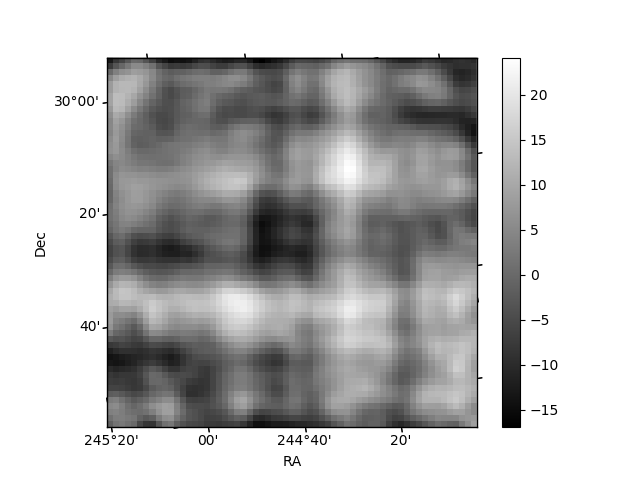
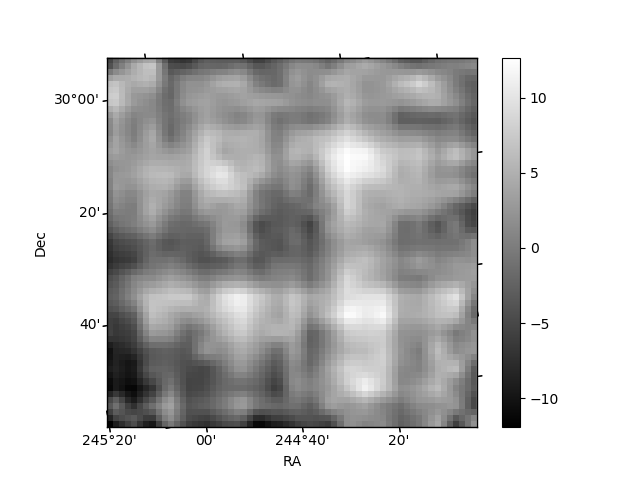
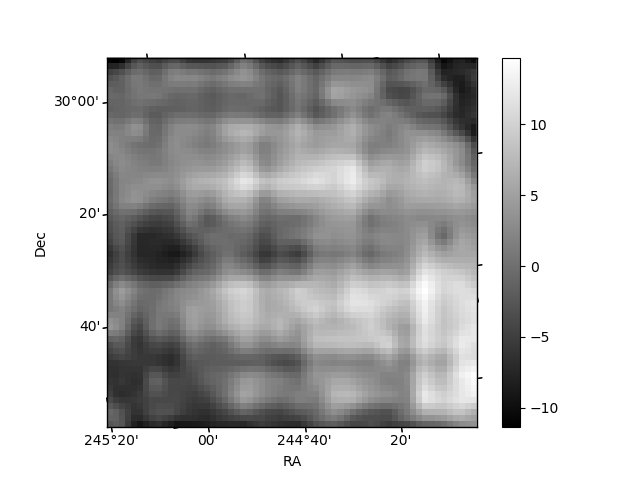
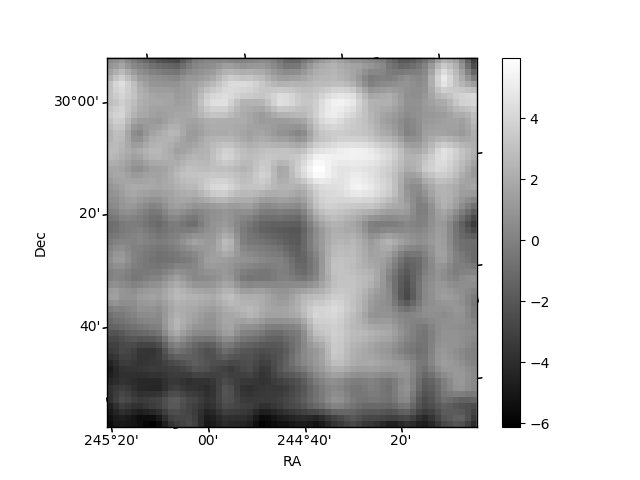
Histogram calculated using DETX and DETY for each event in the final _common_clean file
| Quadrant A | 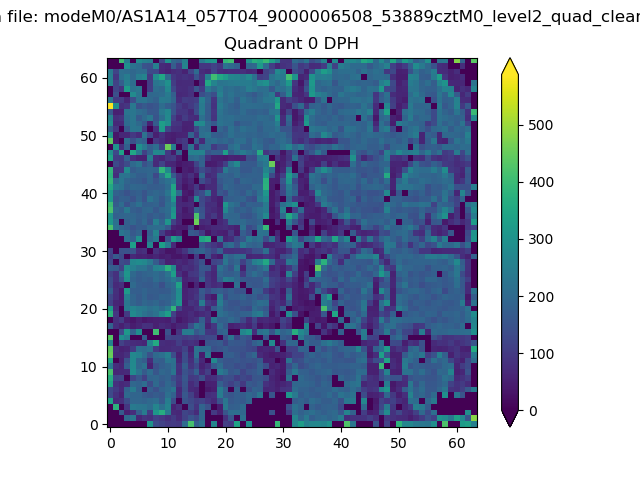 |
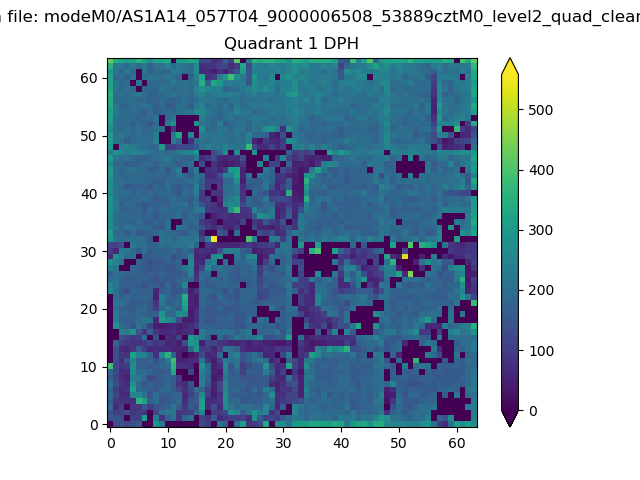 |
Quadrant B |
|---|---|---|---|
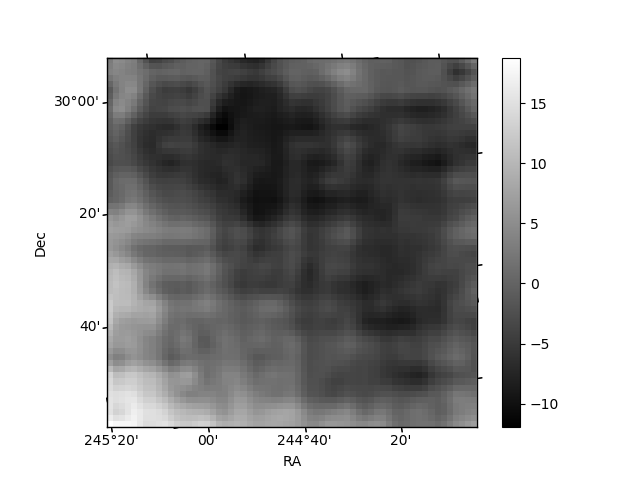
| Quadrant D | 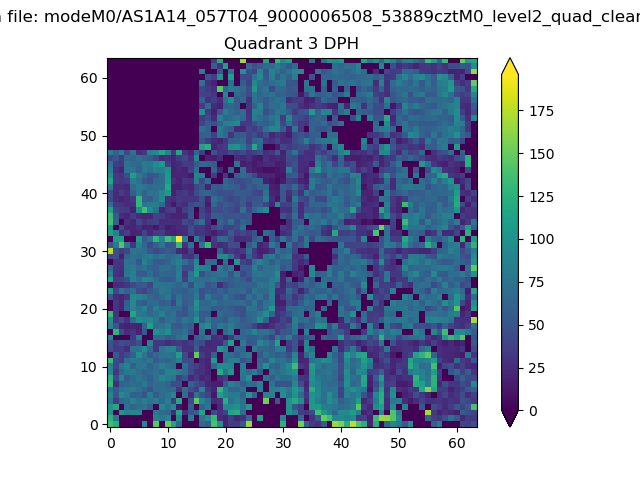 |
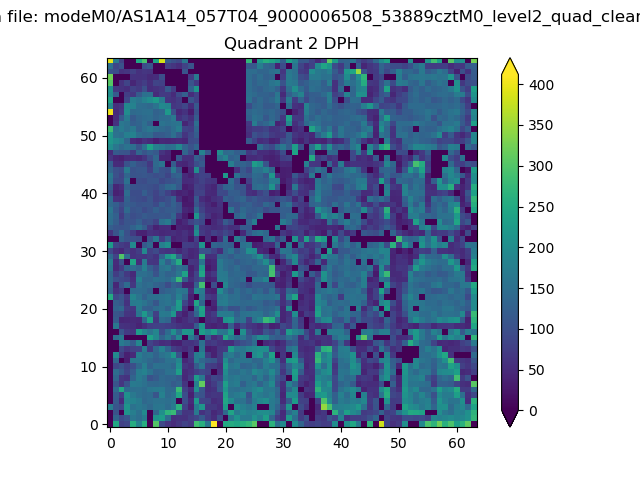 |
Quadrant C |
| Plot type | Count rate plots | Images |
|---|---|---|
| Comparison with Poisson distribution Blue bars denote a histogram of data divided into 1 sec bins. Red curve is a Poisson curve with rate = median count rate of data. |
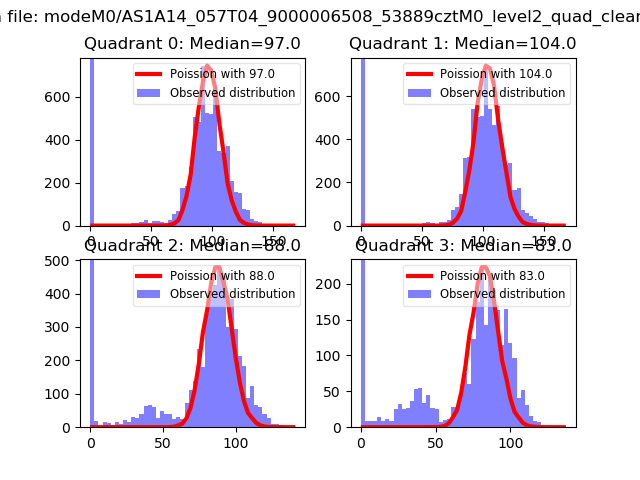 |
 |
| Quadrant-wise count rates Data is divided into 100 sec bins |
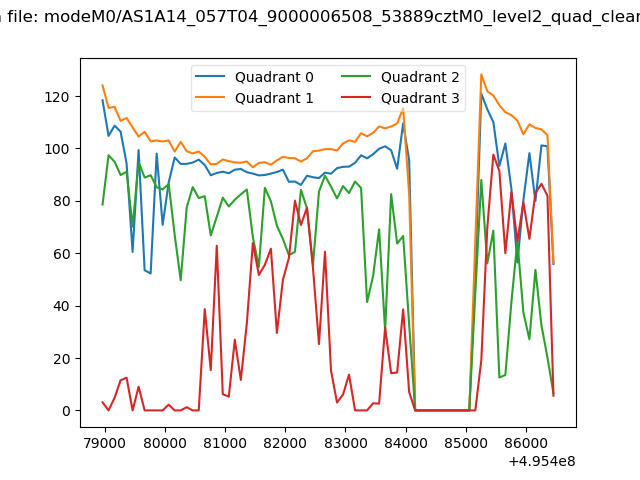 |
|
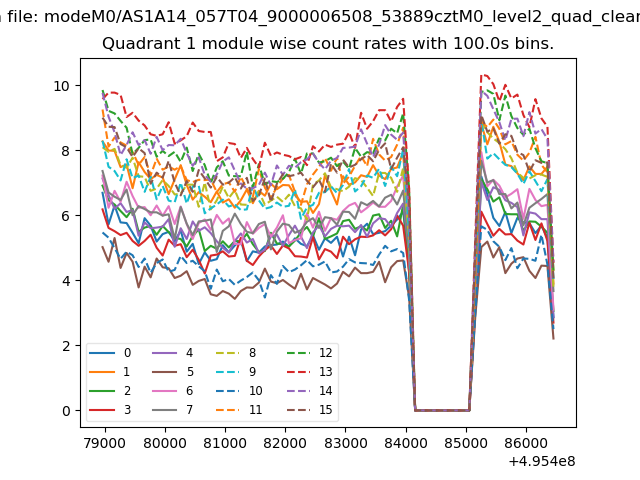
| Module-wise count rates for Quadrant A Data is divided into 100 sec bins |
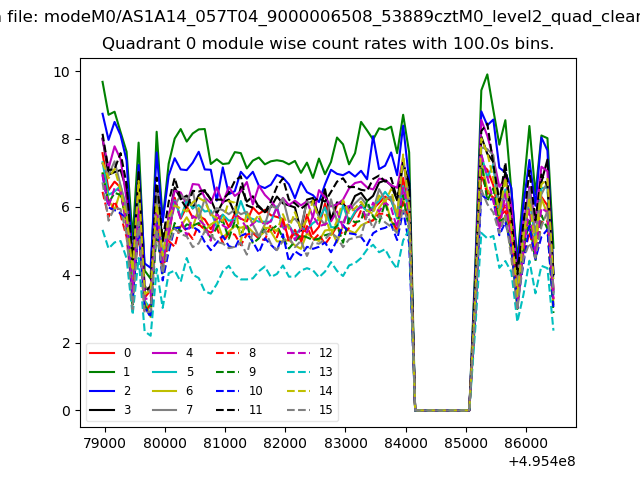 |
 |
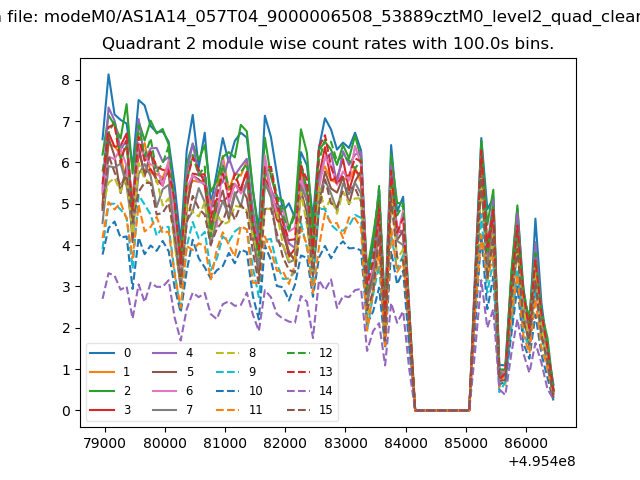
| Module-wise count rates for Quadrant B Data is divided into 100 sec bins |
 |
 |
| Module-wise count rates for Quadrant C Data is divided into 100 sec bins |
 |
 |
| Module-wise count rates for Quadrant D Data is divided into 100 sec bins |
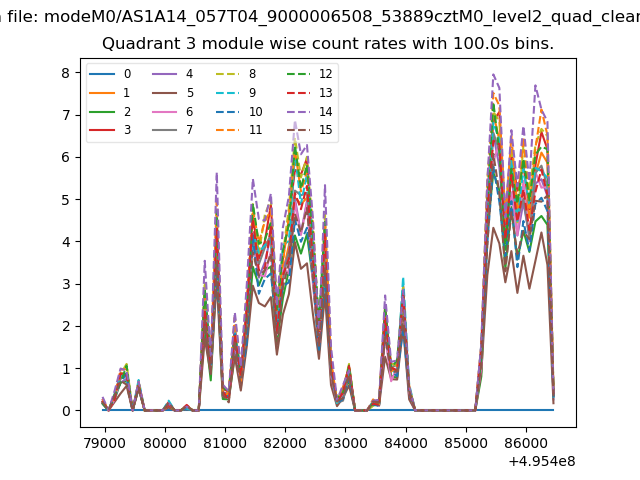 |
 |
| Parameter | Plot |
|---|---|
| CZT HV Monitor | 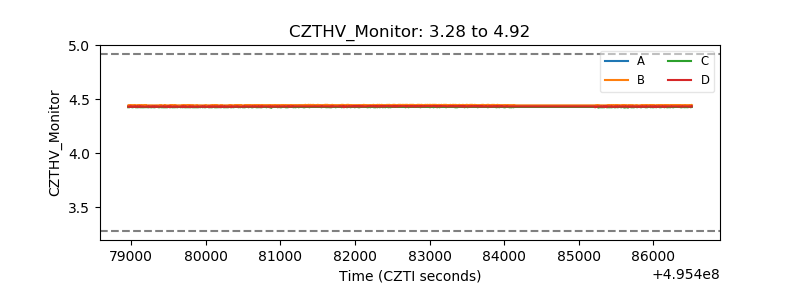 |
| D_VDD | 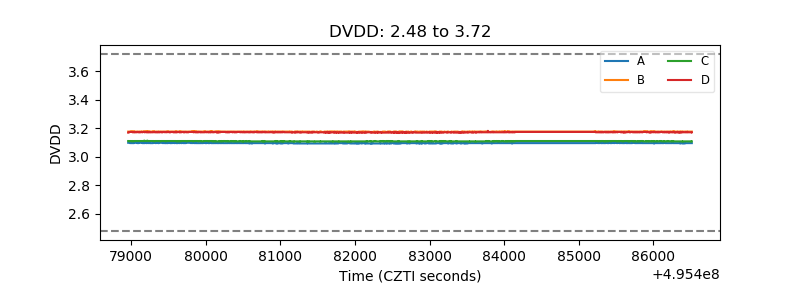 |
| Temperature 1 | 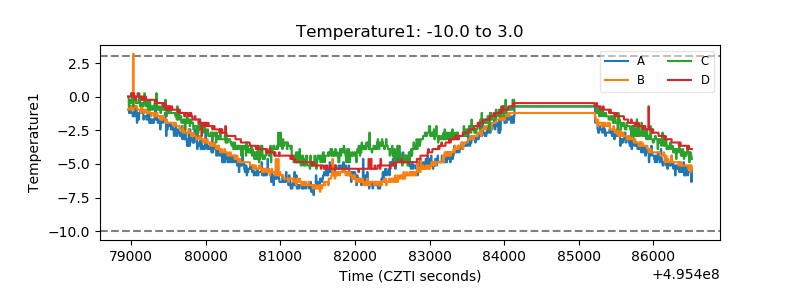 |
| Veto HV Monitor |  |
| Veto LLD | 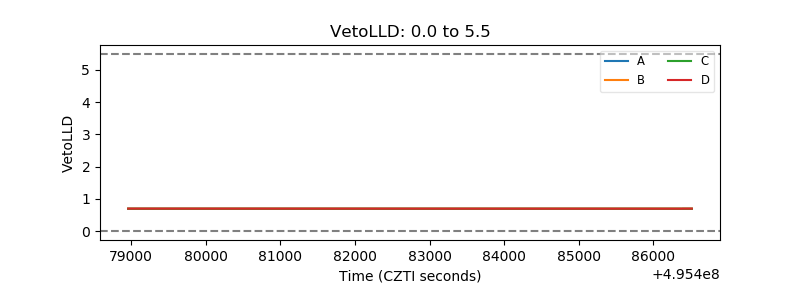 |
| Alpha Counter | 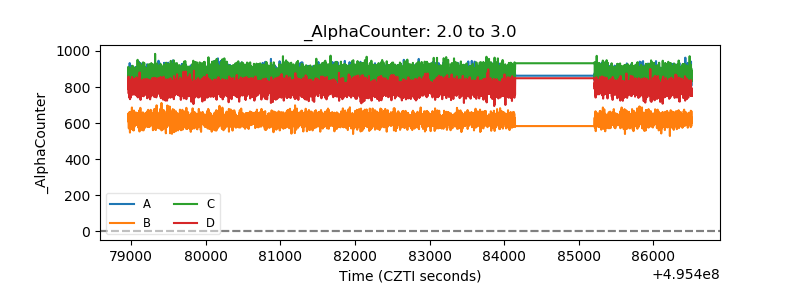 |
| _CPM_Rate | 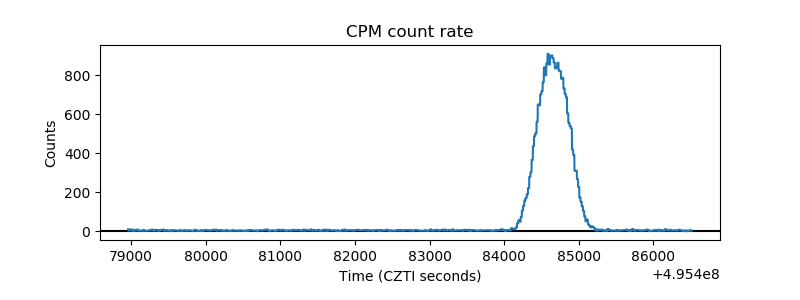 |
| CZT Counter | 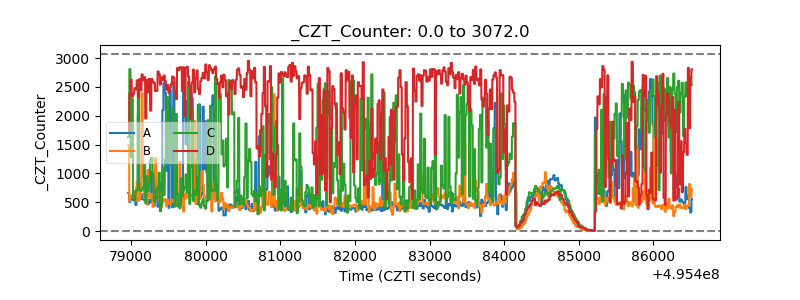 |
| +2.5 Volts monitor | 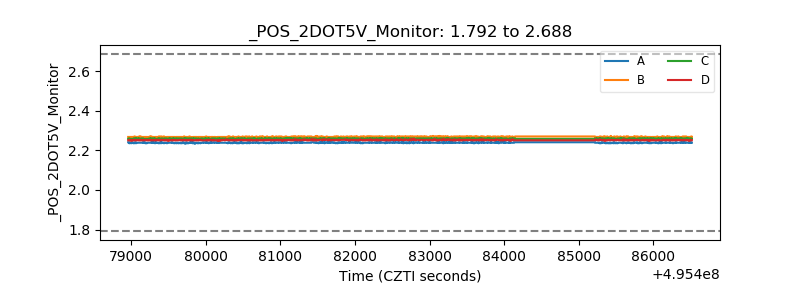 |
| +5 Volts monitor | 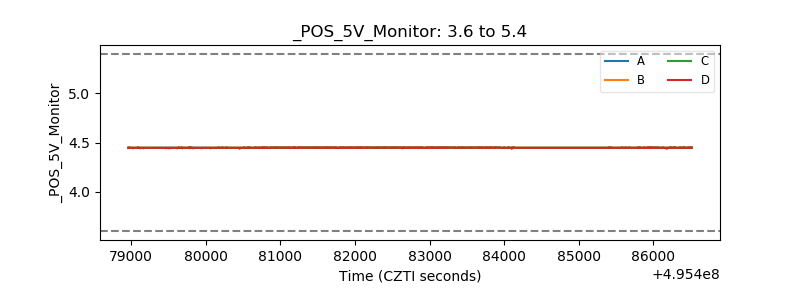 |
| _ROLL_ROT | 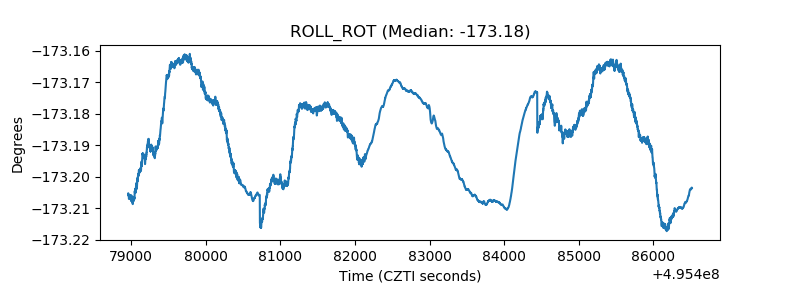 |
| _Roll_DEC | 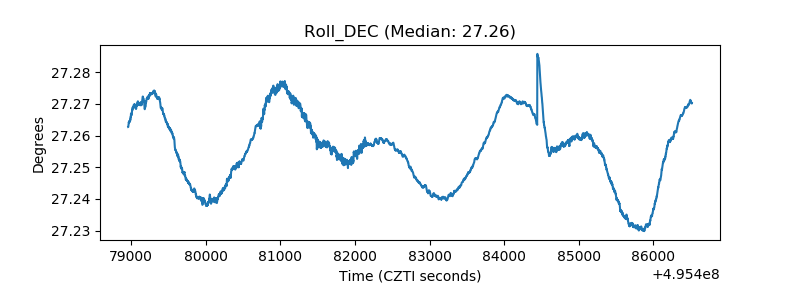 |
| _Roll_RA | 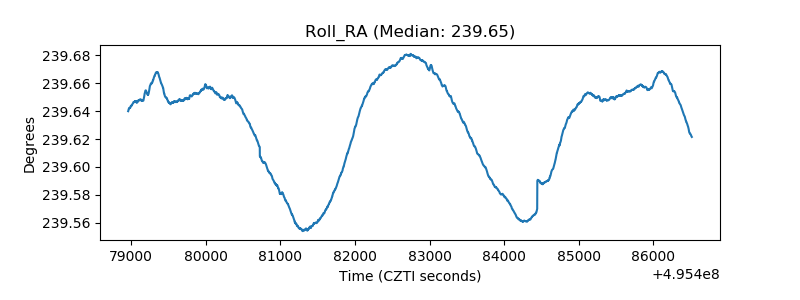 |
| Veto Counter | 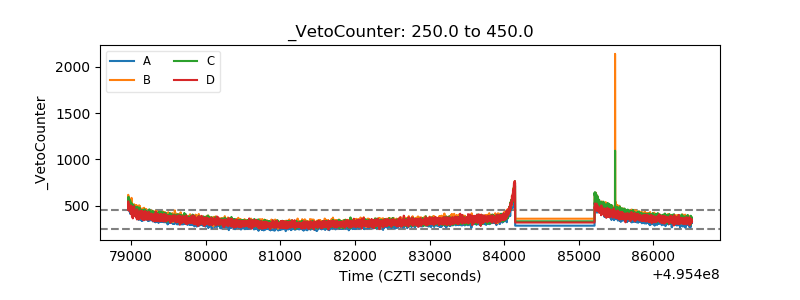 |