| Param | Original file | Final file |
|---|---|---|
| Filename | modeM0/AS1A14_057T04_9000006508_53890cztM0_level2.fits | modeM0/AS1A14_057T04_9000006508_53890cztM0_level2_quad_clean.evt |
| Size (bytes) | 686,678,400 | 82,814,400 |
| Size | 654.9 MB | 79.0 MB |
| Events in quadrant A | 4,839,383 | 598,971 |
| Events in quadrant B | 3,239,001 | 656,662 |
| Events in quadrant C | 8,789,372 | 424,470 |
| Events in quadrant D | 8,072,471 | 396,367 |
| Mode M0 | |||
|---|---|---|---|
| Quadrant | BADHDUFLAG | Total packets | Discarded packets |
| A | 0 | 18801 | 1 |
| B | 0 | 13889 | 1 |
| C | 0 | 30440 | 2 |
| D | 0 | 28234 | 1 |
| Mode SS | |||
|---|---|---|---|
| Quadrant | BADHDUFLAG | Total packets | Discarded packets |
| A | 0 | 124 | 0 |
| B | 0 | 124 | 0 |
| C | 0 | 124 | 0 |
| D | 0 | 124 | 0 |
| Mode M9 | |||
|---|---|---|---|
| Quadrant | BADHDUFLAG | Total packets | Discarded packets |
| A | 0 | 12 | 0 |
| B | 0 | 12 | 0 |
| C | 0 | 12 | 0 |
| D | 0 | 12 | 0 |
| Quadrant | Total seconds | Saturated seconds | Saturation percentage |
|---|---|---|---|
| A | 6177 | 286 | 4.630079% |
| B | 6177 | 66 | 1.068480% |
| C | 6176 | 1953 | 31.622409% |
| D | 6176 | 1860 | 30.116580% |
Noise dominated data is calculated using 1-second bins in cleaned event files. If a bin has >2000 counts, and if more than 50% of those come from <1% of pixels, then it is considered to be noise-dominated and hence unusable.
| Quadrant | # 1 sec bins | Bins with >0 counts | Bins with >2000 counts | High rate bins dominated by noise | Noise dominated (total time) | Noise dominated (detector-on time) | Marked lightcurve |
|---|---|---|---|---|---|---|---|
| A | 7367 | 6178 | 346 | 346 | 4.70% | 5.60% | 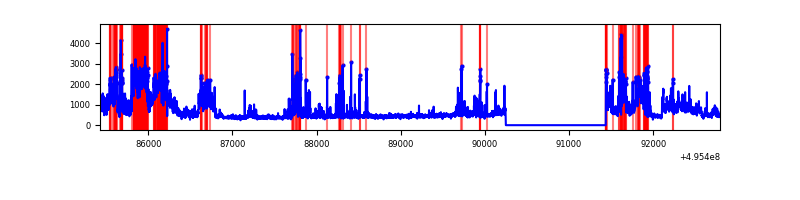 |
| B | 7367 | 6178 | 36 | 36 | 0.49% | 0.58% | 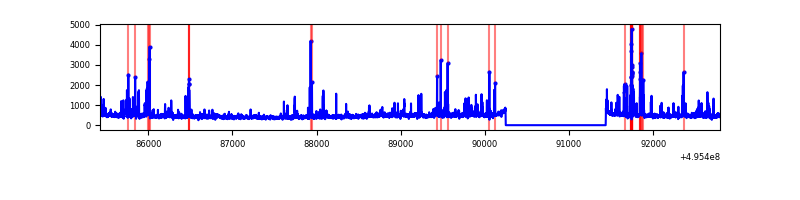 |
| C | 7366 | 6177 | 1676 | 1676 | 22.75% | 27.13% | 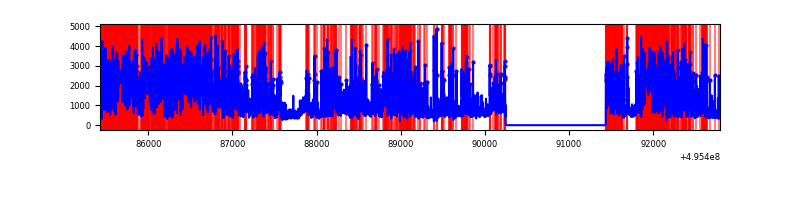 |
| D | 7365 | 6176 | 1549 | 1549 | 21.03% | 25.08% | 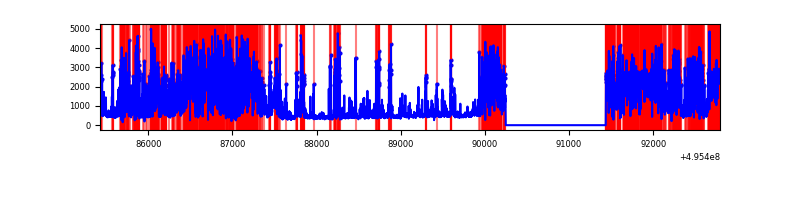 |
Top three noisy pixels from each quadrant. If the there are fewer than three noisy pixels in the level2.evt file, extra rows are filled as -1
| Pixel properties | Quadrant properties | ||||||
|---|---|---|---|---|---|---|---|
| Quadrant | DetID | PixID | Counts | Sigma | Mean | Median | Sigma |
| A | 12 | 115 | 1722403 | 10403.49 | 665 | 649 | 165.5 |
| A | 4 | 249 | 225422 | 1358.16 | 665 | 649 | 165.5 |
| A | 15 | 174 | 161084 | 969.41 | 665 | 649 | 165.5 |
| B | 5 | 185 | 288954 | 2017.34 | 668 | 644 | 142.9 |
| B | 0 | 213 | 69041 | 478.58 | 668 | 644 | 142.9 |
| B | 10 | 245 | 67599 | 468.49 | 668 | 644 | 142.9 |
| C | 15 | 224 | 5364774 | 34780.83 | 557 | 552 | 154.2 |
| C | 13 | 3 | 445505 | 2885.01 | 557 | 552 | 154.2 |
| C | 1 | 241 | 221819 | 1434.66 | 557 | 552 | 154.2 |
| D | 8 | 176 | 4806870 | 31416.98 | 531 | 508 | 153.0 |
| D | 6 | 239 | 395423 | 2581.38 | 531 | 508 | 153.0 |
| D | 10 | 118 | 149050 | 970.95 | 531 | 508 | 153.0 |
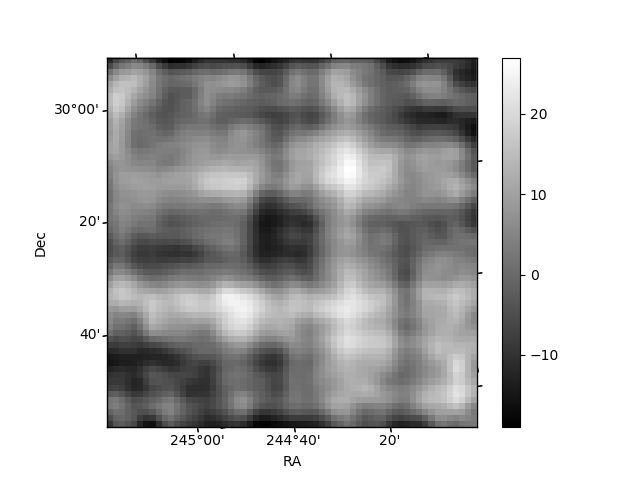
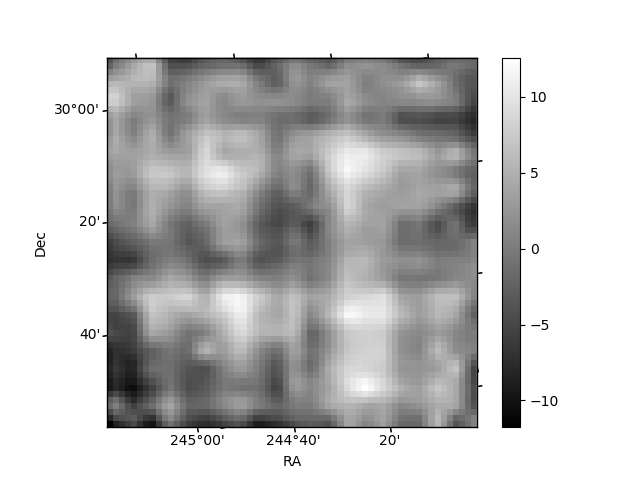
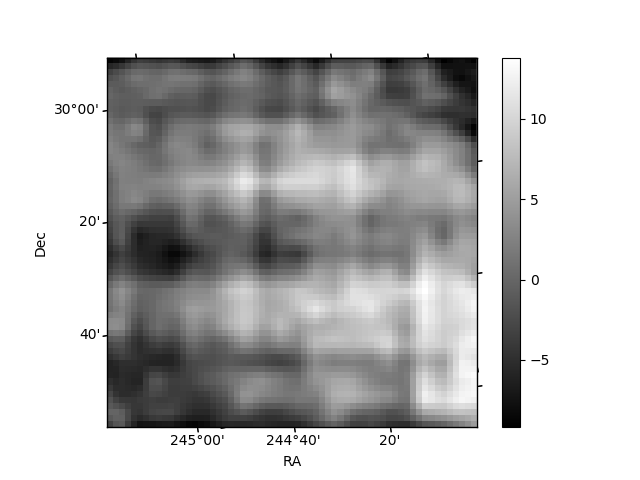
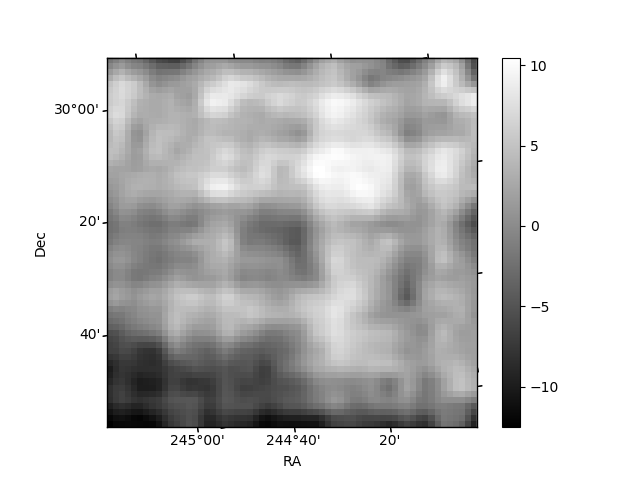
Histogram calculated using DETX and DETY for each event in the final _common_clean file
| Quadrant A | 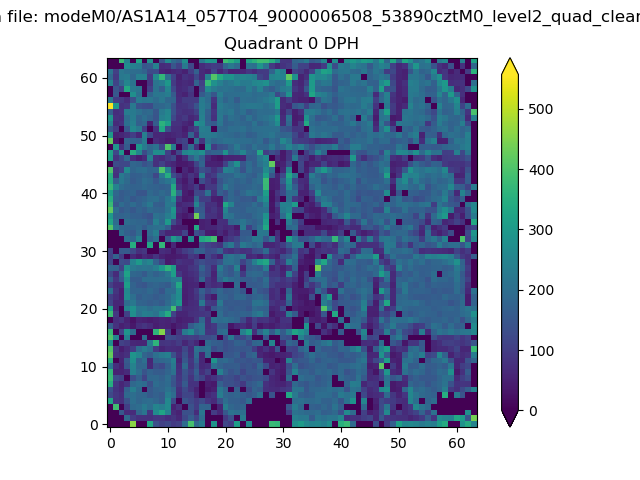 |
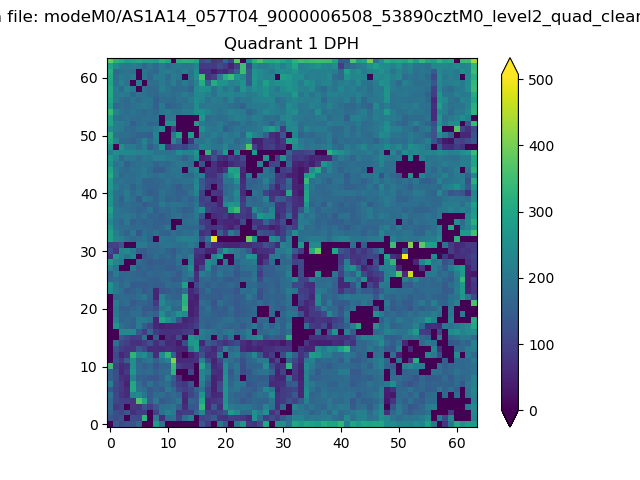 |
Quadrant B |
|---|---|---|---|
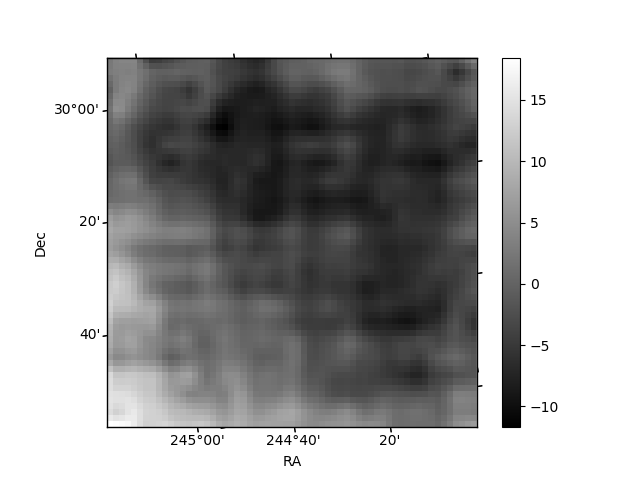
| Quadrant D | 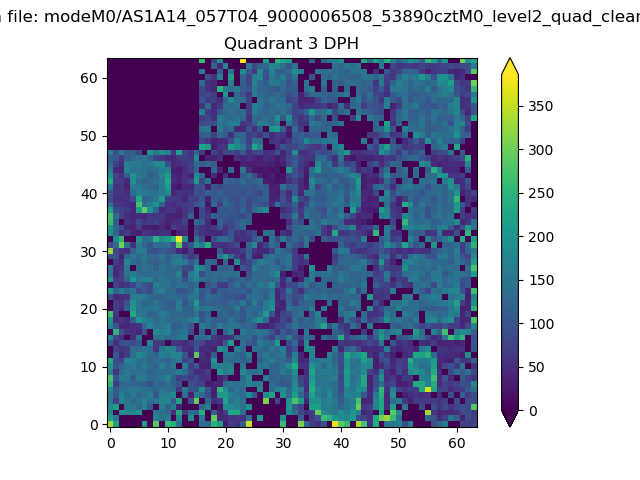 |
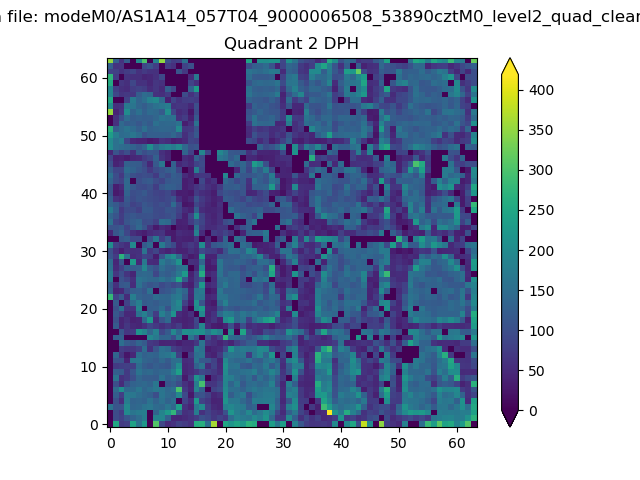 |
Quadrant C |
| Plot type | Count rate plots | Images |
|---|---|---|
| Comparison with Poisson distribution Blue bars denote a histogram of data divided into 1 sec bins. Red curve is a Poisson curve with rate = median count rate of data. |
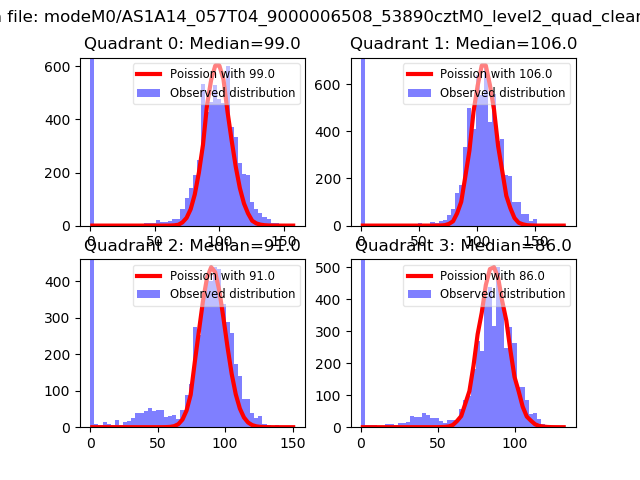 |
 |
| Quadrant-wise count rates Data is divided into 100 sec bins |
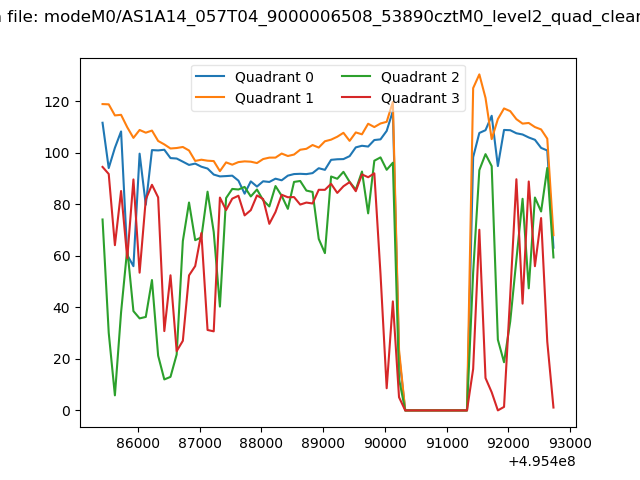 |
|
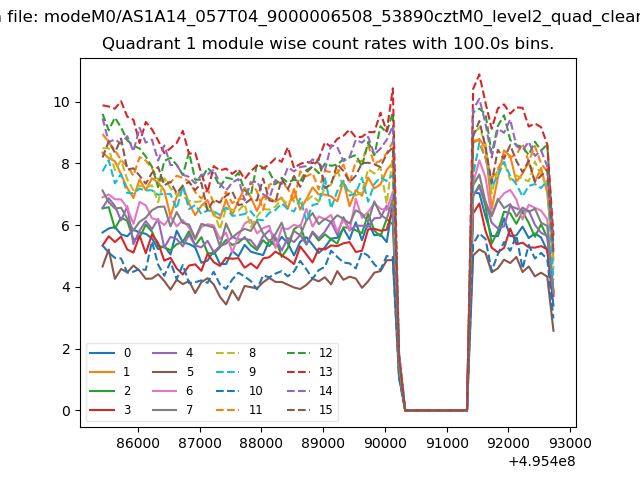
| Module-wise count rates for Quadrant A Data is divided into 100 sec bins |
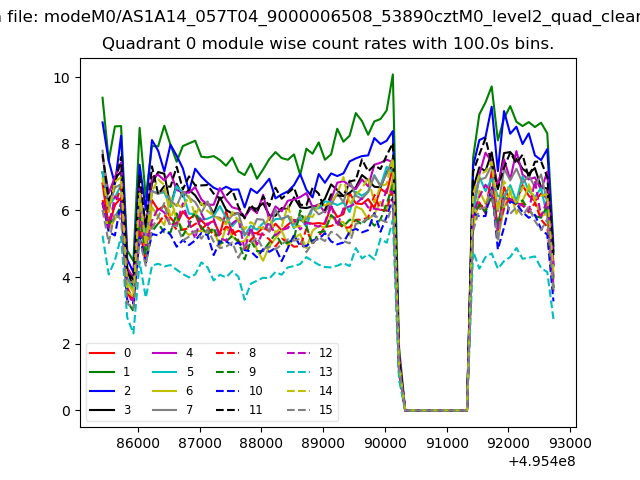 |
 |
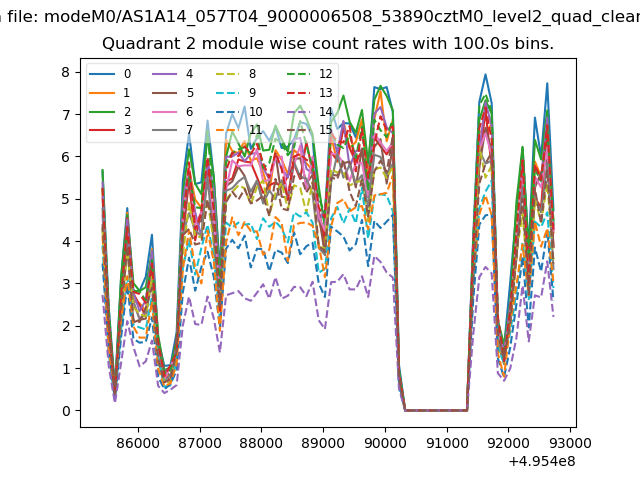
| Module-wise count rates for Quadrant B Data is divided into 100 sec bins |
 |
 |
| Module-wise count rates for Quadrant C Data is divided into 100 sec bins |
 |
 |
| Module-wise count rates for Quadrant D Data is divided into 100 sec bins |
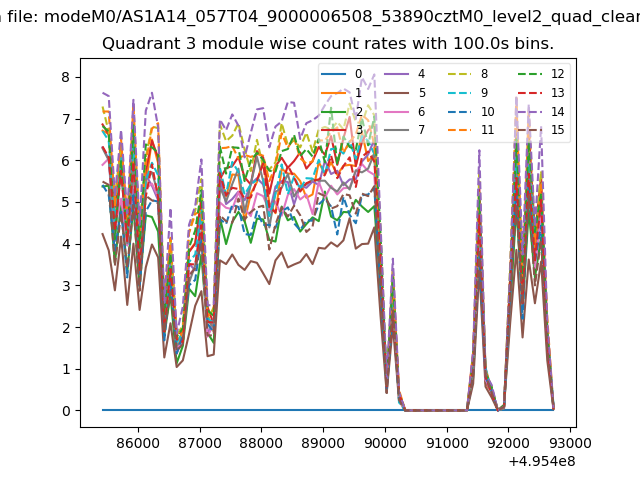 |
 |
| Parameter | Plot |
|---|---|
| CZT HV Monitor | 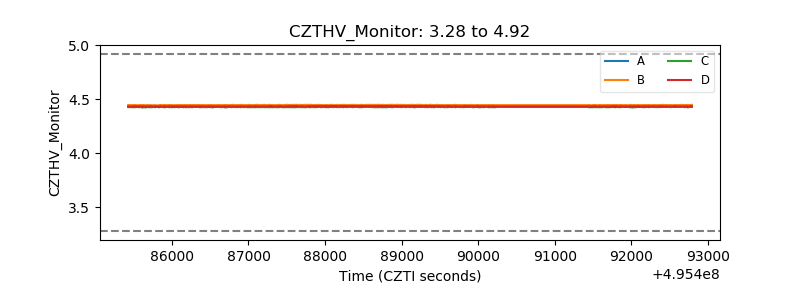 |
| D_VDD | 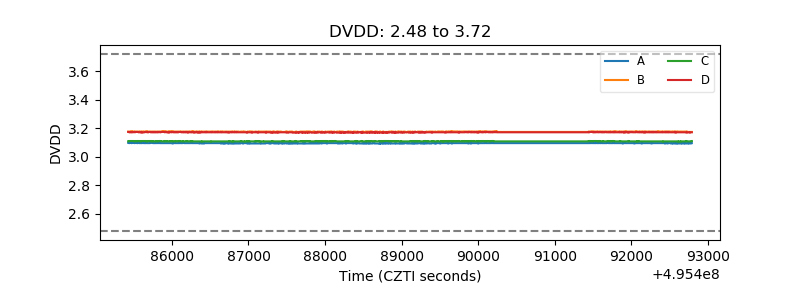 |
| Temperature 1 | 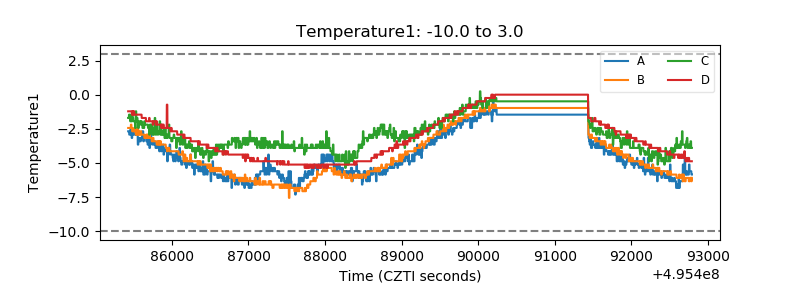 |
| Veto HV Monitor | 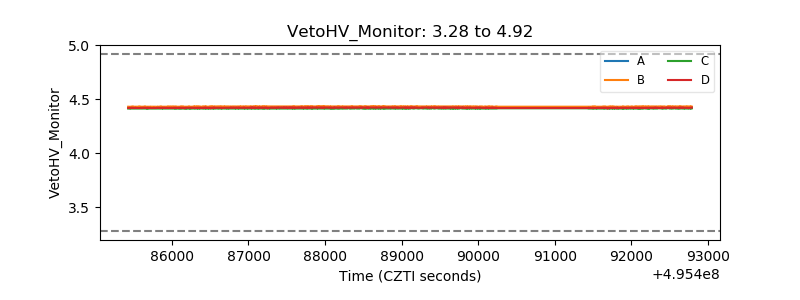 |
| Veto LLD | 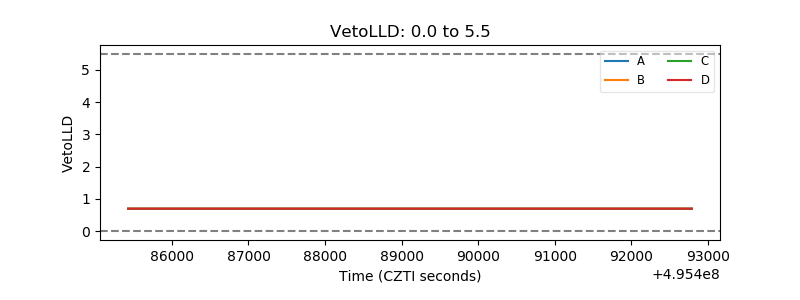 |
| Alpha Counter | 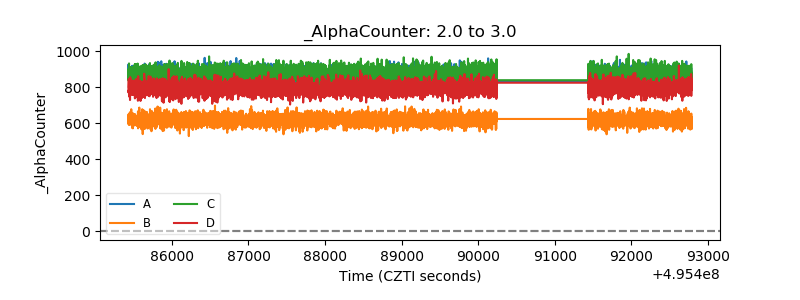 |
| _CPM_Rate | 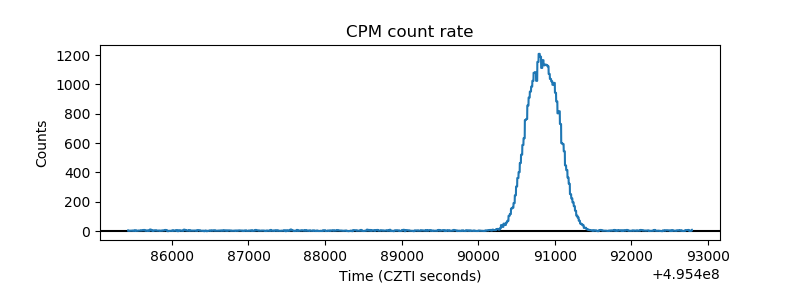 |
| CZT Counter | 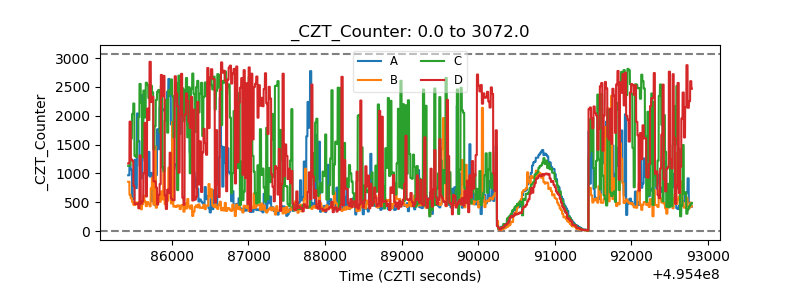 |
| +2.5 Volts monitor |  |
| +5 Volts monitor |  |
| _ROLL_ROT | 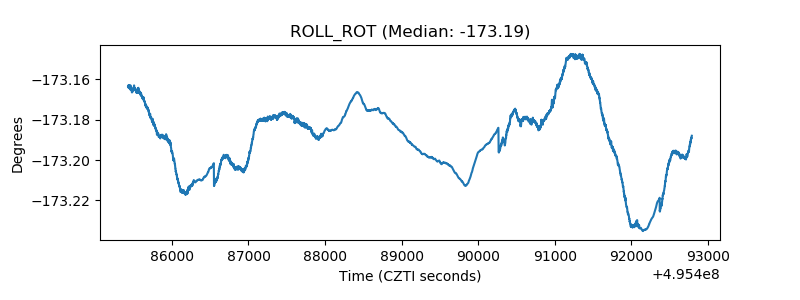 |
| _Roll_DEC | 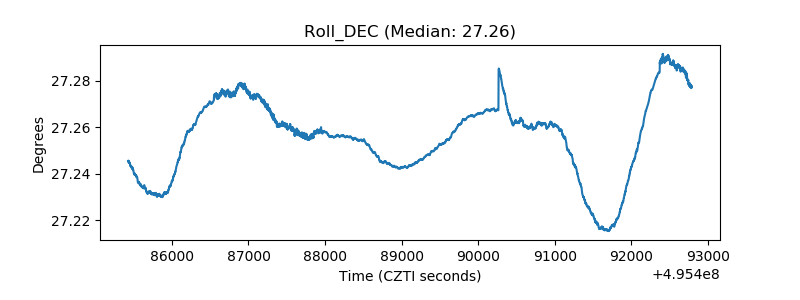 |
| _Roll_RA | 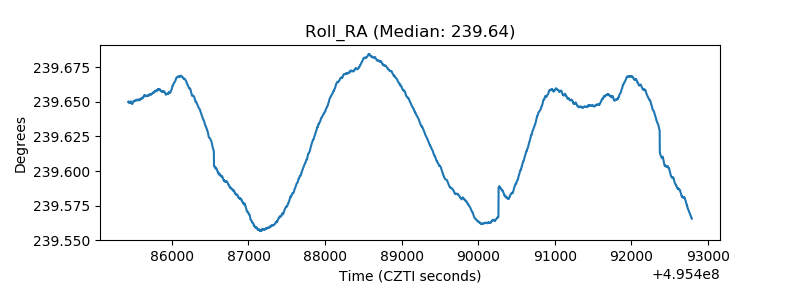 |
| Veto Counter | 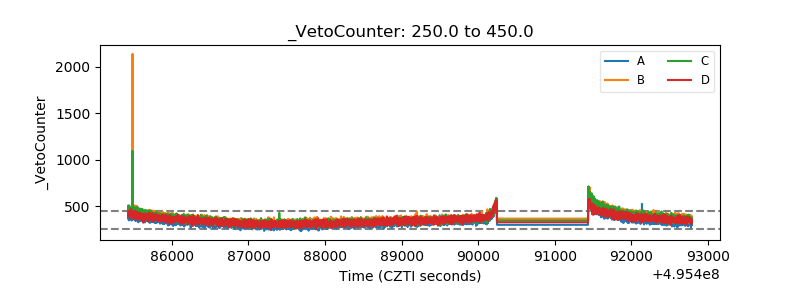 |