| Param | Original file | Final file |
|---|---|---|
| Filename | modeM0/AS1A14_057T04_9000006508_53891cztM0_level2.fits | modeM0/AS1A14_057T04_9000006508_53891cztM0_level2_quad_clean.evt |
| Size (bytes) | 786,945,600 | 83,001,600 |
| Size | 750.5 MB | 79.2 MB |
| Events in quadrant A | 6,018,184 | 640,943 |
| Events in quadrant B | 3,400,386 | 689,966 |
| Events in quadrant C | 7,033,289 | 510,938 |
| Events in quadrant D | 12,187,299 | 228,093 |
| Mode M0 | |||
|---|---|---|---|
| Quadrant | BADHDUFLAG | Total packets | Discarded packets |
| A | 0 | 22354 | 2 |
| B | 0 | 14430 | 2 |
| C | 0 | 25324 | 2 |
| D | 0 | 40490 | 5 |
| Mode SS | |||
|---|---|---|---|
| Quadrant | BADHDUFLAG | Total packets | Discarded packets |
| A | 0 | 130 | 0 |
| B | 0 | 130 | 0 |
| C | 0 | 130 | 0 |
| D | 0 | 130 | 0 |
| Mode M9 | |||
|---|---|---|---|
| Quadrant | BADHDUFLAG | Total packets | Discarded packets |
| A | 0 | 12 | 0 |
| B | 0 | 12 | 0 |
| C | 0 | 12 | 0 |
| D | 0 | 12 | 0 |
| Quadrant | Total seconds | Saturated seconds | Saturation percentage |
|---|---|---|---|
| A | 6344 | 193 | 3.042245% |
| B | 6344 | 87 | 1.371375% |
| C | 6344 | 1329 | 20.948928% |
| D | 6343 | 4013 | 63.266593% |
Noise dominated data is calculated using 1-second bins in cleaned event files. If a bin has >2000 counts, and if more than 50% of those come from <1% of pixels, then it is considered to be noise-dominated and hence unusable.
| Quadrant | # 1 sec bins | Bins with >0 counts | Bins with >2000 counts | High rate bins dominated by noise | Noise dominated (total time) | Noise dominated (detector-on time) | Marked lightcurve |
|---|---|---|---|---|---|---|---|
| A | 7584 | 6345 | 162 | 162 | 2.14% | 2.55% | 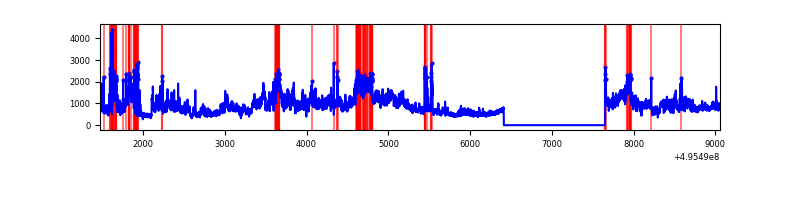 |
| B | 7584 | 6345 | 55 | 55 | 0.73% | 0.87% | 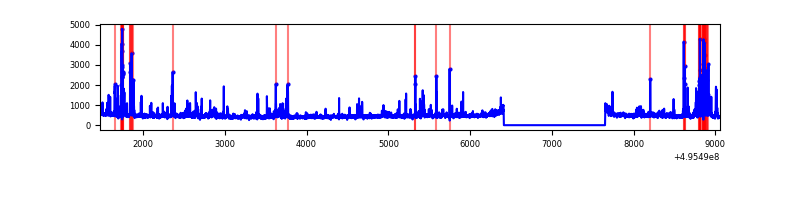 |
| C | 7584 | 6345 | 978 | 978 | 12.90% | 15.41% | 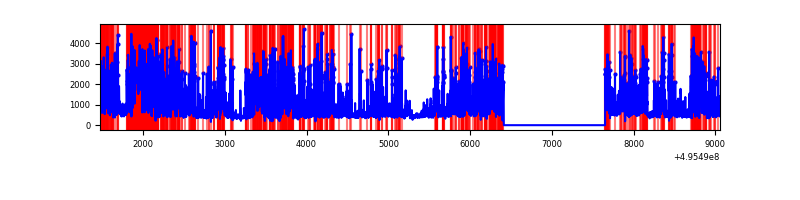 |
| D | 7582 | 6343 | 3378 | 3378 | 44.55% | 53.26% | 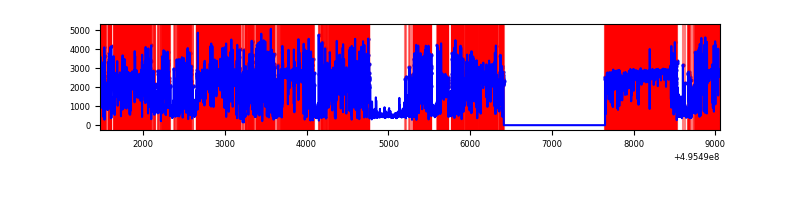 |
Top three noisy pixels from each quadrant. If the there are fewer than three noisy pixels in the level2.evt file, extra rows are filled as -1
| Pixel properties | Quadrant properties | ||||||
|---|---|---|---|---|---|---|---|
| Quadrant | DetID | PixID | Counts | Sigma | Mean | Median | Sigma |
| A | 12 | 115 | 3043271 | 17605.97 | 699 | 684 | 172.8 |
| A | 4 | 249 | 116995 | 673.04 | 699 | 684 | 172.8 |
| A | 15 | 174 | 62985 | 360.51 | 699 | 684 | 172.8 |
| B | 10 | 245 | 216290 | 1431.3 | 700 | 675 | 150.6 |
| B | 5 | 185 | 156463 | 1034.16 | 700 | 675 | 150.6 |
| B | 0 | 213 | 43521 | 284.42 | 700 | 675 | 150.6 |
| C | 15 | 224 | 3694643 | 21754.59 | 616 | 610 | 169.8 |
| C | 4 | 5 | 555392 | 3267.18 | 616 | 610 | 169.8 |
| C | 13 | 3 | 125013 | 732.62 | 616 | 610 | 169.8 |
| D | 8 | 176 | 8473168 | 76819.08 | 381 | 364 | 110.3 |
| D | 7 | 70 | 1502038 | 13615.0 | 381 | 364 | 110.3 |
| D | 2 | 172 | 239221 | 2165.61 | 381 | 364 | 110.3 |
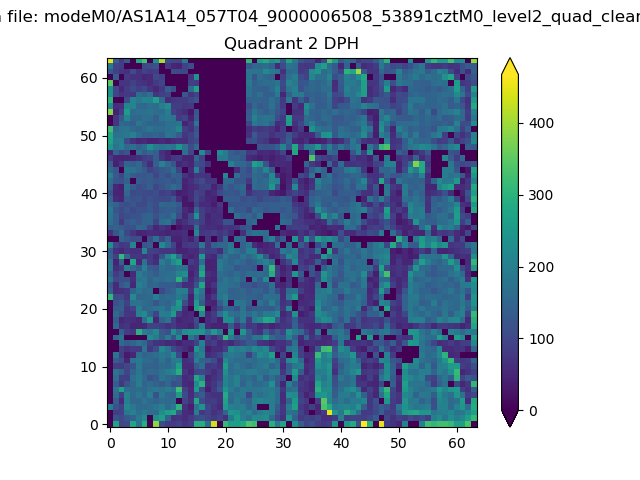
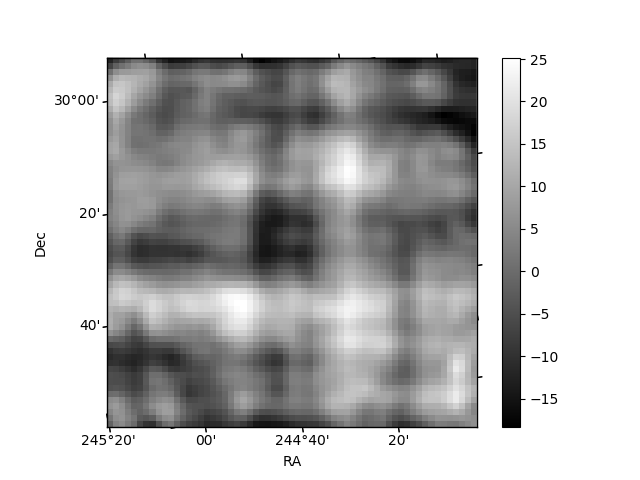
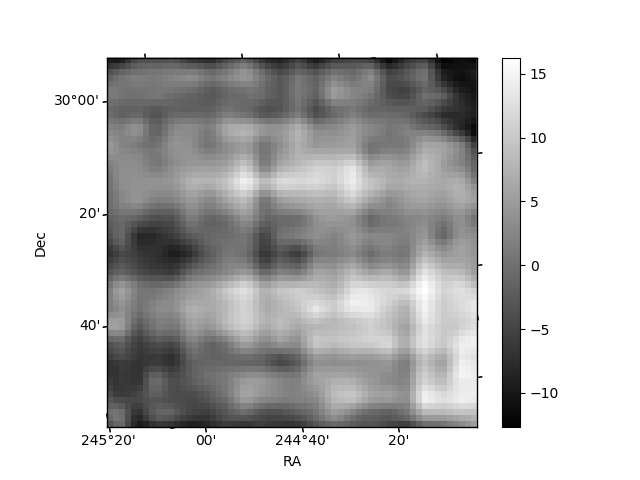
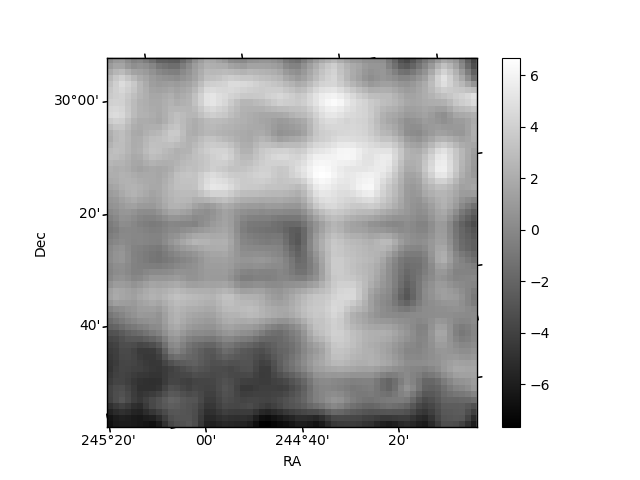
Histogram calculated using DETX and DETY for each event in the final _common_clean file
| Quadrant A | 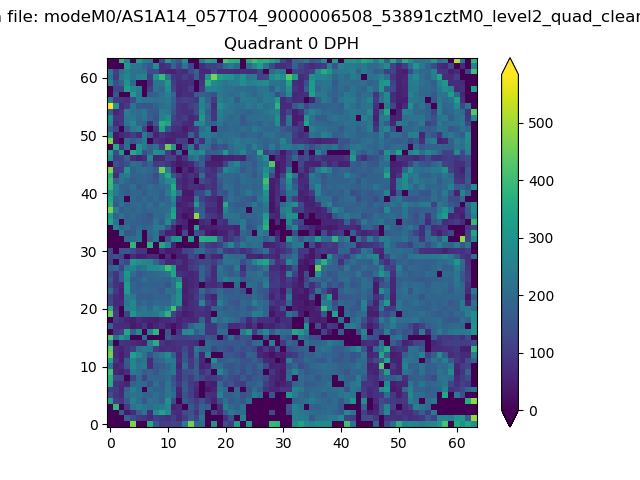 |
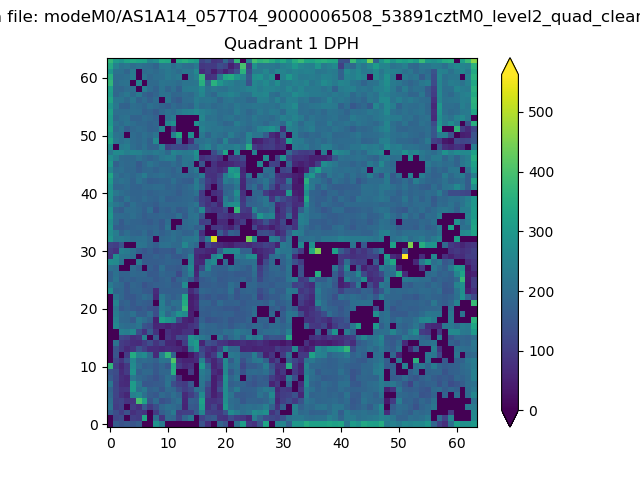 |
Quadrant B |
|---|---|---|---|
| Quadrant D | 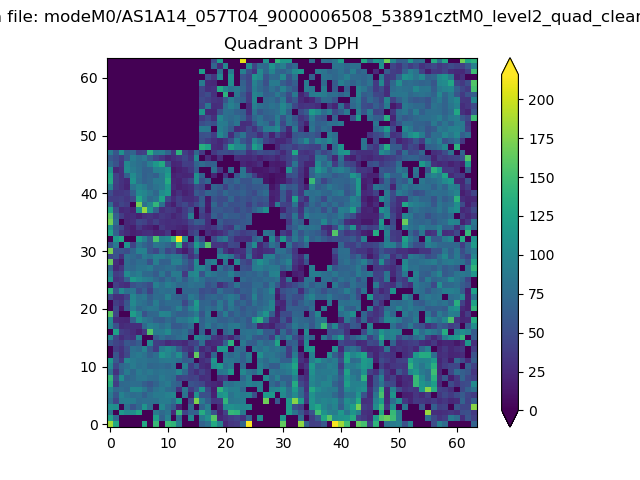 |
 |
Quadrant C |
| Plot type | Count rate plots | Images |
|---|---|---|
| Comparison with Poisson distribution Blue bars denote a histogram of data divided into 1 sec bins. Red curve is a Poisson curve with rate = median count rate of data. |
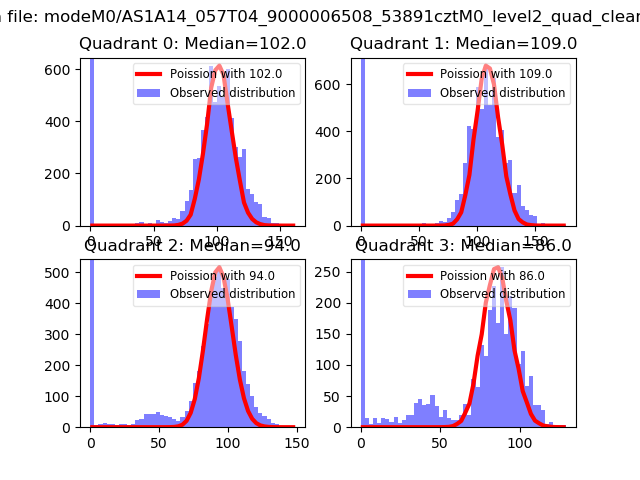 |
 |
| Quadrant-wise count rates Data is divided into 100 sec bins |
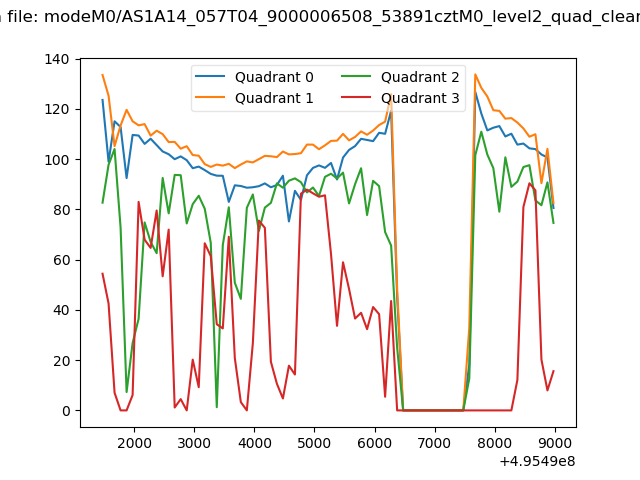 |
|
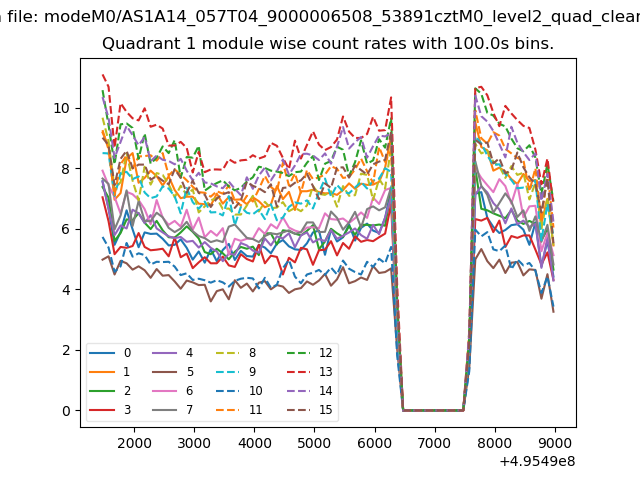
| Module-wise count rates for Quadrant A Data is divided into 100 sec bins |
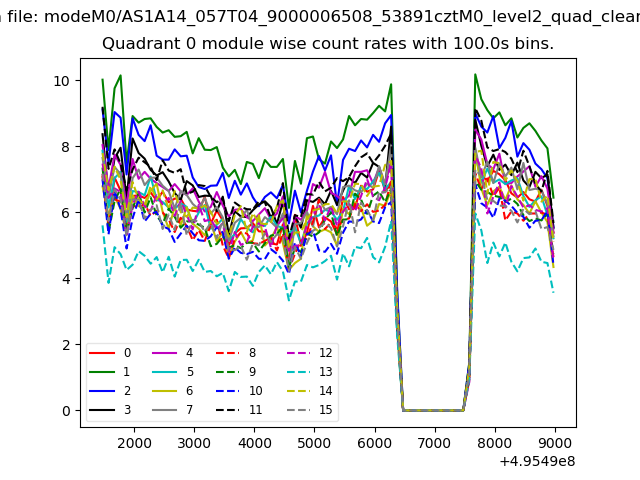 |
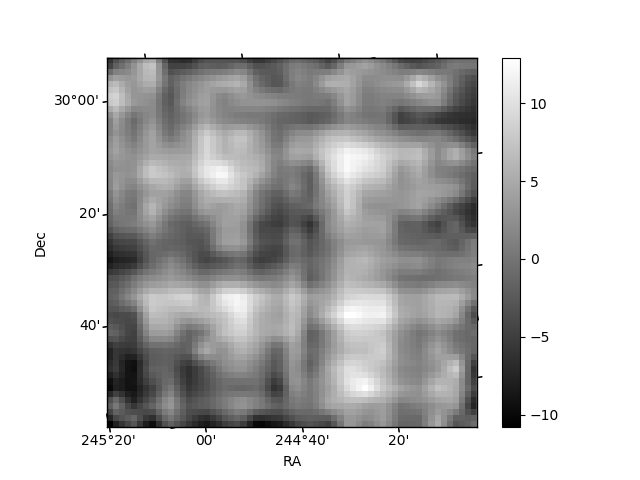 |
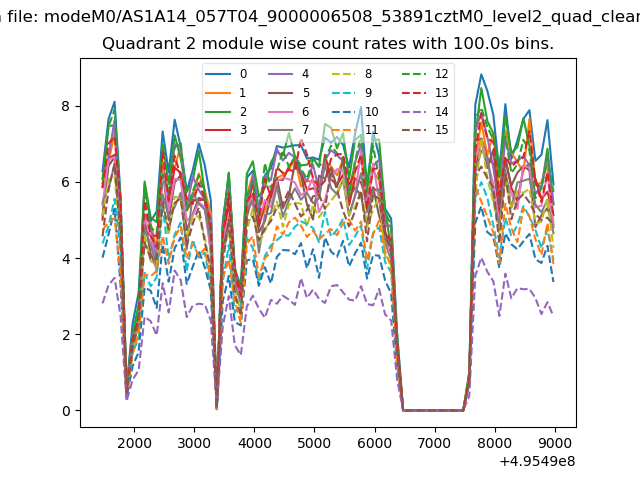
| Module-wise count rates for Quadrant B Data is divided into 100 sec bins |
 |
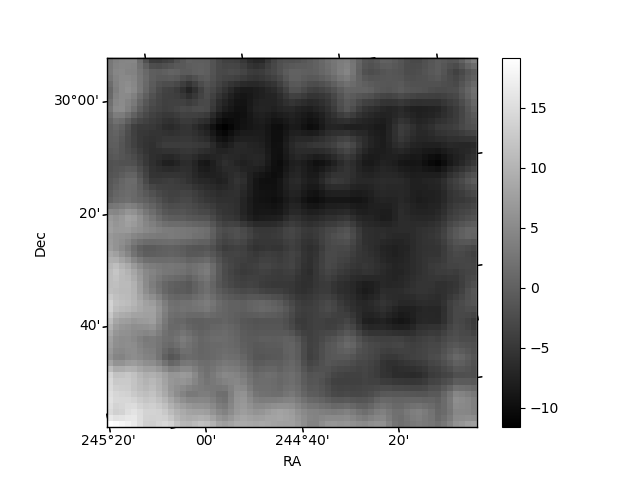 |
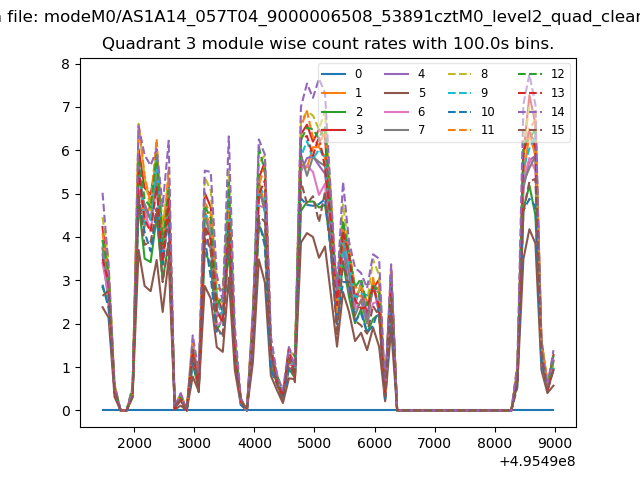
| Module-wise count rates for Quadrant C Data is divided into 100 sec bins |
 |
 |
| Module-wise count rates for Quadrant D Data is divided into 100 sec bins |
 |
 |
| Parameter | Plot |
|---|---|
| CZT HV Monitor |  |
| D_VDD | 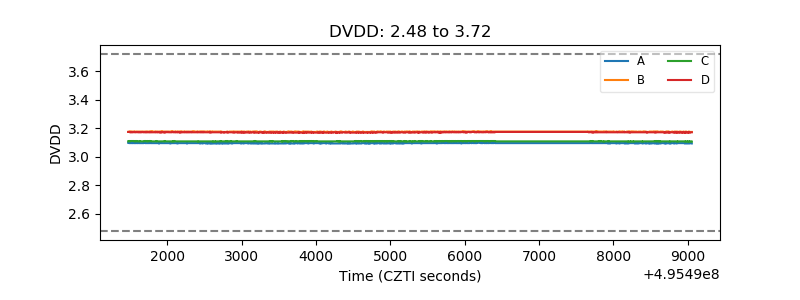 |
| Temperature 1 | 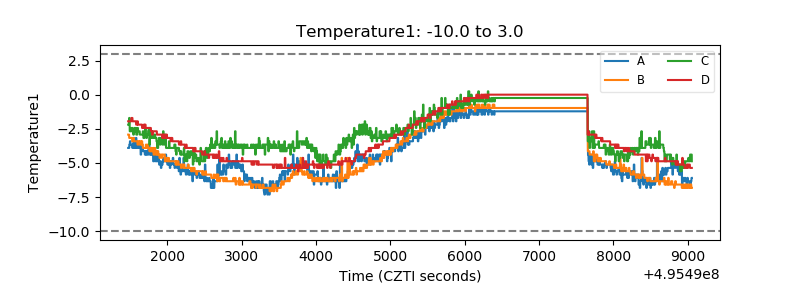 |
| Veto HV Monitor | 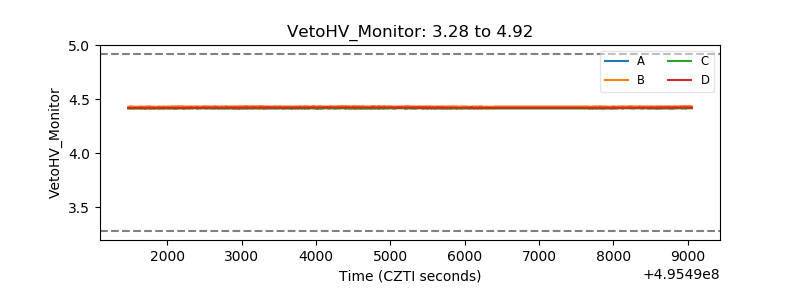 |
| Veto LLD | 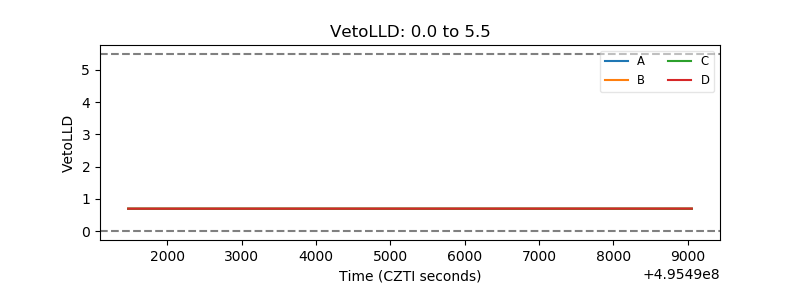 |
| Alpha Counter | 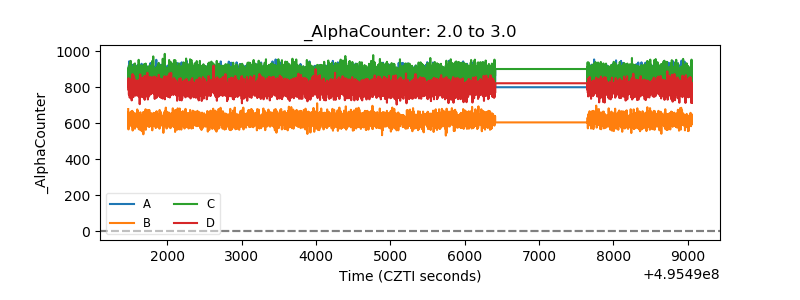 |
| _CPM_Rate | 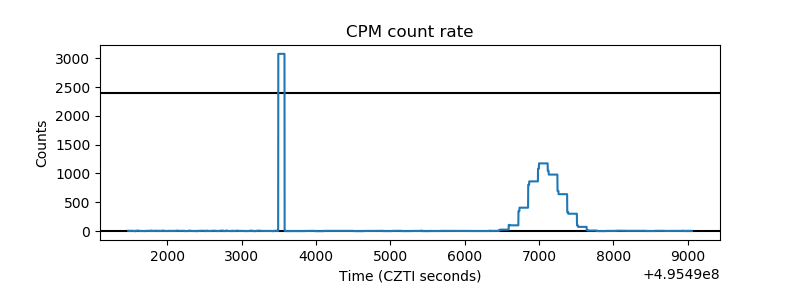 |
| CZT Counter | 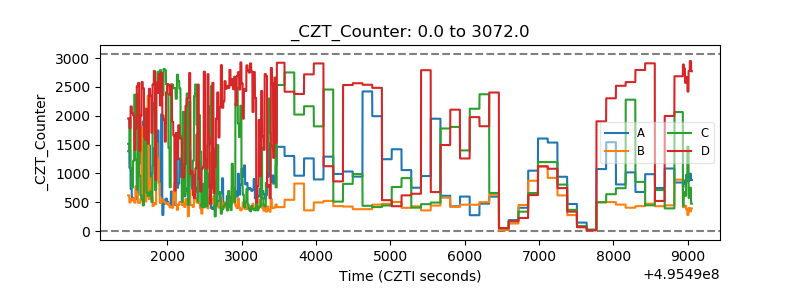 |
| +2.5 Volts monitor | 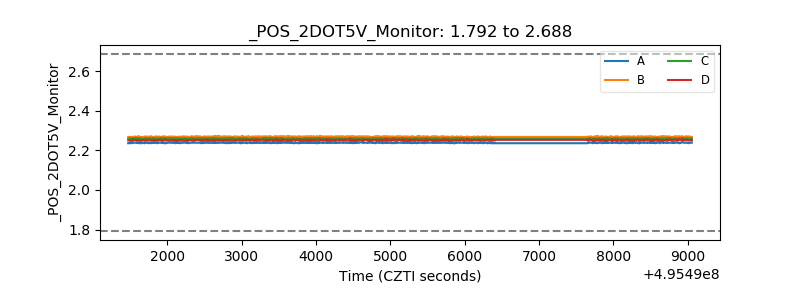 |
| +5 Volts monitor | 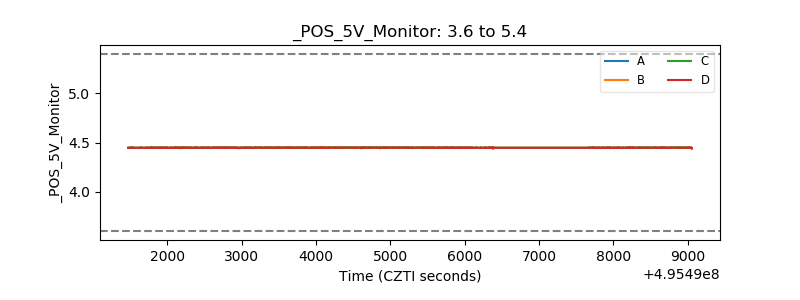 |
| _ROLL_ROT | 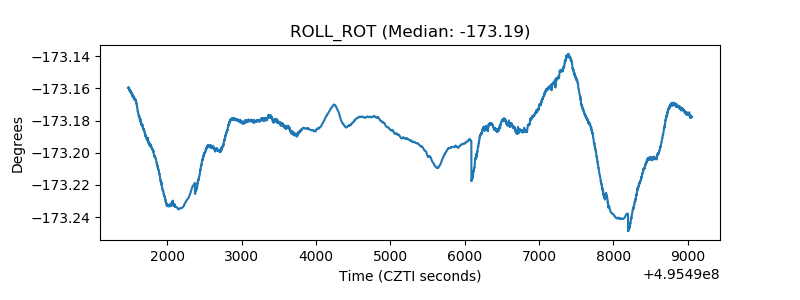 |
| _Roll_DEC | 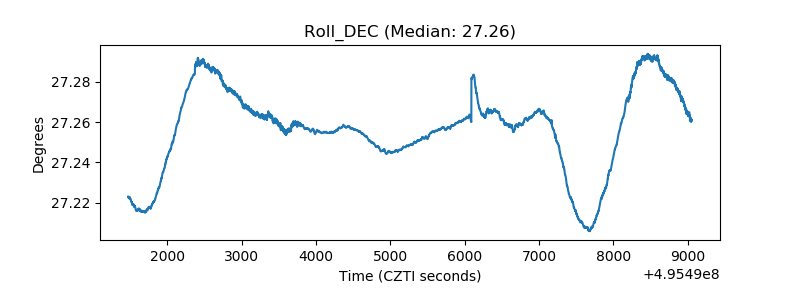 |
| _Roll_RA | 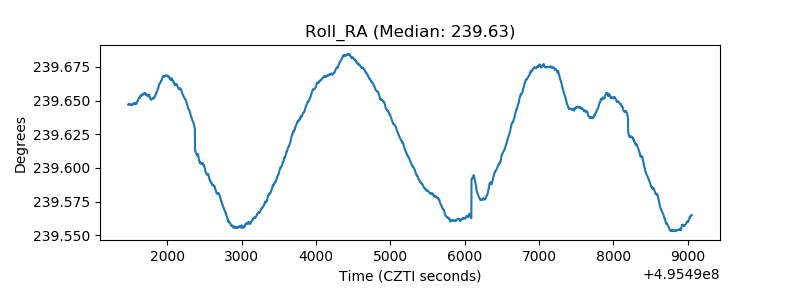 |
| Veto Counter | 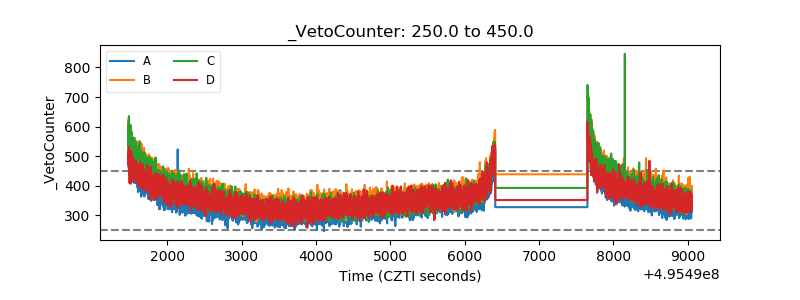 |