| Param | Original file | Final file |
|---|---|---|
| Filename | modeM0/AS1A14_057T04_9000006508_53894cztM0_level2.fits | modeM0/AS1A14_057T04_9000006508_53894cztM0_level2_quad_clean.evt |
| Size (bytes) | 822,988,800 | 80,337,600 |
| Size | 784.9 MB | 76.6 MB |
| Events in quadrant A | 4,321,239 | 632,902 |
| Events in quadrant B | 3,716,771 | 694,028 |
| Events in quadrant C | 5,783,246 | 598,535 |
| Events in quadrant D | 16,110,002 | 28,693 |
| Mode M0 | |||
|---|---|---|---|
| Quadrant | BADHDUFLAG | Total packets | Discarded packets |
| A | 0 | 17749 | 2 |
| B | 0 | 15625 | 2 |
| C | 0 | 21863 | 2 |
| D | 0 | 52564 | 8 |
| Mode SS | |||
|---|---|---|---|
| Quadrant | BADHDUFLAG | Total packets | Discarded packets |
| A | 0 | 140 | 0 |
| B | 0 | 140 | 0 |
| C | 0 | 140 | 0 |
| D | 0 | 140 | 0 |
| Mode M9 | |||
|---|---|---|---|
| Quadrant | BADHDUFLAG | Total packets | Discarded packets |
| A | 0 | 17 | 0 |
| B | 0 | 18 | 0 |
| C | 0 | 18 | 0 |
| D | 0 | 18 | 0 |
| Quadrant | Total seconds | Saturated seconds | Saturation percentage |
|---|---|---|---|
| A | 6859 | 459 | 6.691938% |
| B | 6859 | 179 | 2.609710% |
| C | 6859 | 550 | 8.018662% |
| D | 6858 | 6613 | 96.427530% |
Noise dominated data is calculated using 1-second bins in cleaned event files. If a bin has >2000 counts, and if more than 50% of those come from <1% of pixels, then it is considered to be noise-dominated and hence unusable.
| Quadrant | # 1 sec bins | Bins with >0 counts | Bins with >2000 counts | High rate bins dominated by noise | Noise dominated (total time) | Noise dominated (detector-on time) | Marked lightcurve |
|---|---|---|---|---|---|---|---|
| A | 7639 | 6860 | 256 | 256 | 3.35% | 3.73% | 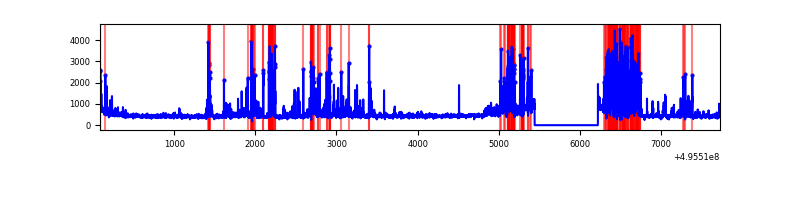 |
| B | 7639 | 6860 | 29 | 29 | 0.38% | 0.42% | 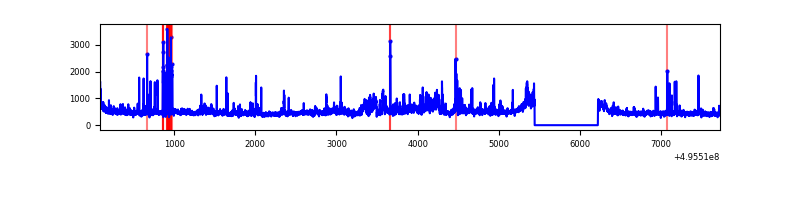 |
| C | 7639 | 6860 | 415 | 415 | 5.43% | 6.05% | 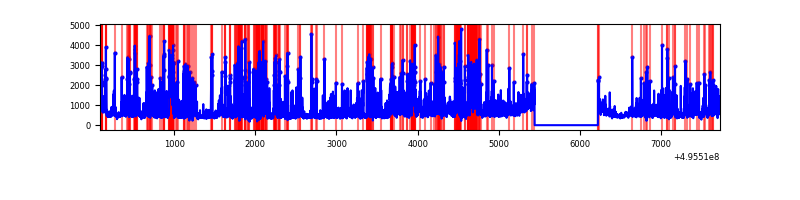 |
| D | 7637 | 6858 | 5308 | 5308 | 69.50% | 77.40% | 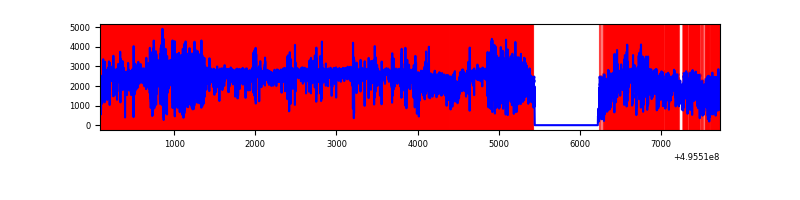 |
Top three noisy pixels from each quadrant. If the there are fewer than three noisy pixels in the level2.evt file, extra rows are filled as -1
| Pixel properties | Quadrant properties | ||||||
|---|---|---|---|---|---|---|---|
| Quadrant | DetID | PixID | Counts | Sigma | Mean | Median | Sigma |
| A | 4 | 249 | 1104987 | 6134.56 | 745 | 726 | 180.0 |
| A | 15 | 174 | 163921 | 906.6 | 745 | 726 | 180.0 |
| A | 12 | 115 | 62507 | 343.21 | 745 | 726 | 180.0 |
| B | 5 | 172 | 184220 | 1133.55 | 753 | 726 | 161.9 |
| B | 7 | 0 | 179342 | 1103.42 | 753 | 726 | 161.9 |
| B | 5 | 250 | 126530 | 777.17 | 753 | 726 | 161.9 |
| C | 15 | 224 | 2431375 | 12231.54 | 721 | 715 | 198.7 |
| C | 12 | 252 | 154934 | 776.06 | 721 | 715 | 198.7 |
| C | 15 | 209 | 146693 | 734.59 | 721 | 715 | 198.7 |
| D | 8 | 176 | 14888398 | 275218.89 | 182 | 174 | 54.1 |
| D | 6 | 239 | 102283 | 1887.55 | 182 | 174 | 54.1 |
| D | 7 | 70 | 75874 | 1399.37 | 182 | 174 | 54.1 |
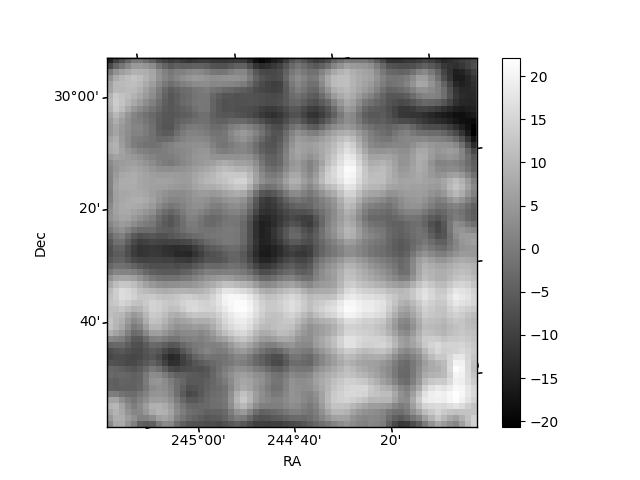
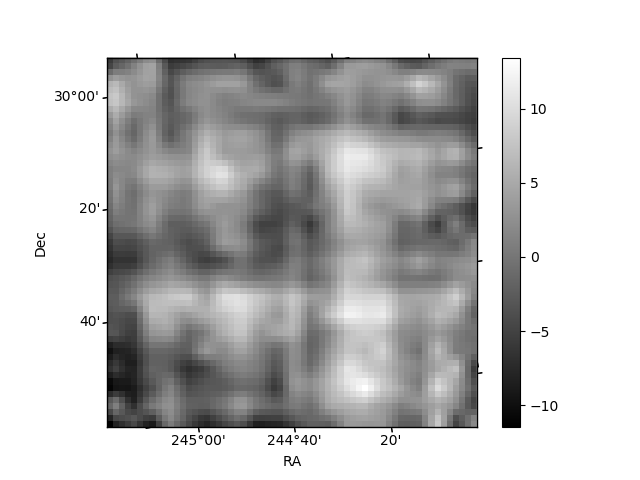
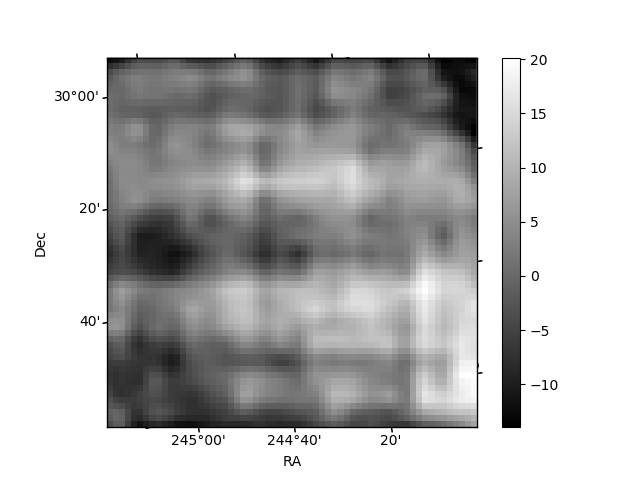
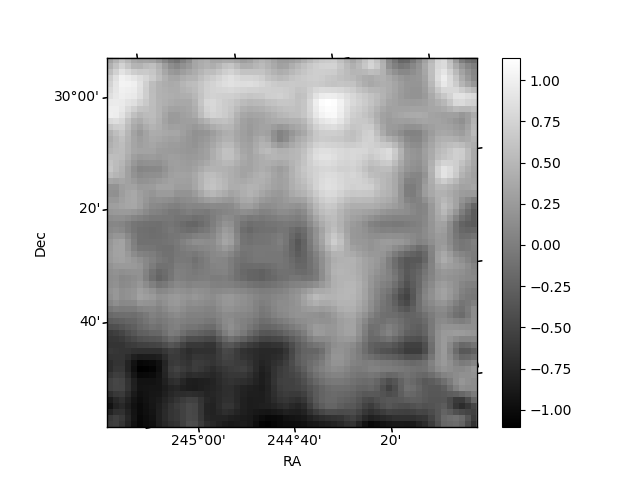
Histogram calculated using DETX and DETY for each event in the final _common_clean file
| Quadrant A | 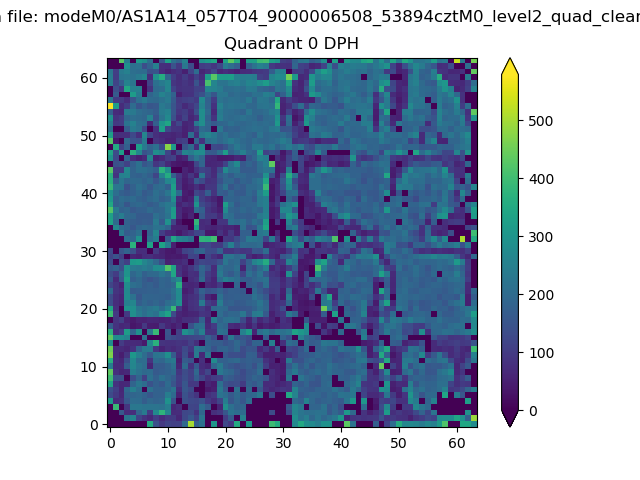 |
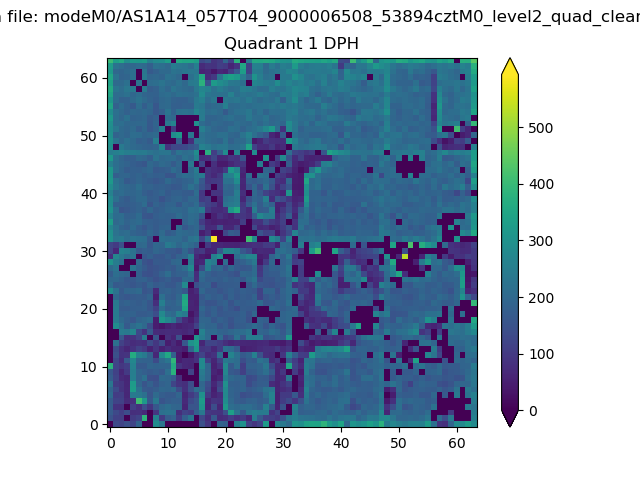 |
Quadrant B |
|---|---|---|---|
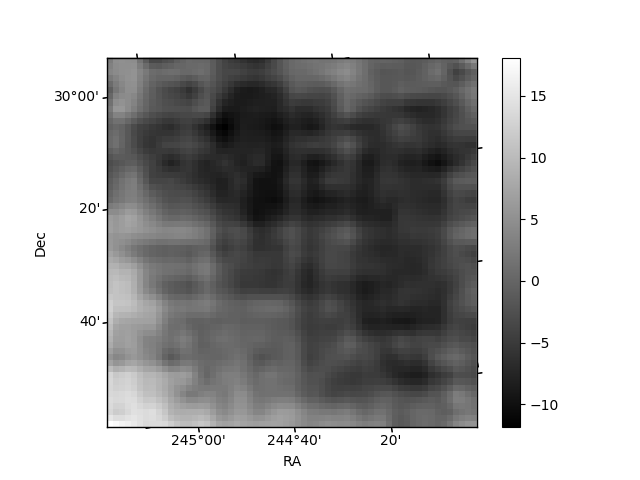
| Quadrant D | 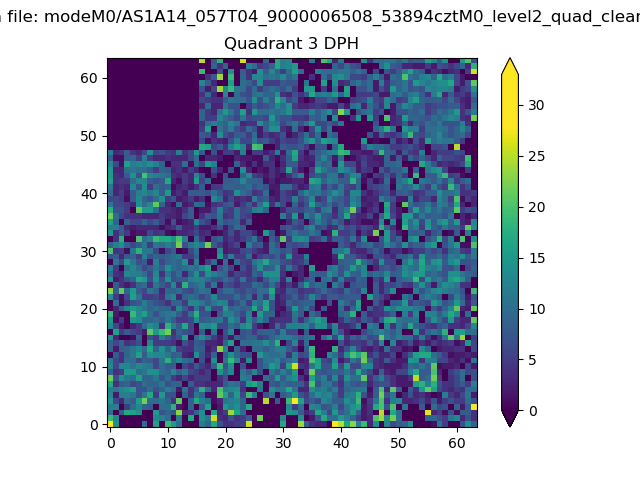 |
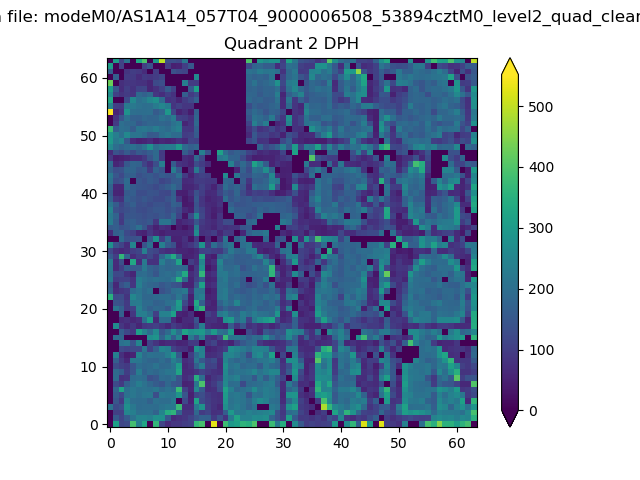 |
Quadrant C |
| Plot type | Count rate plots | Images |
|---|---|---|
| Comparison with Poisson distribution Blue bars denote a histogram of data divided into 1 sec bins. Red curve is a Poisson curve with rate = median count rate of data. |
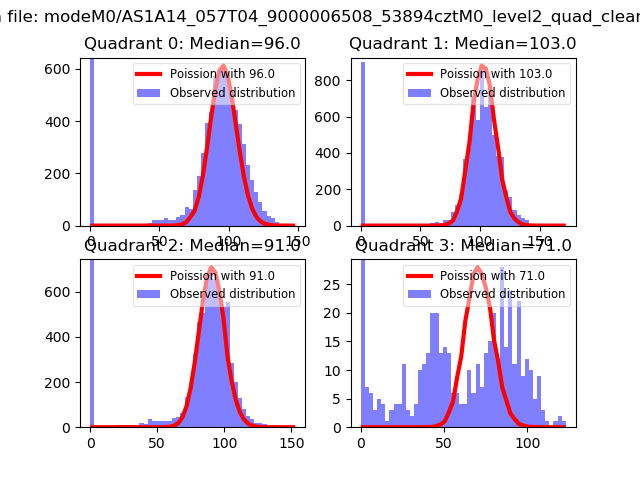 |
 |
| Quadrant-wise count rates Data is divided into 100 sec bins |
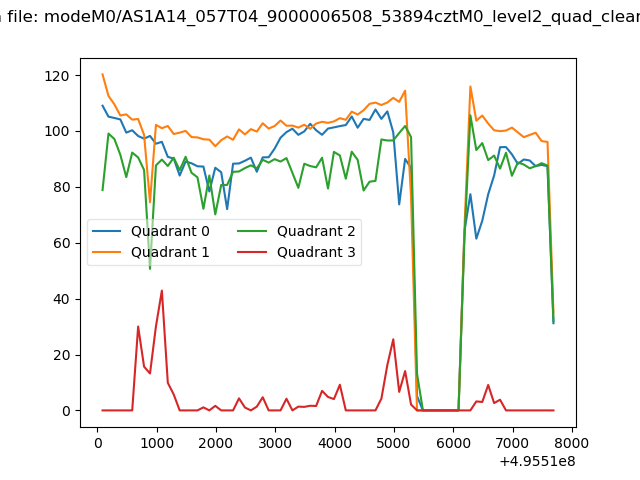 |
|
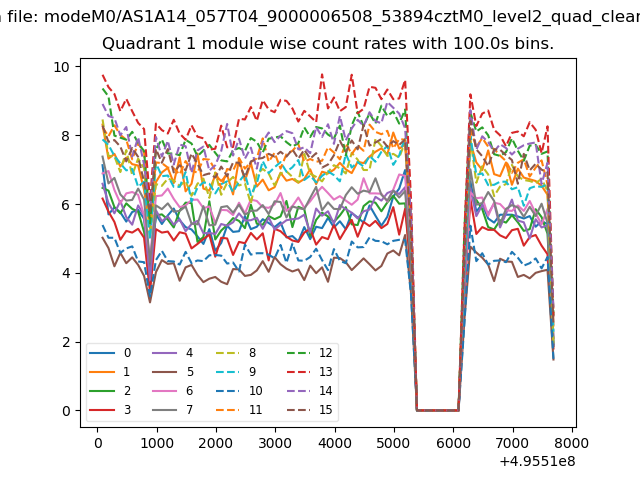
| Module-wise count rates for Quadrant A Data is divided into 100 sec bins |
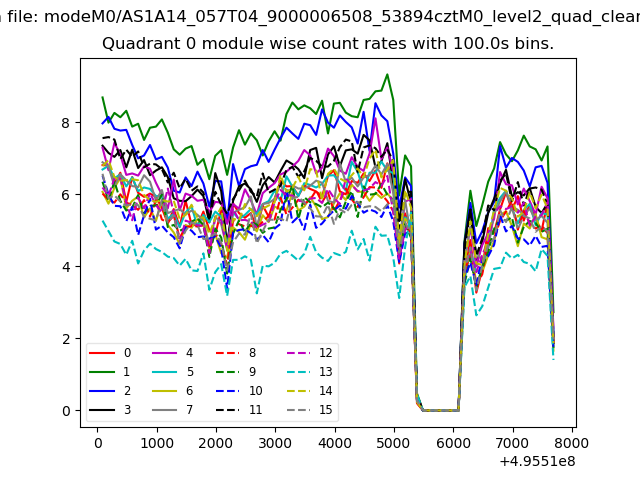 |
 |
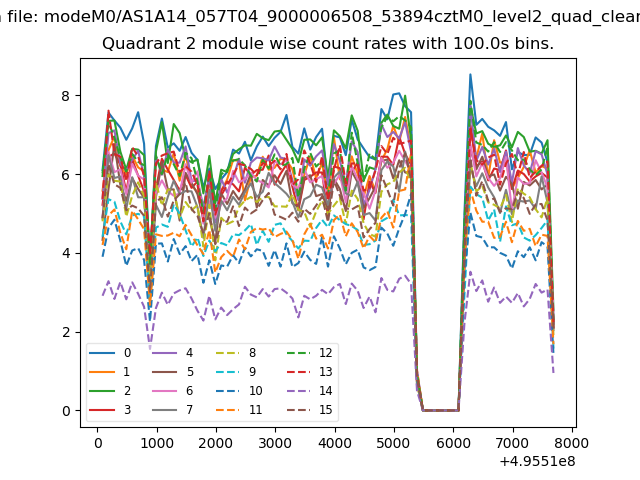
| Module-wise count rates for Quadrant B Data is divided into 100 sec bins |
 |
 |
| Module-wise count rates for Quadrant C Data is divided into 100 sec bins |
 |
 |
| Module-wise count rates for Quadrant D Data is divided into 100 sec bins |
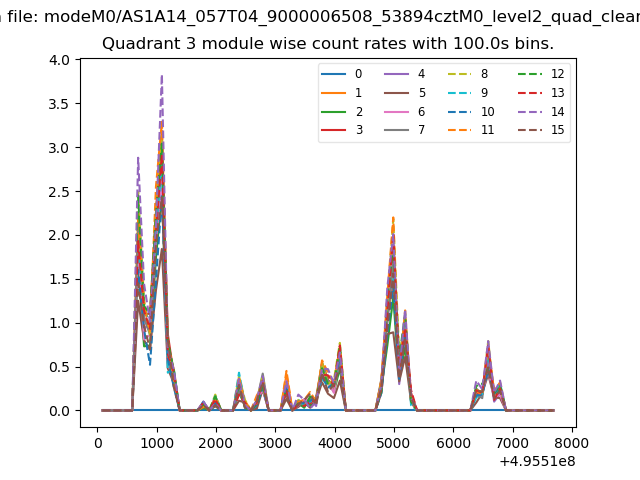 |
 |
| Parameter | Plot |
|---|---|
| CZT HV Monitor | 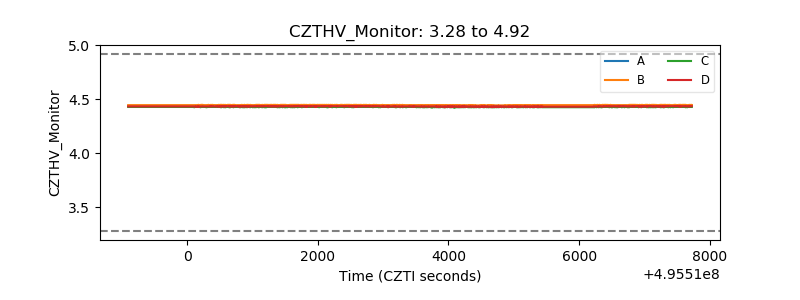 |
| D_VDD | 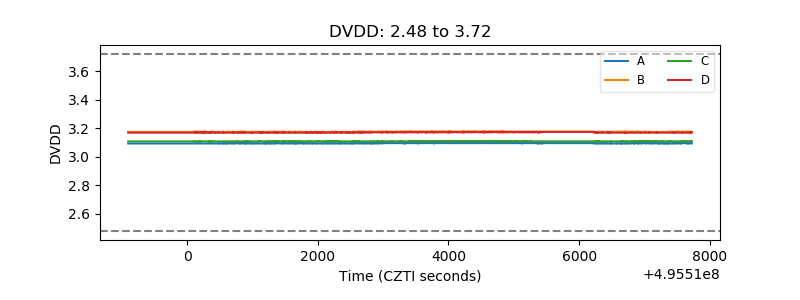 |
| Temperature 1 | 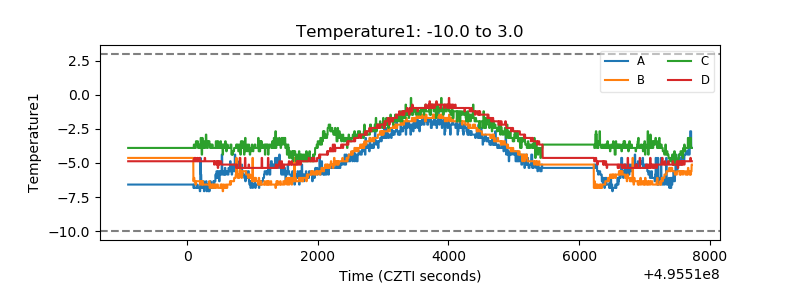 |
| Veto HV Monitor | 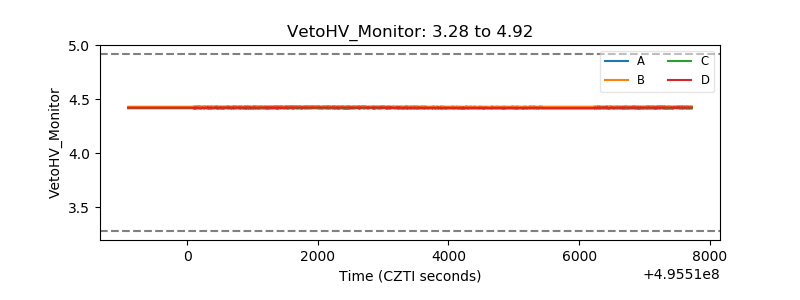 |
| Veto LLD | 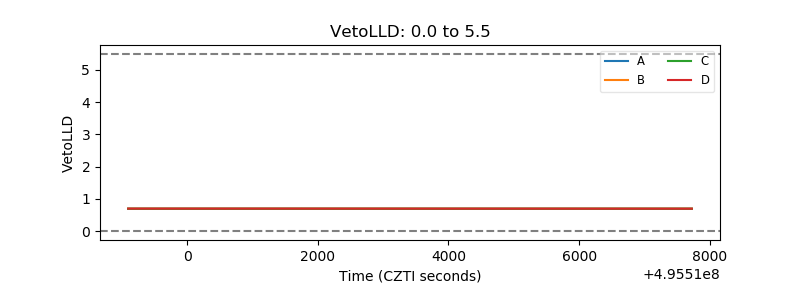 |
| Alpha Counter | 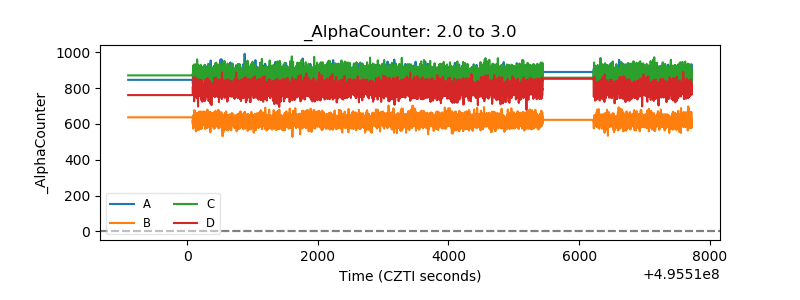 |
| _CPM_Rate | 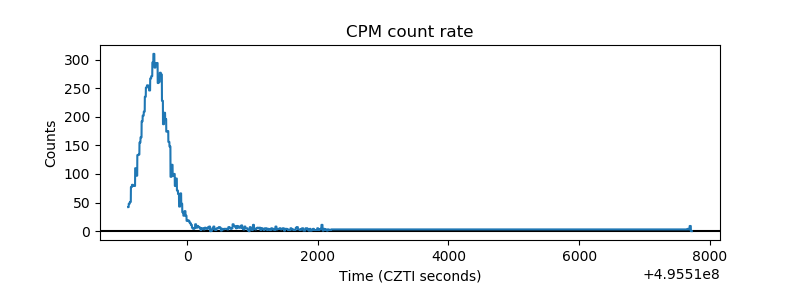 |
| CZT Counter | 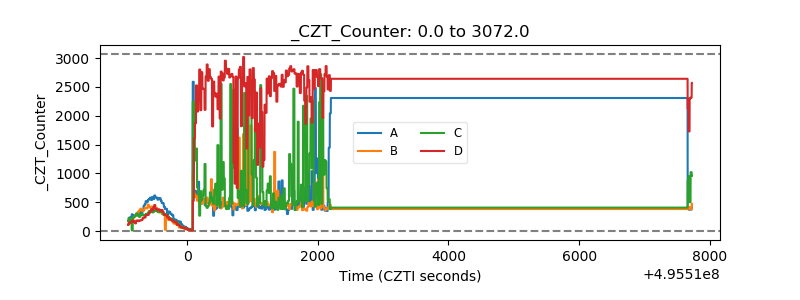 |
| +2.5 Volts monitor | 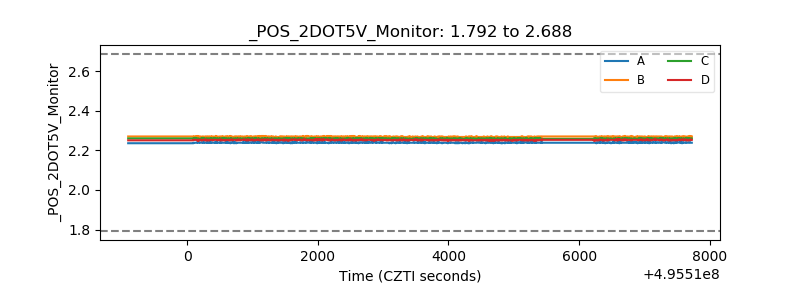 |
| +5 Volts monitor |  |
| _ROLL_ROT | 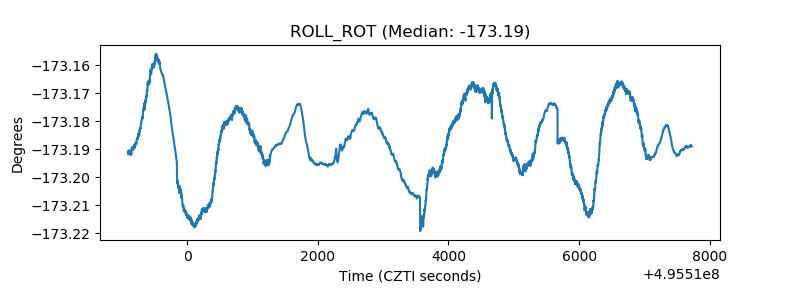 |
| _Roll_DEC | 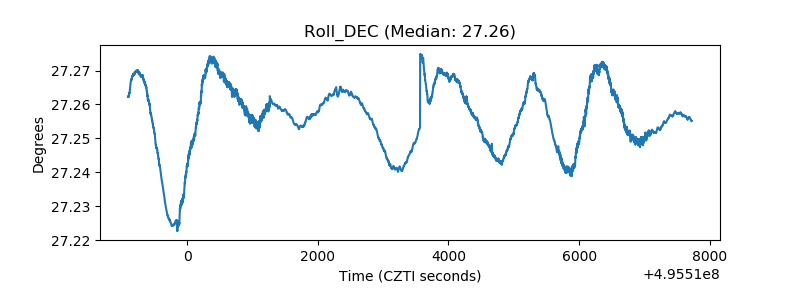 |
| _Roll_RA | 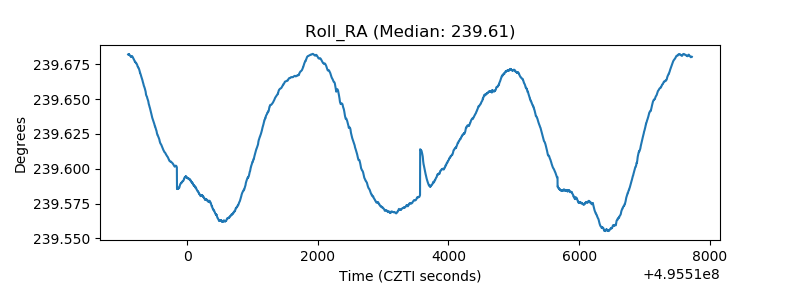 |
| Veto Counter | 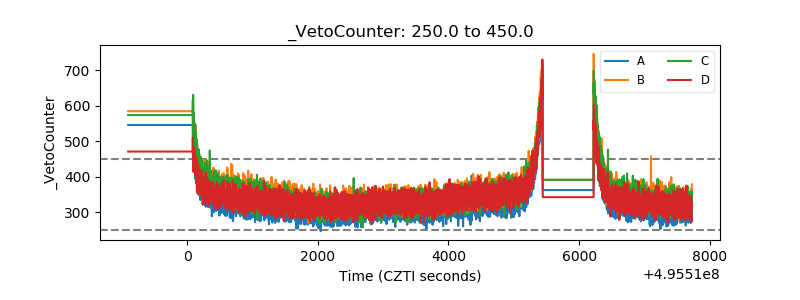 |