| Param | Original file | Final file |
|---|---|---|
| Filename | modeM0/AS1A14_057T04_9000006508_53896cztM0_level2.fits | modeM0/AS1A14_057T04_9000006508_53896cztM0_level2_quad_clean.evt |
| Size (bytes) | 949,680,000 | 95,201,280 |
| Size | 905.7 MB | 90.8 MB |
| Events in quadrant A | 4,131,665 | 757,210 |
| Events in quadrant B | 4,954,117 | 794,371 |
| Events in quadrant C | 6,709,376 | 690,454 |
| Events in quadrant D | 18,720,976 | 70,184 |
| Mode M0 | |||
|---|---|---|---|
| Quadrant | BADHDUFLAG | Total packets | Discarded packets |
| A | 0 | 18290 | 2 |
| B | 0 | 20259 | 2 |
| C | 0 | 25735 | 2 |
| D | 0 | 61263 | 6 |
| Mode SS | |||
|---|---|---|---|
| Quadrant | BADHDUFLAG | Total packets | Discarded packets |
| A | 0 | 166 | 0 |
| B | 0 | 166 | 0 |
| C | 0 | 166 | 0 |
| D | 0 | 166 | 0 |
| Mode M9 | |||
|---|---|---|---|
| Quadrant | BADHDUFLAG | Total packets | Discarded packets |
| A | 0 | 2 | 0 |
| B | 0 | 2 | 0 |
| C | 0 | 2 | 0 |
| D | 0 | 2 | 0 |
| Quadrant | Total seconds | Saturated seconds | Saturation percentage |
|---|---|---|---|
| A | 8209 | 297 | 3.617980% |
| B | 8210 | 469 | 5.712546% |
| C | 8210 | 788 | 9.598051% |
| D | 8209 | 7570 | 92.215861% |
Noise dominated data is calculated using 1-second bins in cleaned event files. If a bin has >2000 counts, and if more than 50% of those come from <1% of pixels, then it is considered to be noise-dominated and hence unusable.
| Quadrant | # 1 sec bins | Bins with >0 counts | Bins with >2000 counts | High rate bins dominated by noise | Noise dominated (total time) | Noise dominated (detector-on time) | Marked lightcurve |
|---|---|---|---|---|---|---|---|
| A | 8319 | 8211 | 80 | 80 | 0.96% | 0.97% | 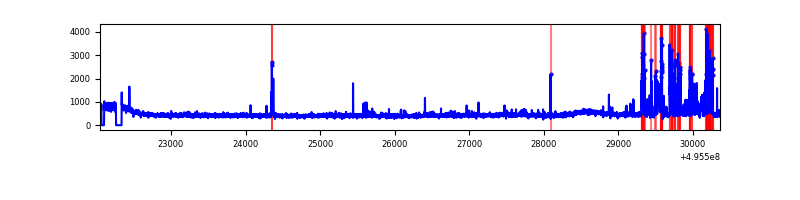 |
| B | 8320 | 8212 | 100 | 100 | 1.20% | 1.22% | 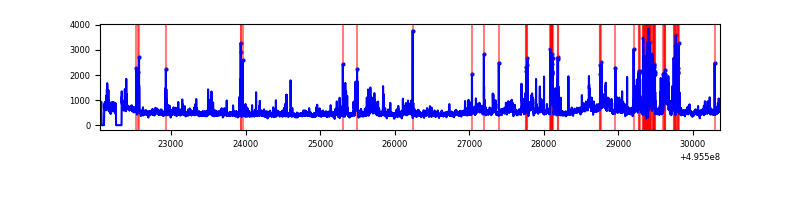 |
| C | 8320 | 8212 | 522 | 522 | 6.27% | 6.36% | 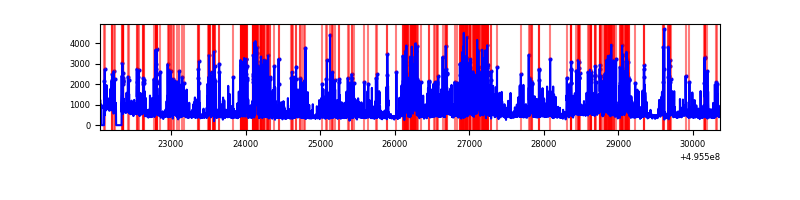 |
| D | 8318 | 8208 | 6106 | 6106 | 73.41% | 74.39% | 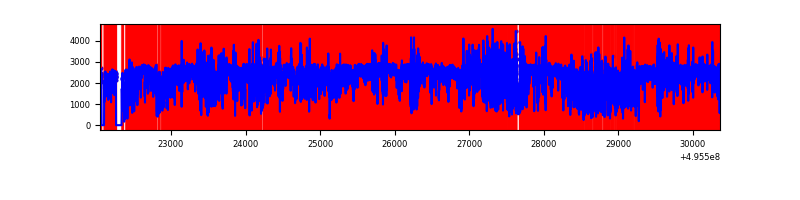 |
Top three noisy pixels from each quadrant. If the there are fewer than three noisy pixels in the level2.evt file, extra rows are filled as -1
| Pixel properties | Quadrant properties | ||||||
|---|---|---|---|---|---|---|---|
| Quadrant | DetID | PixID | Counts | Sigma | Mean | Median | Sigma |
| A | 0 | 8 | 463985 | 2053.49 | 915 | 890 | 225.5 |
| A | 15 | 174 | 40542 | 175.83 | 915 | 890 | 225.5 |
| A | 4 | 249 | 40306 | 174.78 | 915 | 890 | 225.5 |
| B | 0 | 213 | 579202 | 2987.29 | 897 | 865 | 193.6 |
| B | 7 | 0 | 458006 | 2361.27 | 897 | 865 | 193.6 |
| B | 4 | 171 | 73984 | 377.68 | 897 | 865 | 193.6 |
| C | 15 | 224 | 2947652 | 12400.37 | 865 | 857 | 237.6 |
| C | 5 | 10 | 129777 | 542.5 | 865 | 857 | 237.6 |
| C | 12 | 254 | 65130 | 270.46 | 865 | 857 | 237.6 |
| D | 8 | 176 | 16670849 | 225354.28 | 250 | 238 | 74.0 |
| D | 6 | 239 | 597910 | 8079.36 | 250 | 238 | 74.0 |
| D | 3 | 224 | 198403 | 2678.81 | 250 | 238 | 74.0 |
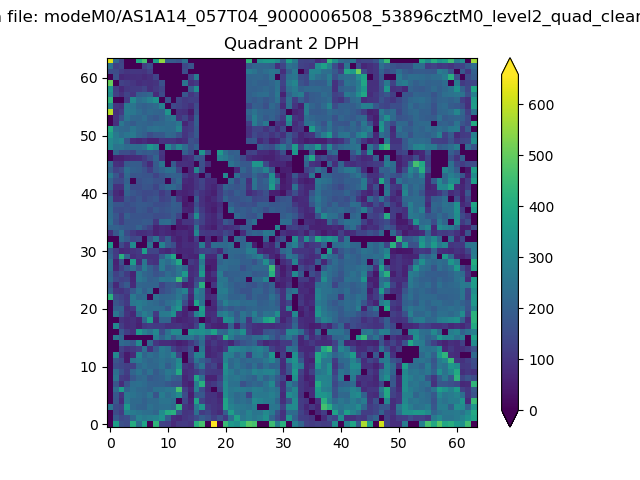
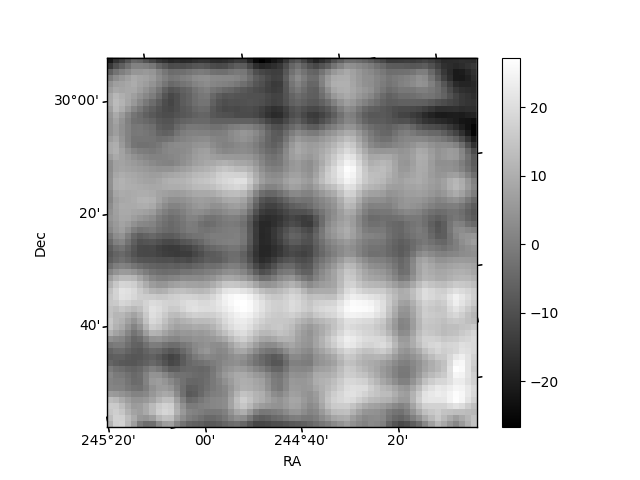
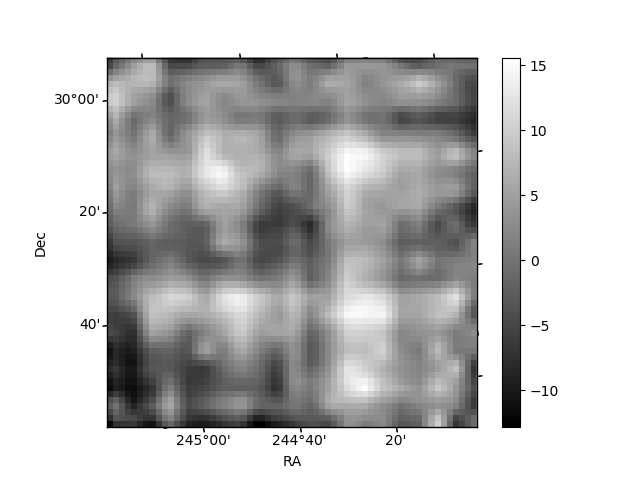
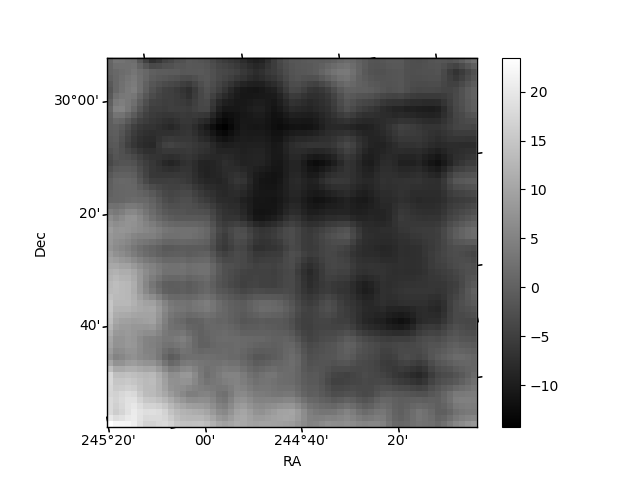
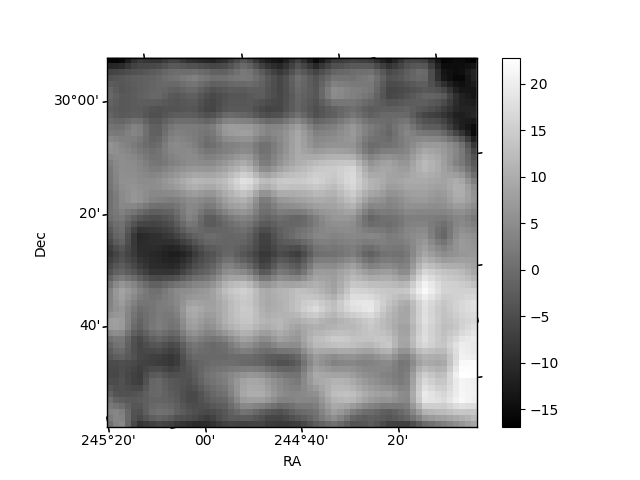
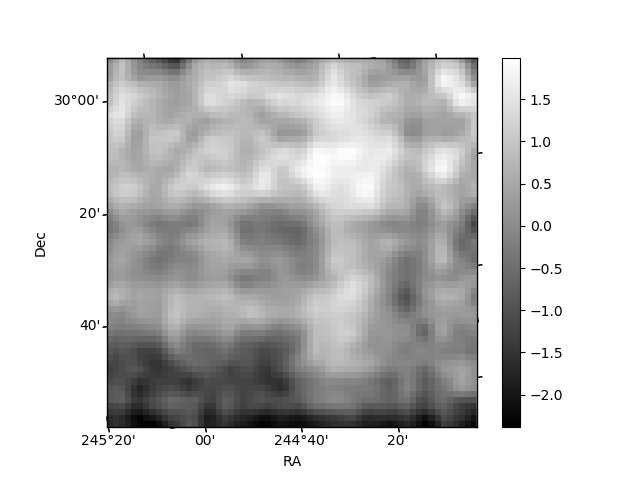
Histogram calculated using DETX and DETY for each event in the final _common_clean file
| Quadrant A | 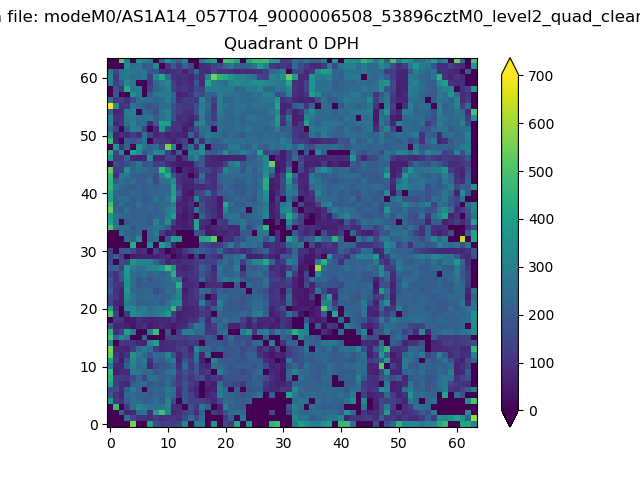 |
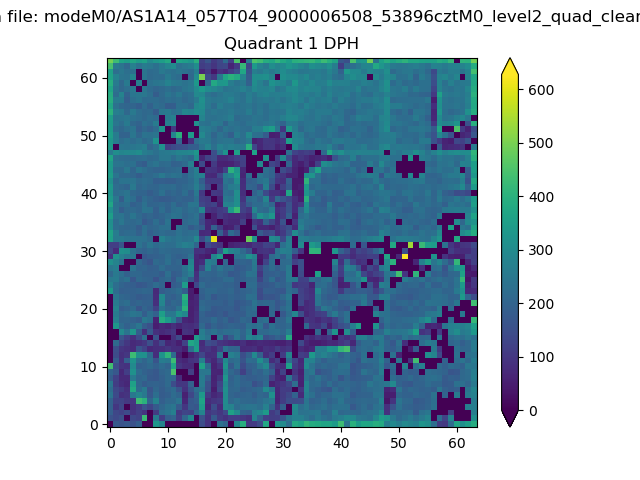 |
Quadrant B |
|---|---|---|---|
| Quadrant D | 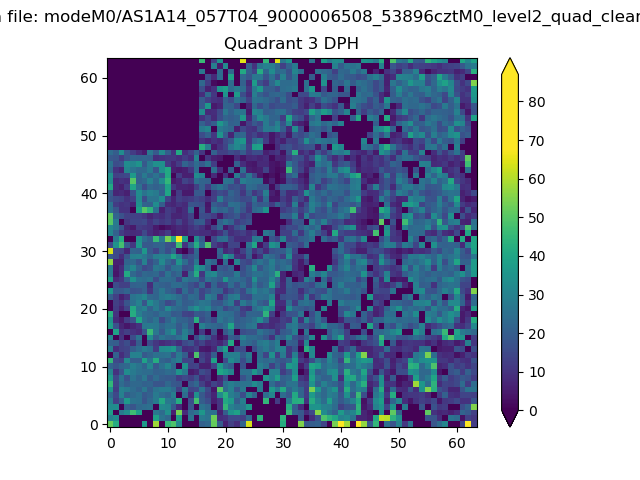 |
 |
Quadrant C |
| Plot type | Count rate plots | Images |
|---|---|---|
| Comparison with Poisson distribution Blue bars denote a histogram of data divided into 1 sec bins. Red curve is a Poisson curve with rate = median count rate of data. |
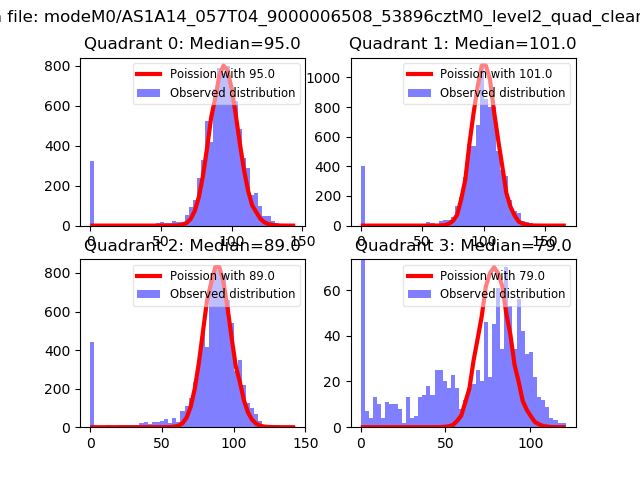 |
 |
| Quadrant-wise count rates Data is divided into 100 sec bins |
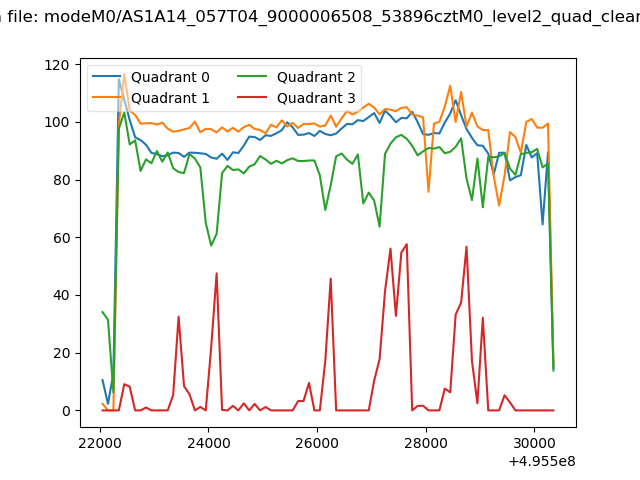 |
|
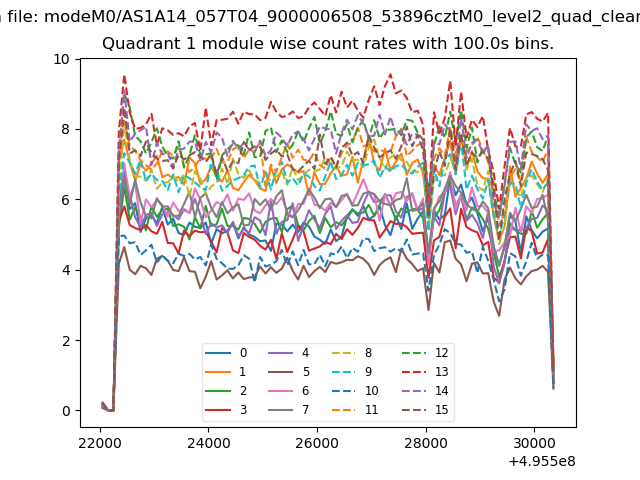
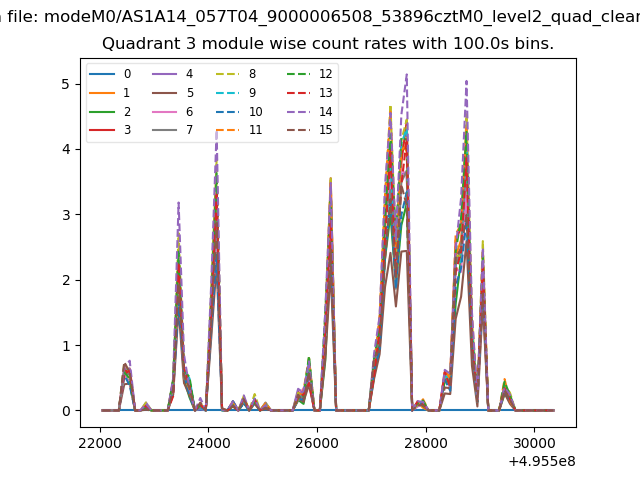
| Module-wise count rates for Quadrant A Data is divided into 100 sec bins |
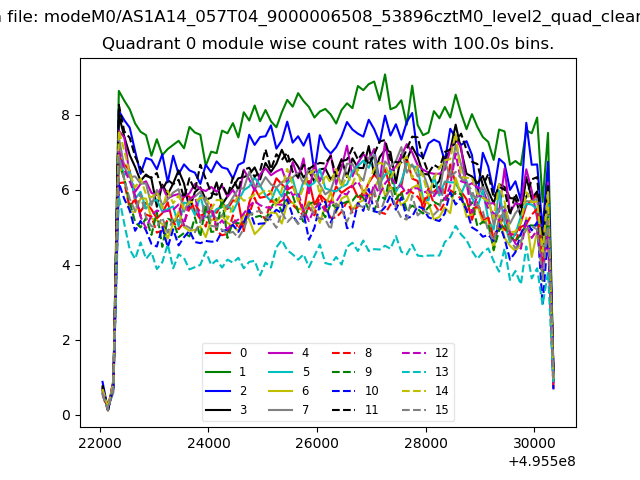 |
 |
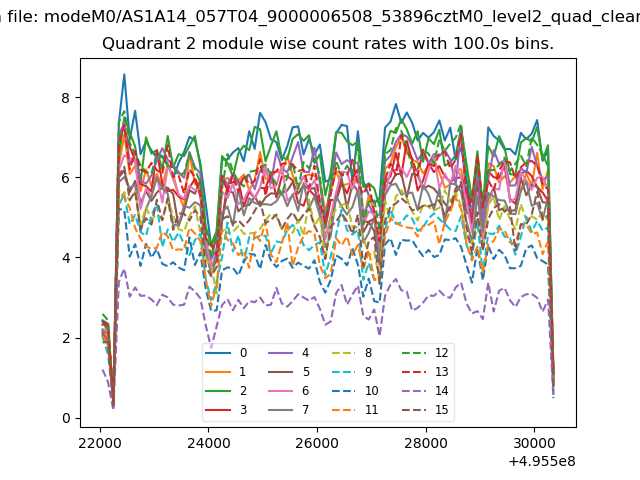
| Module-wise count rates for Quadrant B Data is divided into 100 sec bins |
 |
 |
| Module-wise count rates for Quadrant C Data is divided into 100 sec bins |
 |
 |
| Module-wise count rates for Quadrant D Data is divided into 100 sec bins |
 |
 |
| Parameter | Plot |
|---|---|
| CZT HV Monitor | 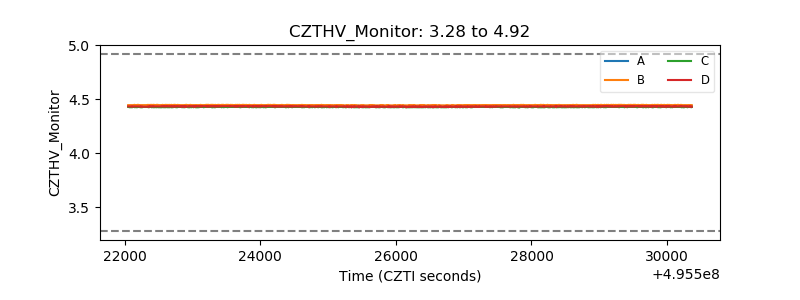 |
| D_VDD | 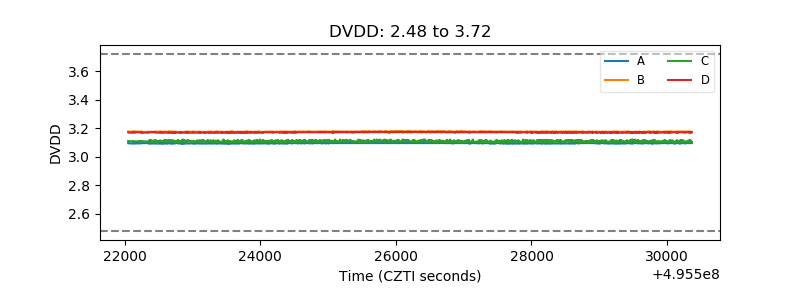 |
| Temperature 1 | 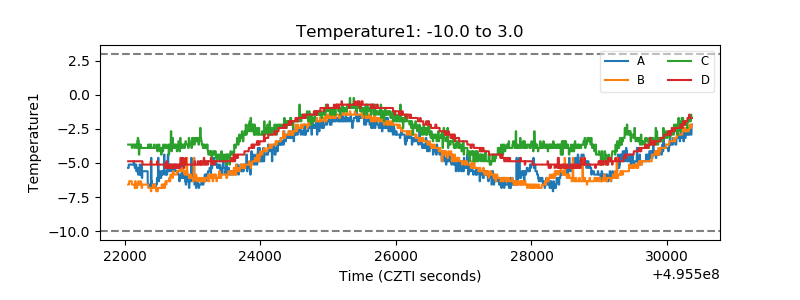 |
| Veto HV Monitor | 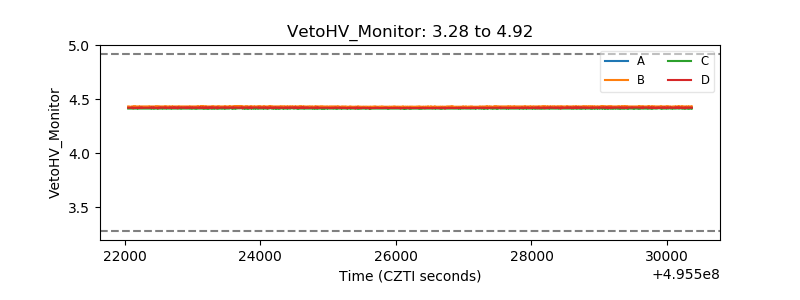 |
| Veto LLD | 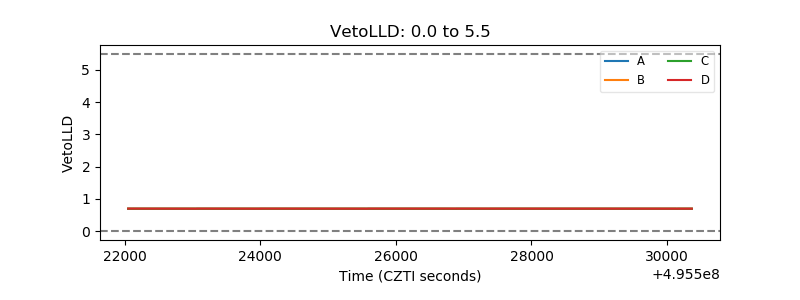 |
| Alpha Counter | 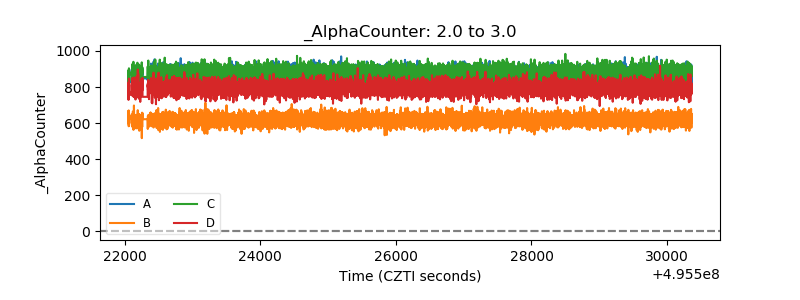 |
| _CPM_Rate | 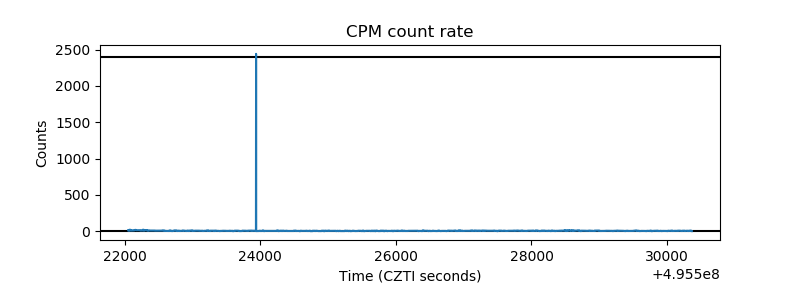 |
| CZT Counter | 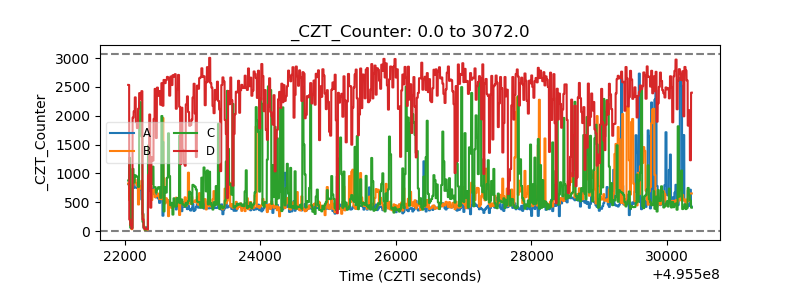 |
| +2.5 Volts monitor |  |
| +5 Volts monitor |  |
| _ROLL_ROT | 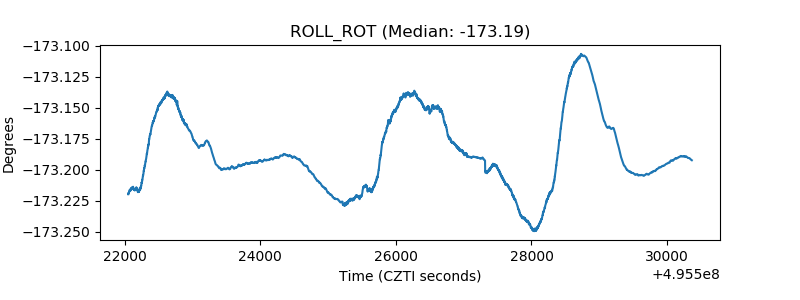 |
| _Roll_DEC | 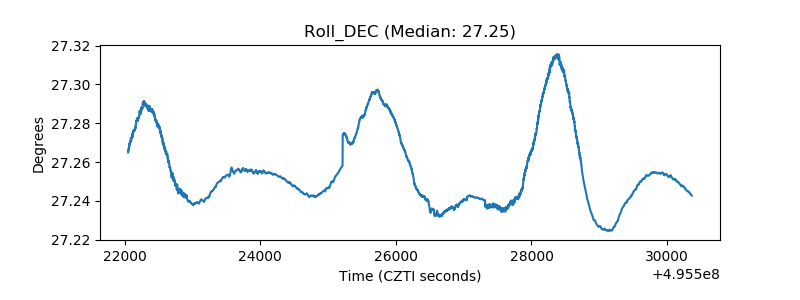 |
| _Roll_RA | 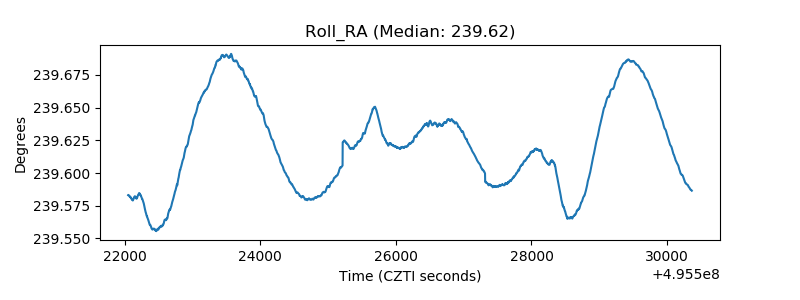 |
| Veto Counter | 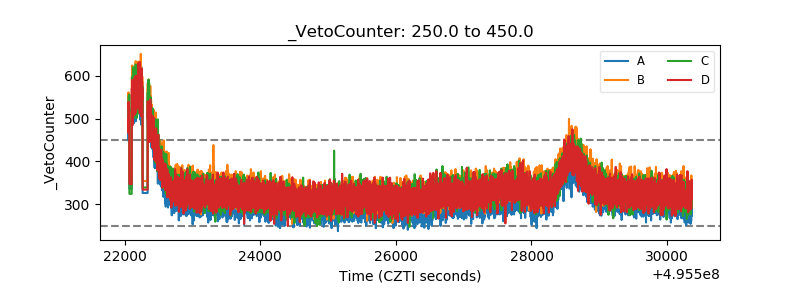 |