| Param | Original file | Final file |
|---|---|---|
| Filename | modeM0/AS1A14_057T04_9000006508_53897cztM0_level2.fits | modeM0/AS1A14_057T04_9000006508_53897cztM0_level2_quad_clean.evt |
| Size (bytes) | 813,337,920 | 82,200,960 |
| Size | 775.7 MB | 78.4 MB |
| Events in quadrant A | 3,542,410 | 657,377 |
| Events in quadrant B | 4,215,118 | 692,822 |
| Events in quadrant C | 6,142,179 | 569,499 |
| Events in quadrant D | 15,664,781 | 82,603 |
| Mode M0 | |||
|---|---|---|---|
| Quadrant | BADHDUFLAG | Total packets | Discarded packets |
| A | 0 | 15666 | 1 |
| B | 0 | 17197 | 0 |
| C | 0 | 23078 | 0 |
| D | 0 | 51306 | 0 |
| Mode SS | |||
|---|---|---|---|
| Quadrant | BADHDUFLAG | Total packets | Discarded packets |
| A | 0 | 140 | 0 |
| B | 0 | 140 | 0 |
| C | 0 | 140 | 0 |
| D | 0 | 140 | 0 |
| Quadrant | Total seconds | Saturated seconds | Saturation percentage |
|---|---|---|---|
| A | 6980 | 114 | 1.633238% |
| B | 6982 | 178 | 2.549413% |
| C | 6982 | 803 | 11.501003% |
| D | 6982 | 6195 | 88.728158% |
Noise dominated data is calculated using 1-second bins in cleaned event files. If a bin has >2000 counts, and if more than 50% of those come from <1% of pixels, then it is considered to be noise-dominated and hence unusable.
| Quadrant | # 1 sec bins | Bins with >0 counts | Bins with >2000 counts | High rate bins dominated by noise | Noise dominated (total time) | Noise dominated (detector-on time) | Marked lightcurve |
|---|---|---|---|---|---|---|---|
| A | 6981 | 6981 | 83 | 83 | 1.19% | 1.19% | 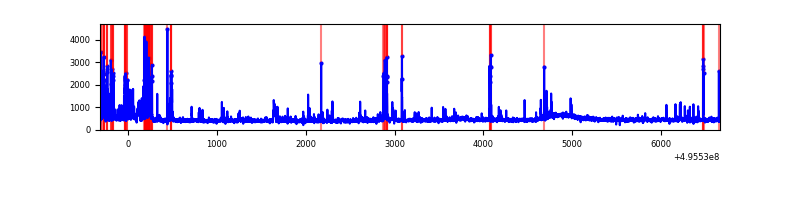 |
| B | 6982 | 6982 | 84 | 84 | 1.20% | 1.20% | 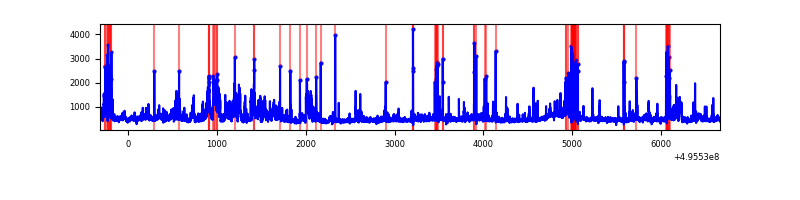 |
| C | 6982 | 6982 | 658 | 658 | 9.42% | 9.42% | 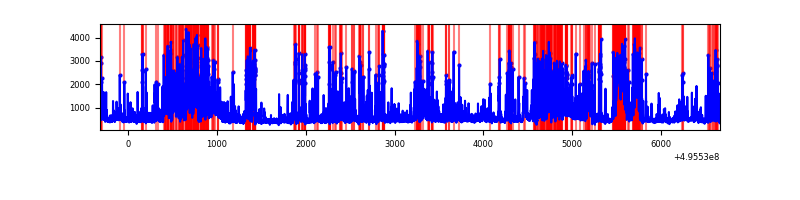 |
| D | 6981 | 6981 | 4968 | 4968 | 71.16% | 71.16% | 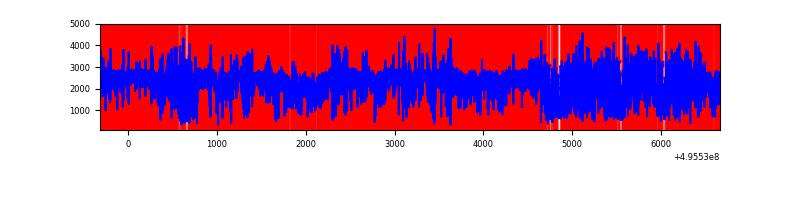 |
Top three noisy pixels from each quadrant. If the there are fewer than three noisy pixels in the level2.evt file, extra rows are filled as -1
| Pixel properties | Quadrant properties | ||||||
|---|---|---|---|---|---|---|---|
| Quadrant | DetID | PixID | Counts | Sigma | Mean | Median | Sigma |
| A | 0 | 8 | 364326 | 1935.31 | 757 | 737 | 187.9 |
| A | 4 | 249 | 44156 | 231.11 | 757 | 737 | 187.9 |
| A | 3 | 114 | 40414 | 211.19 | 757 | 737 | 187.9 |
| B | 7 | 0 | 519600 | 3246.11 | 741 | 715 | 159.8 |
| B | 0 | 213 | 324893 | 2028.04 | 741 | 715 | 159.8 |
| B | 4 | 171 | 98298 | 610.47 | 741 | 715 | 159.8 |
| C | 15 | 224 | 2517181 | 12994.27 | 696 | 689 | 193.7 |
| C | 13 | 3 | 449635 | 2318.2 | 696 | 689 | 193.7 |
| C | 15 | 147 | 215781 | 1110.66 | 696 | 689 | 193.7 |
| D | 8 | 176 | 14044979 | 182145.77 | 266 | 254 | 77.1 |
| D | 6 | 239 | 165364 | 2141.31 | 266 | 254 | 77.1 |
| D | 12 | 6 | 121766 | 1575.89 | 266 | 254 | 77.1 |
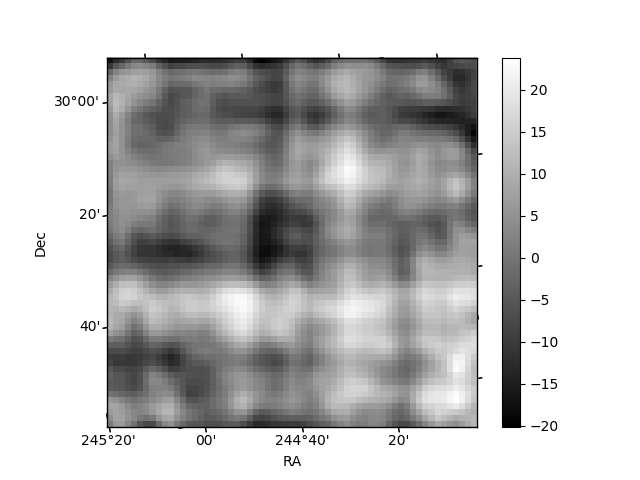
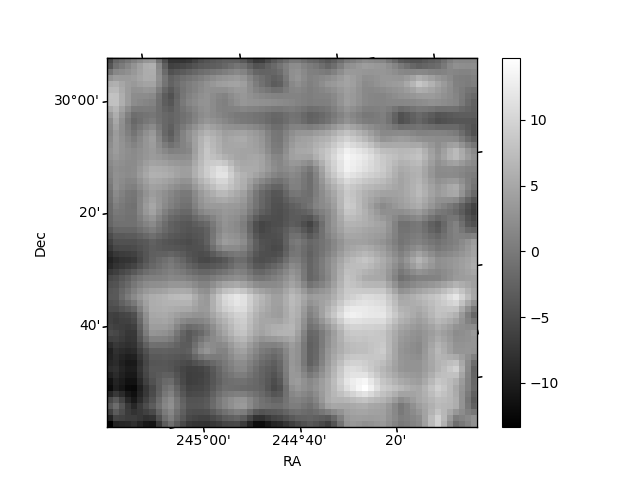
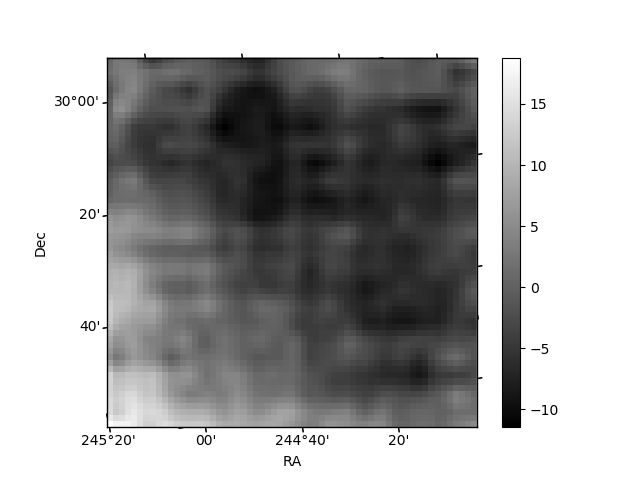
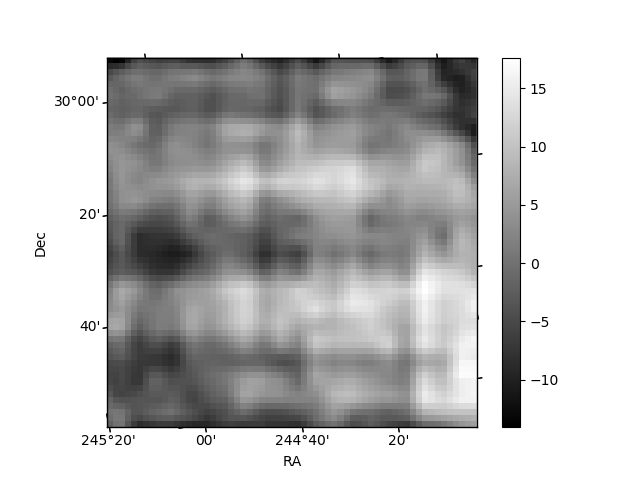
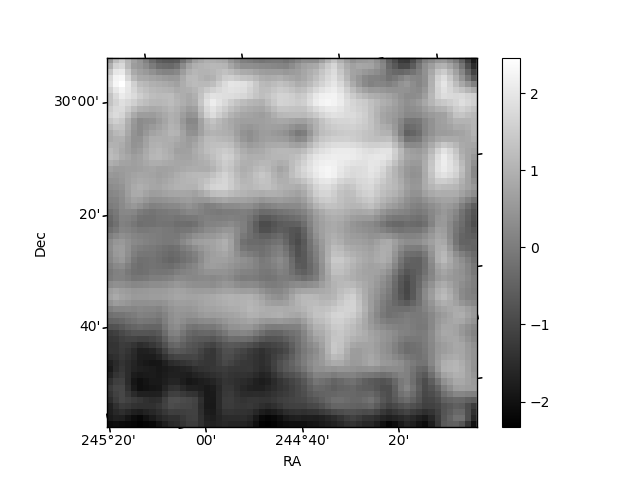
Histogram calculated using DETX and DETY for each event in the final _common_clean file
| Quadrant A | 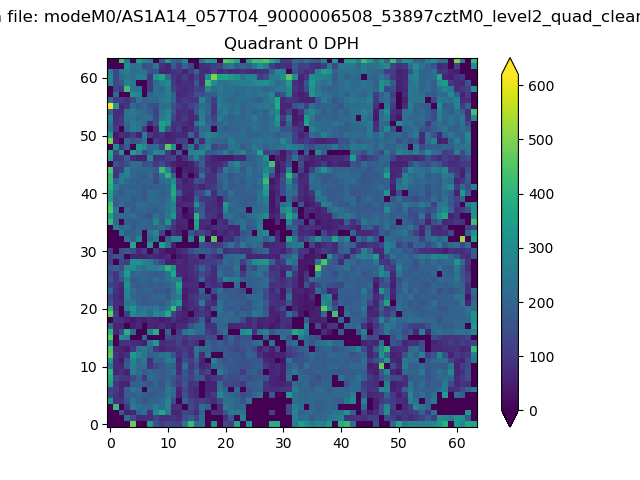 |
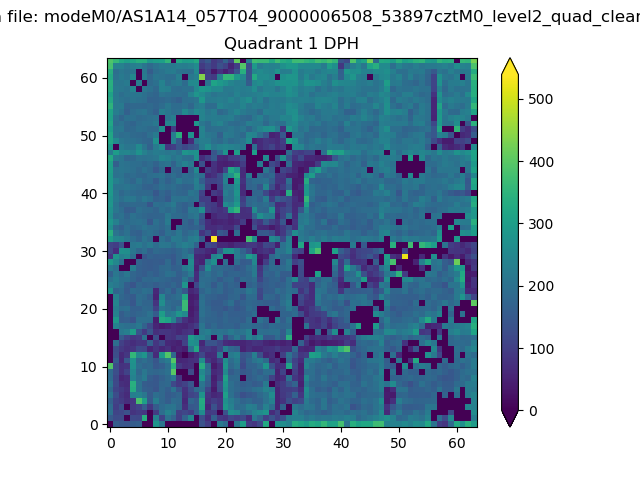 |
Quadrant B |
|---|---|---|---|
| Quadrant D | 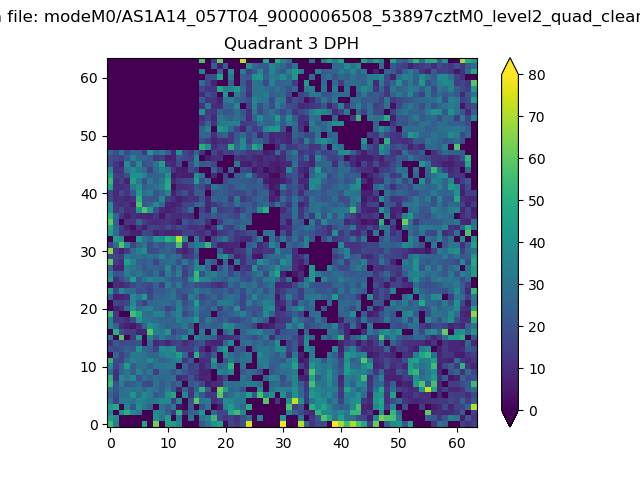 |
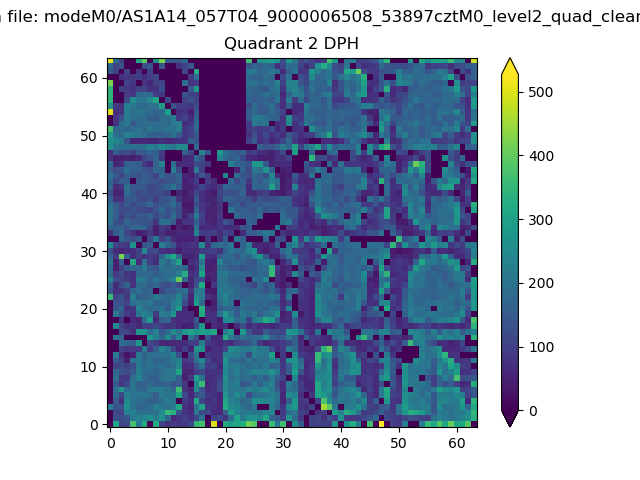 |
Quadrant C |
| Plot type | Count rate plots | Images |
|---|---|---|
| Comparison with Poisson distribution Blue bars denote a histogram of data divided into 1 sec bins. Red curve is a Poisson curve with rate = median count rate of data. |
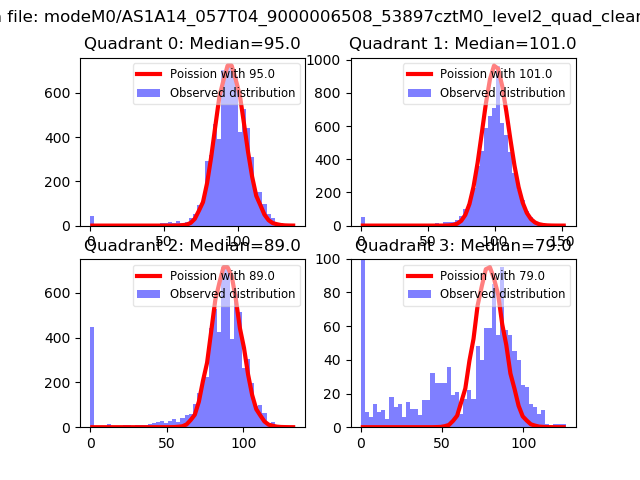 |
 |
| Quadrant-wise count rates Data is divided into 100 sec bins |
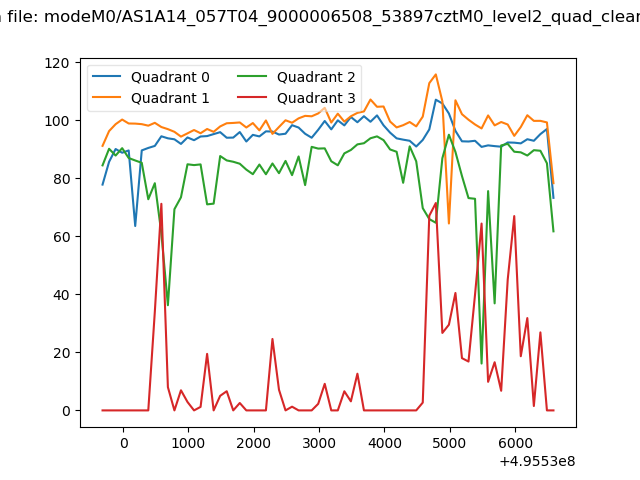 |
|
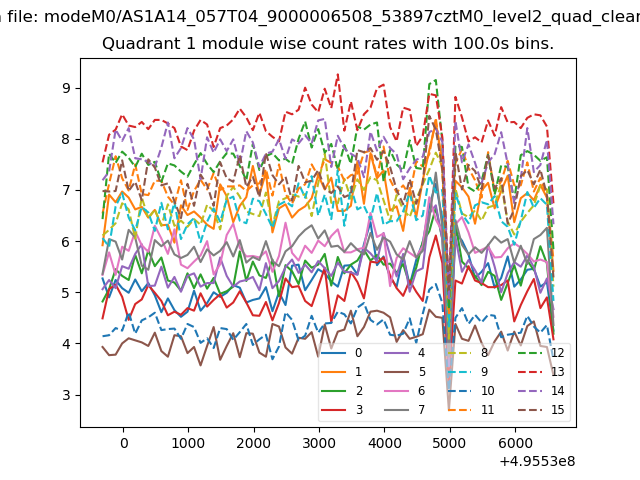
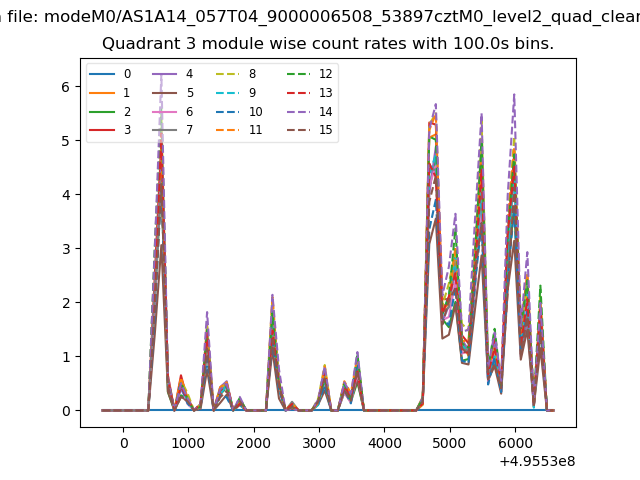
| Module-wise count rates for Quadrant A Data is divided into 100 sec bins |
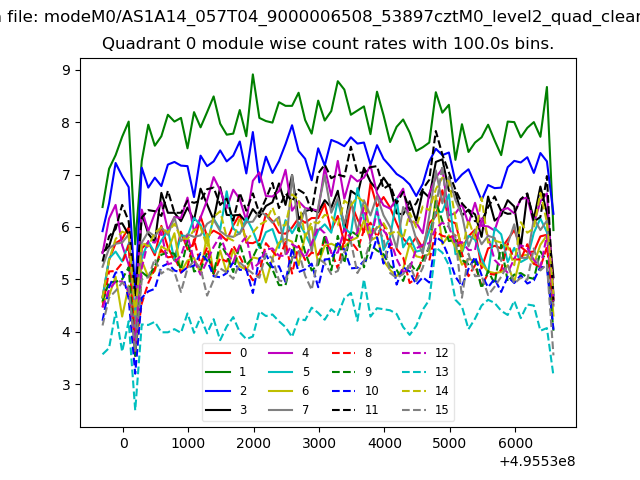 |
 |
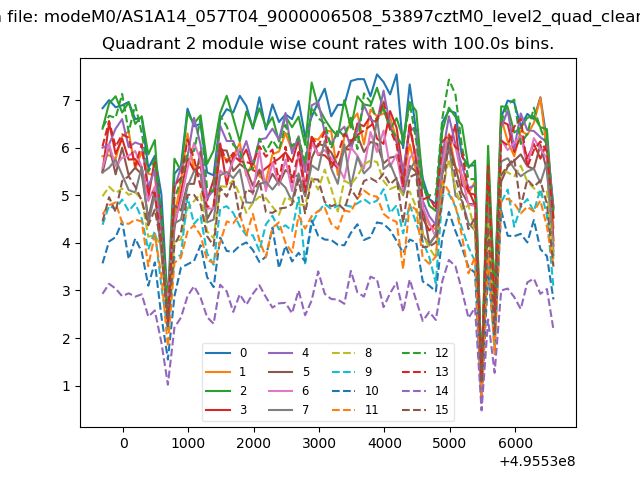
| Module-wise count rates for Quadrant B Data is divided into 100 sec bins |
 |
 |
| Module-wise count rates for Quadrant C Data is divided into 100 sec bins |
 |
 |
| Module-wise count rates for Quadrant D Data is divided into 100 sec bins |
 |
 |
| Parameter | Plot |
|---|---|
| CZT HV Monitor | 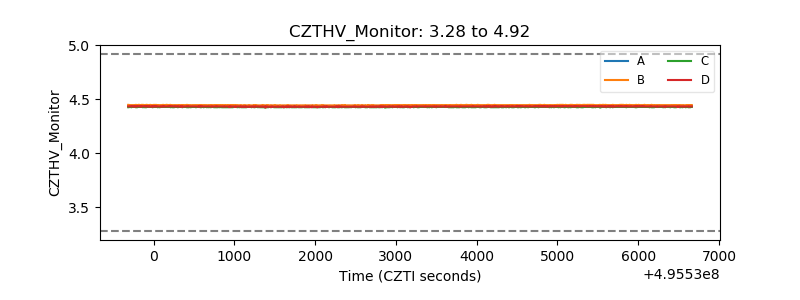 |
| D_VDD | 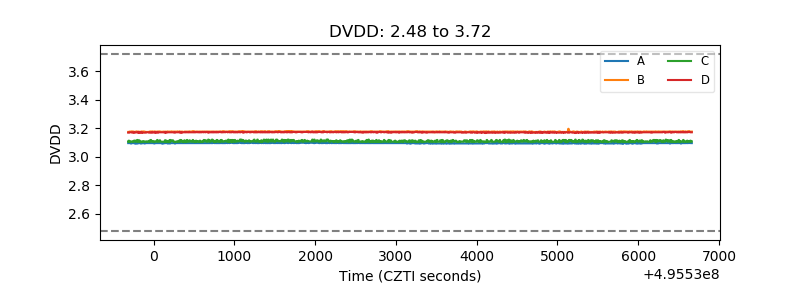 |
| Temperature 1 | 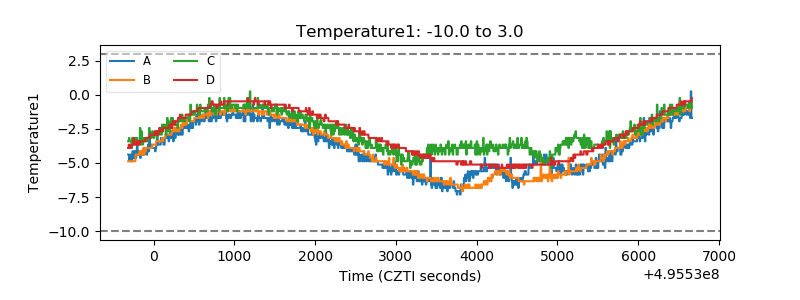 |
| Veto HV Monitor | 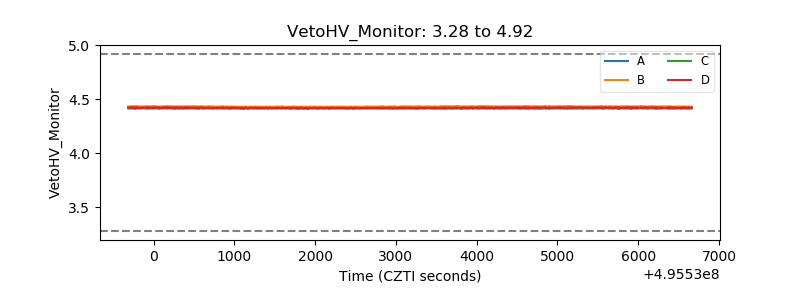 |
| Veto LLD | 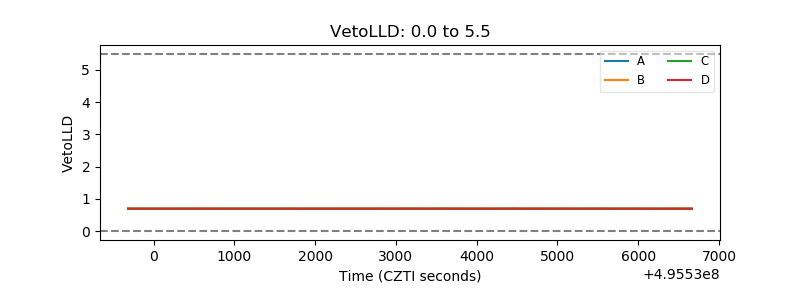 |
| Alpha Counter |  |
| _CPM_Rate | 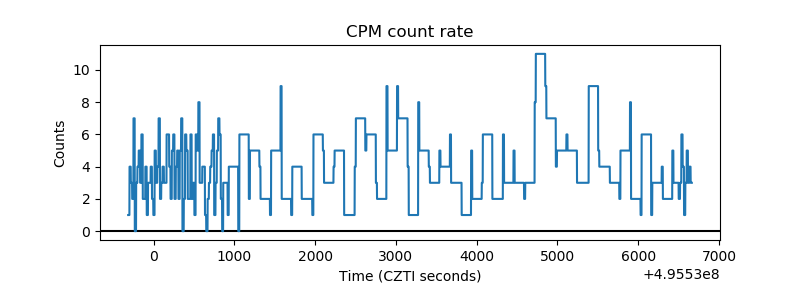 |
| CZT Counter | 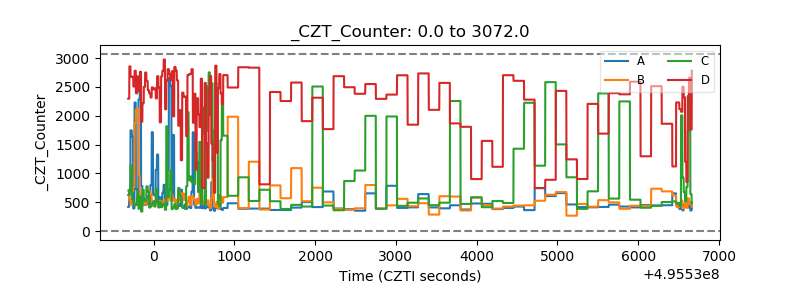 |
| +2.5 Volts monitor |  |
| +5 Volts monitor |  |
| _ROLL_ROT | 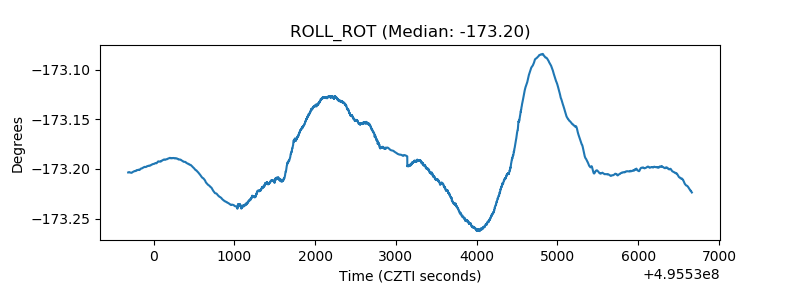 |
| _Roll_DEC | 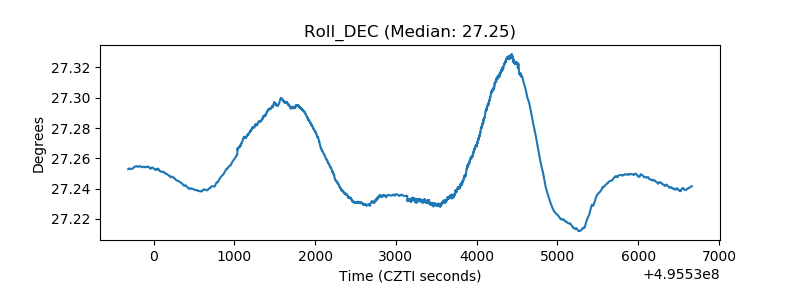 |
| _Roll_RA | 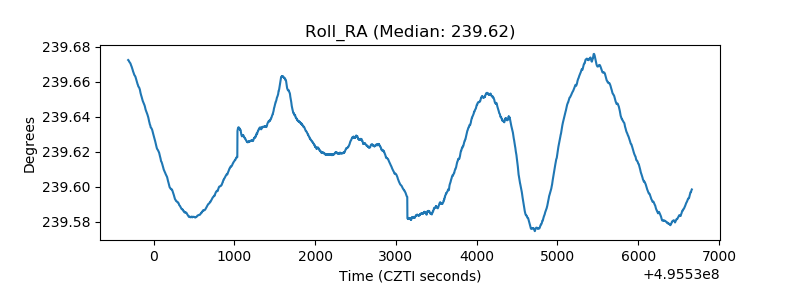 |
| Veto Counter | 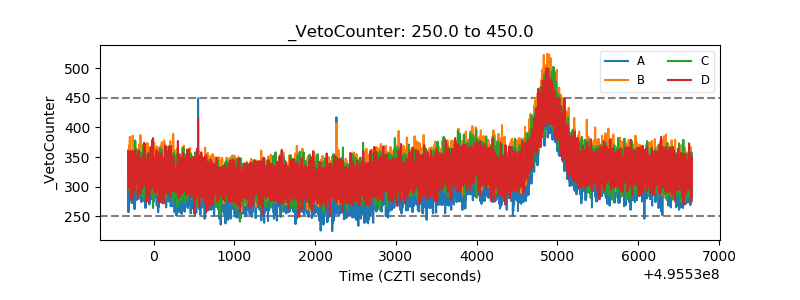 |