| Param | Original file | Final file |
|---|---|---|
| Filename | modeM0/AS1A14_057T04_9000006508_53903cztM0_level2.fits | modeM0/AS1A14_057T04_9000006508_53903cztM0_level2_quad_clean.evt |
| Size (bytes) | 709,004,160 | 73,385,280 |
| Size | 676.2 MB | 70.0 MB |
| Events in quadrant A | 3,593,198 | 598,219 |
| Events in quadrant B | 3,629,359 | 641,240 |
| Events in quadrant C | 6,711,992 | 500,850 |
| Events in quadrant D | 11,821,089 | 42,487 |
| Mode M0 | |||
|---|---|---|---|
| Quadrant | BADHDUFLAG | Total packets | Discarded packets |
| A | 0 | 15361 | 1 |
| B | 0 | 14960 | 1 |
| C | 0 | 24322 | 1 |
| D | 0 | 39484 | 8 |
| Mode SS | |||
|---|---|---|---|
| Quadrant | BADHDUFLAG | Total packets | Discarded packets |
| A | 0 | 130 | 0 |
| B | 0 | 130 | 0 |
| C | 0 | 130 | 0 |
| D | 0 | 130 | 0 |
| Mode M9 | |||
|---|---|---|---|
| Quadrant | BADHDUFLAG | Total packets | Discarded packets |
| A | 0 | 9 | 0 |
| B | 0 | 9 | 0 |
| C | 0 | 9 | 0 |
| D | 0 | 9 | 0 |
| Quadrant | Total seconds | Saturated seconds | Saturation percentage |
|---|---|---|---|
| A | 6282 | 217 | 3.454314% |
| B | 6283 | 69 | 1.098201% |
| C | 6283 | 1021 | 16.250199% |
| D | 6282 | 5869 | 93.425661% |
Noise dominated data is calculated using 1-second bins in cleaned event files. If a bin has >2000 counts, and if more than 50% of those come from <1% of pixels, then it is considered to be noise-dominated and hence unusable.
| Quadrant | # 1 sec bins | Bins with >0 counts | Bins with >2000 counts | High rate bins dominated by noise | Noise dominated (total time) | Noise dominated (detector-on time) | Marked lightcurve |
|---|---|---|---|---|---|---|---|
| A | 7262 | 6283 | 172 | 172 | 2.37% | 2.74% | 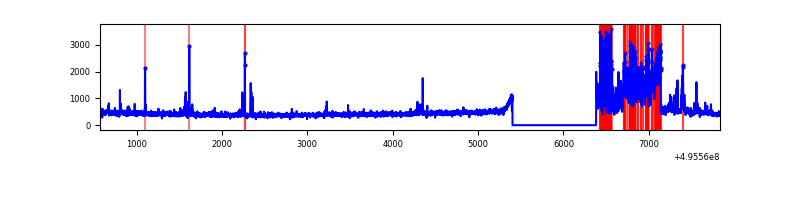 |
| B | 7263 | 6284 | 14 | 14 | 0.19% | 0.22% | 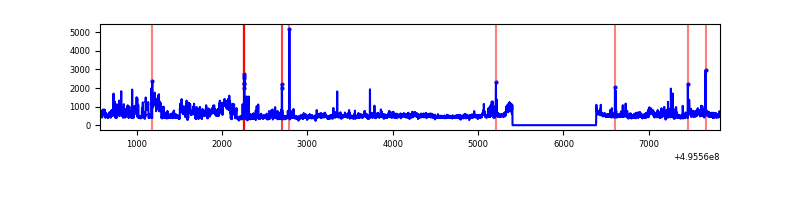 |
| C | 7263 | 6284 | 868 | 868 | 11.95% | 13.81% | 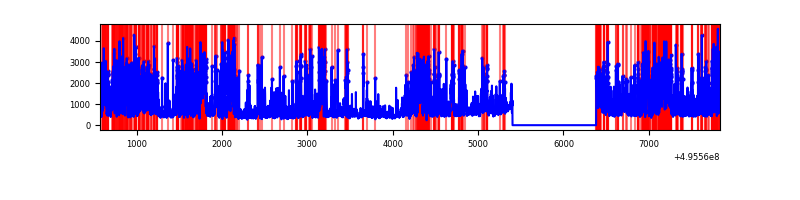 |
| D | 7261 | 6281 | 3239 | 3239 | 44.61% | 51.57% | 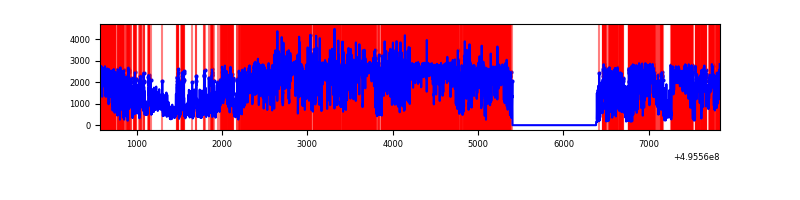 |
Top three noisy pixels from each quadrant. If the there are fewer than three noisy pixels in the level2.evt file, extra rows are filled as -1
| Pixel properties | Quadrant properties | ||||||
|---|---|---|---|---|---|---|---|
| Quadrant | DetID | PixID | Counts | Sigma | Mean | Median | Sigma |
| A | 12 | 115 | 709252 | 4313.61 | 668 | 651 | 164.3 |
| A | 10 | 253 | 88517 | 534.88 | 668 | 651 | 164.3 |
| A | 8 | 249 | 55376 | 333.14 | 668 | 651 | 164.3 |
| B | 5 | 250 | 497393 | 3490.16 | 665 | 640 | 142.3 |
| B | 7 | 0 | 183692 | 1286.11 | 665 | 640 | 142.3 |
| B | 10 | 247 | 72954 | 508.07 | 665 | 640 | 142.3 |
| C | 15 | 224 | 3498932 | 20683.56 | 612 | 606 | 169.1 |
| C | 2 | 12 | 276610 | 1631.85 | 612 | 606 | 169.1 |
| C | 12 | 254 | 132689 | 780.93 | 612 | 606 | 169.1 |
| D | 8 | 176 | 11150089 | 277396.1 | 137 | 130 | 40.2 |
| D | 10 | 172 | 23410 | 579.18 | 137 | 130 | 40.2 |
| D | 6 | 239 | 19731 | 487.65 | 137 | 130 | 40.2 |
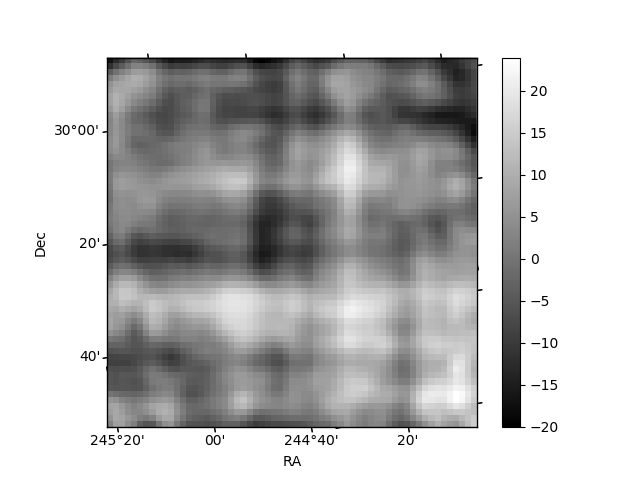
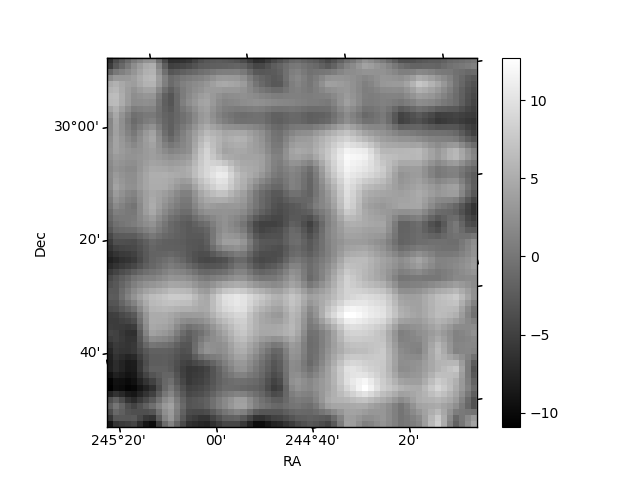
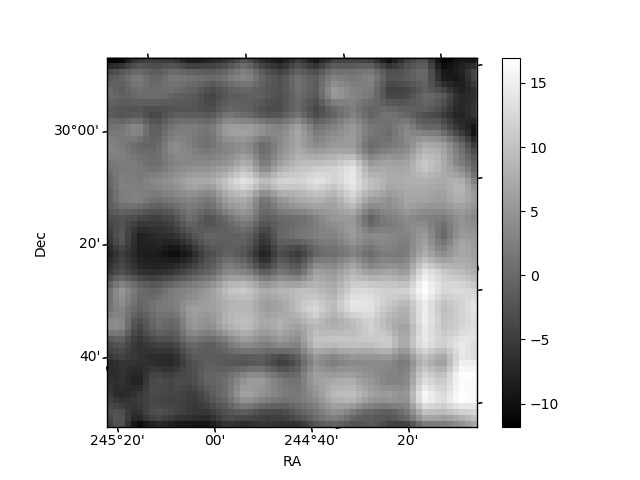
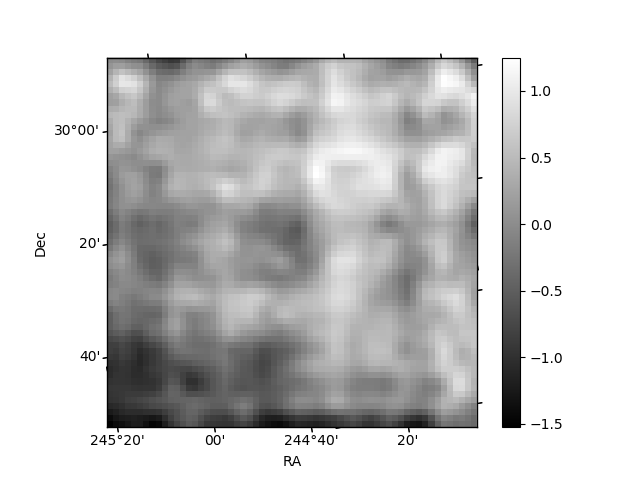
Histogram calculated using DETX and DETY for each event in the final _common_clean file
| Quadrant A | 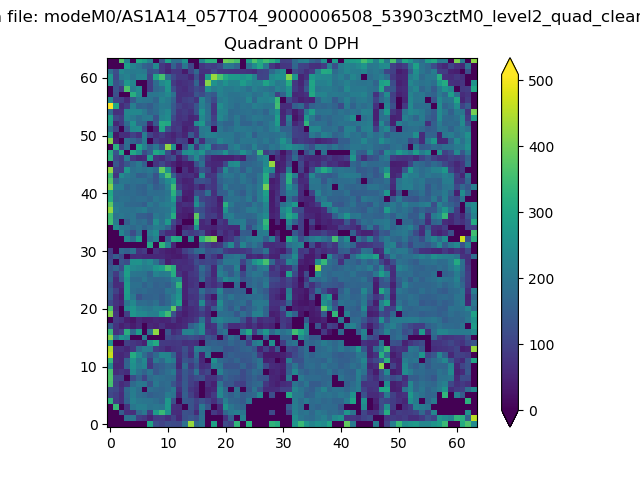 |
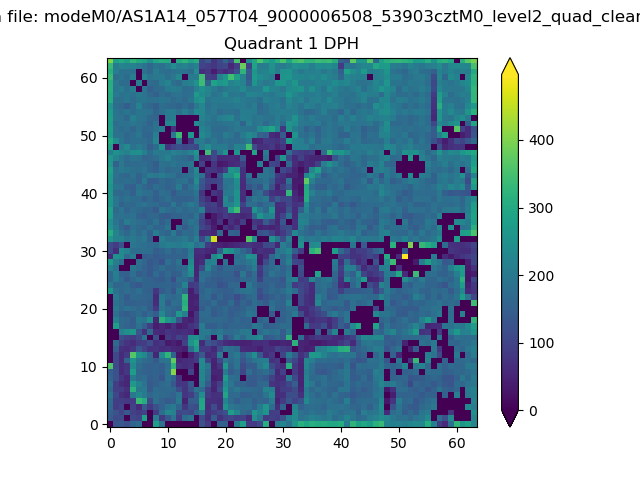 |
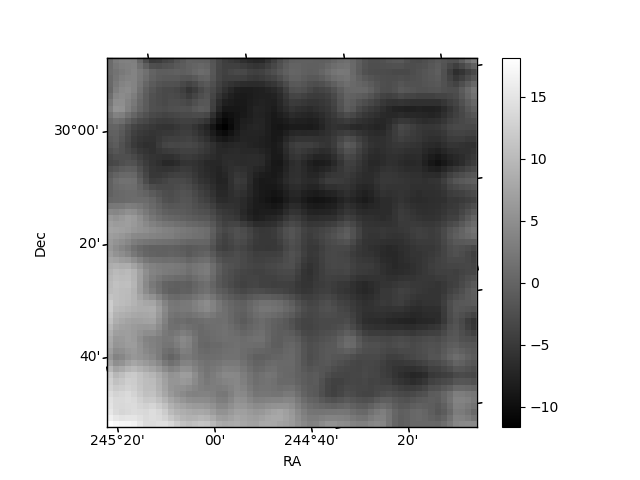
Quadrant B |
|---|---|---|---|
| Quadrant D | 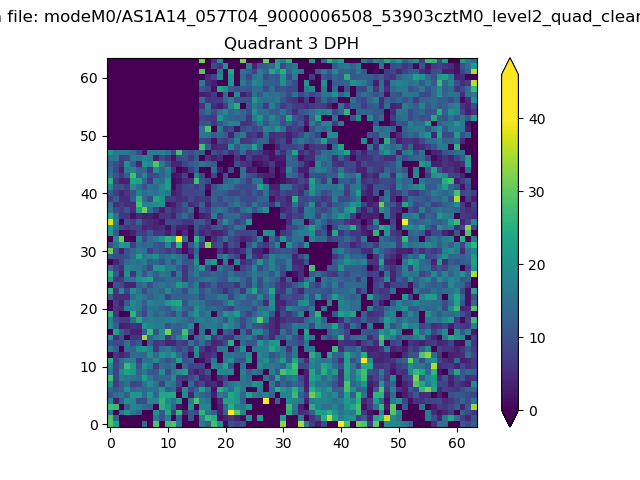 |
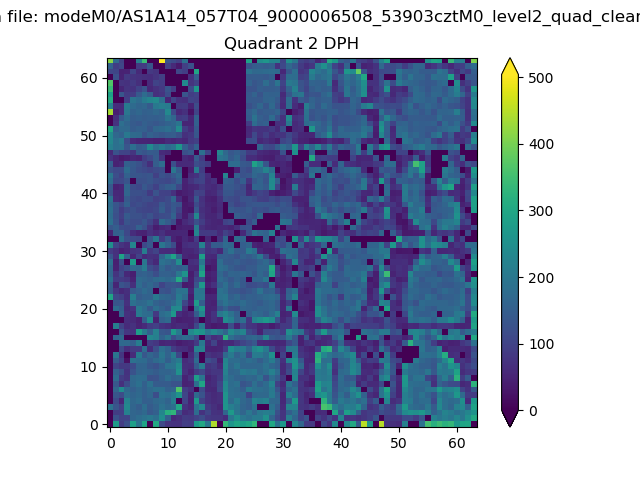 |
Quadrant C |
| Plot type | Count rate plots | Images |
|---|---|---|
| Comparison with Poisson distribution Blue bars denote a histogram of data divided into 1 sec bins. Red curve is a Poisson curve with rate = median count rate of data. |
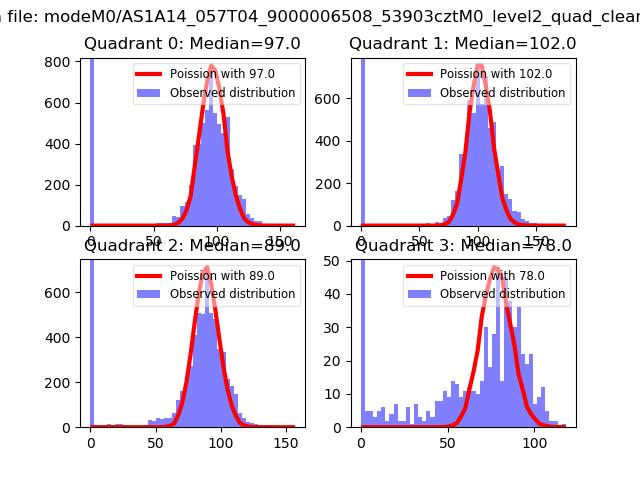 |
 |
| Quadrant-wise count rates Data is divided into 100 sec bins |
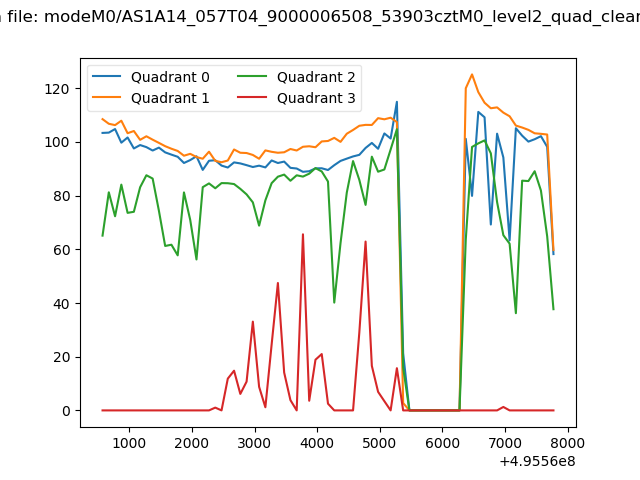 |
|
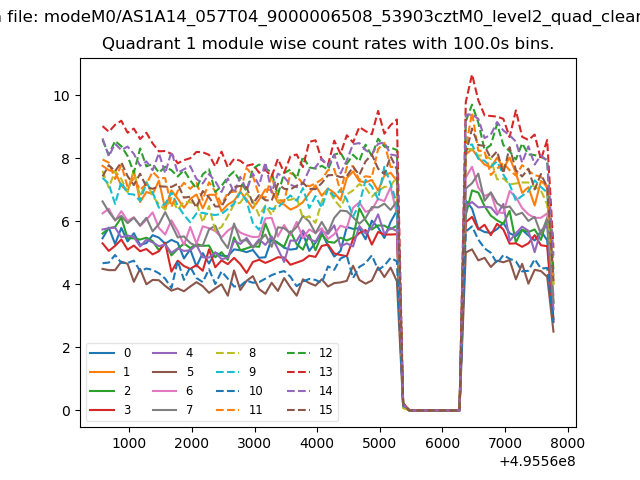
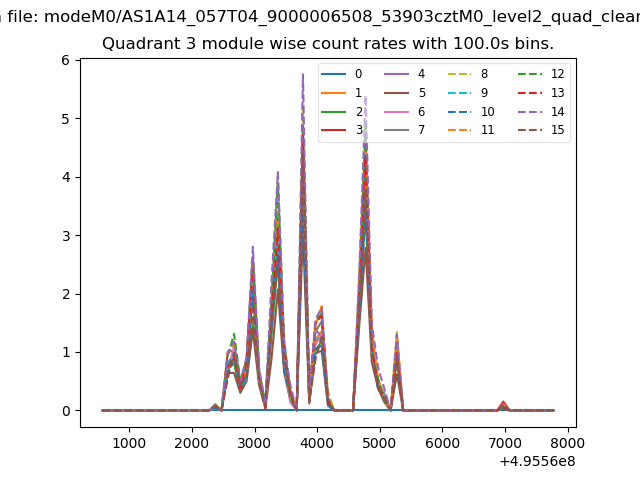
| Module-wise count rates for Quadrant A Data is divided into 100 sec bins |
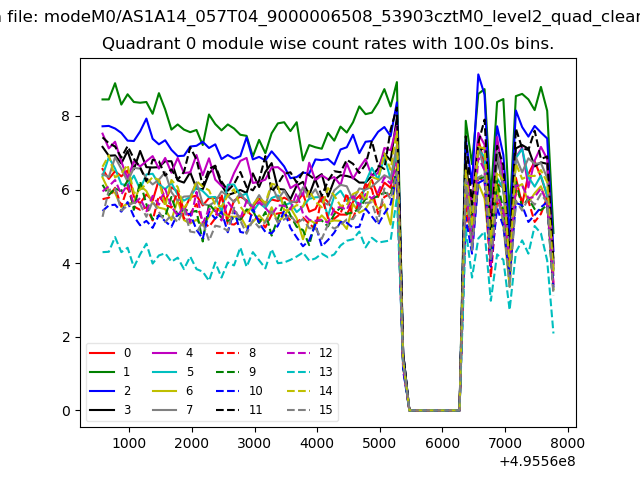 |
 |
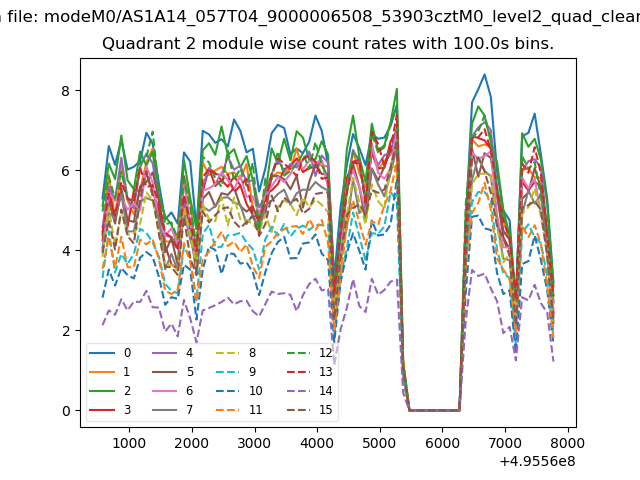
| Module-wise count rates for Quadrant B Data is divided into 100 sec bins |
 |
 |
| Module-wise count rates for Quadrant C Data is divided into 100 sec bins |
 |
 |
| Module-wise count rates for Quadrant D Data is divided into 100 sec bins |
 |
 |
| Parameter | Plot |
|---|---|
| CZT HV Monitor | 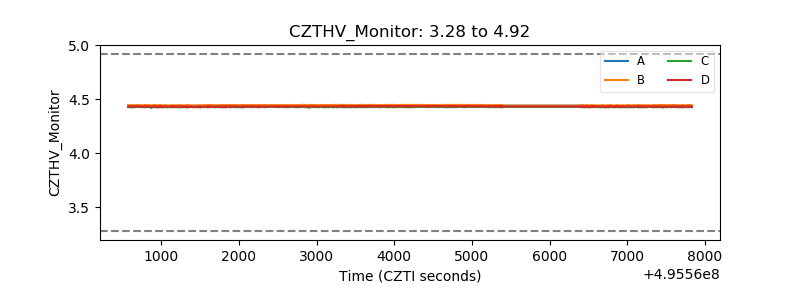 |
| D_VDD | 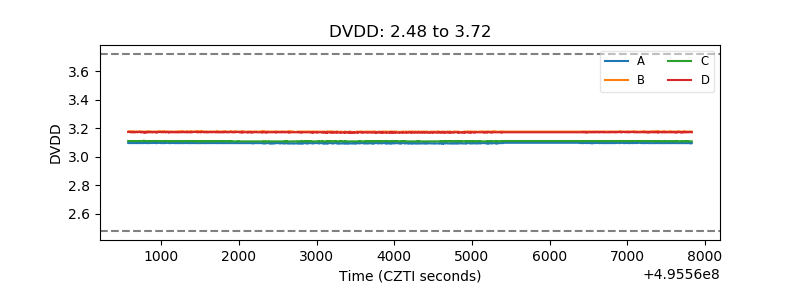 |
| Temperature 1 | 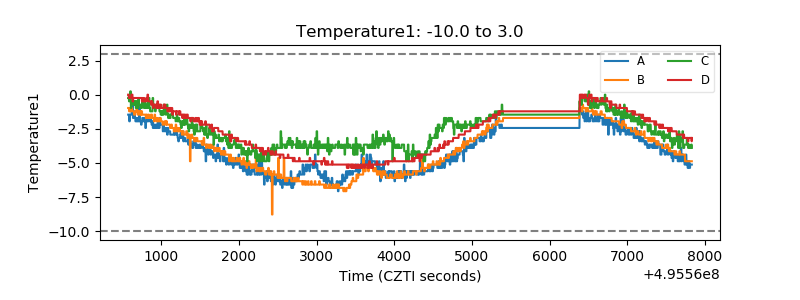 |
| Veto HV Monitor | 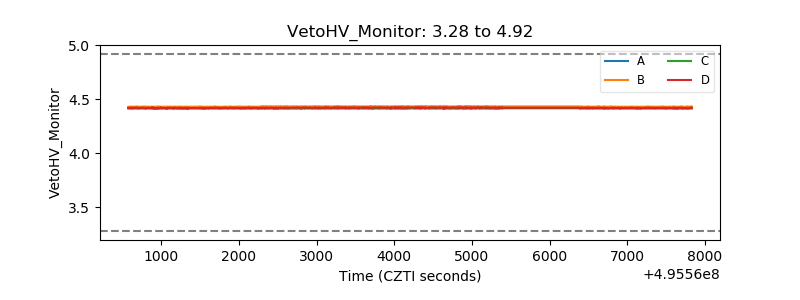 |
| Veto LLD | 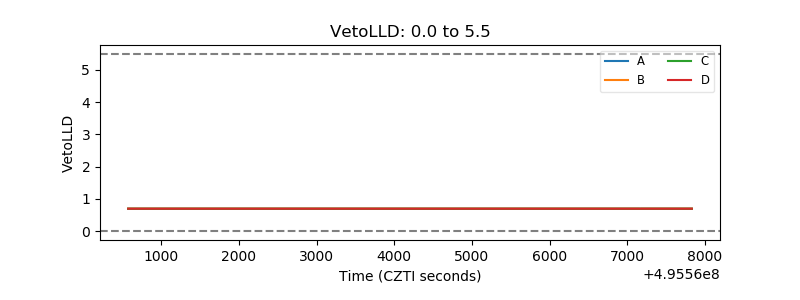 |
| Alpha Counter | 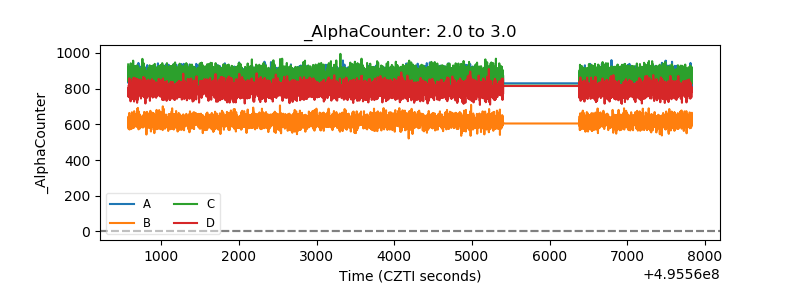 |
| _CPM_Rate | 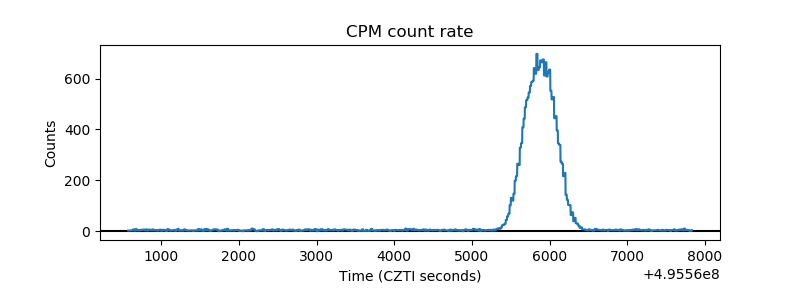 |
| CZT Counter | 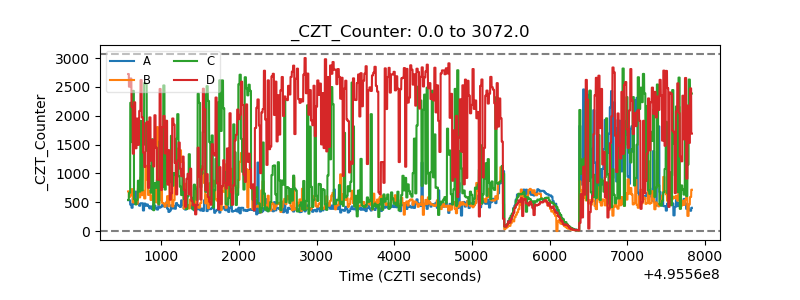 |
| +2.5 Volts monitor | 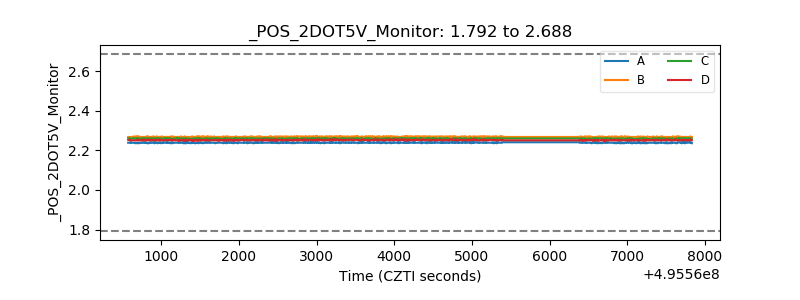 |
| +5 Volts monitor |  |
| _ROLL_ROT | 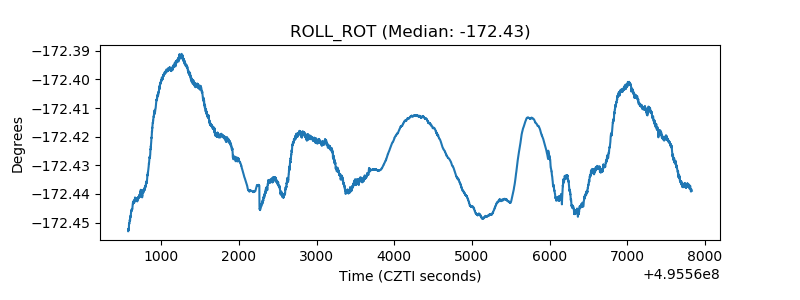 |
| _Roll_DEC | 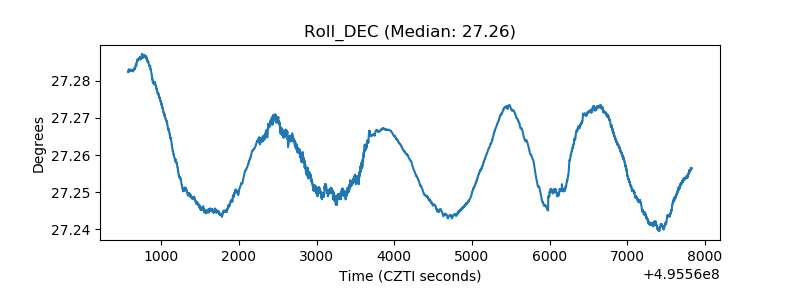 |
| _Roll_RA | 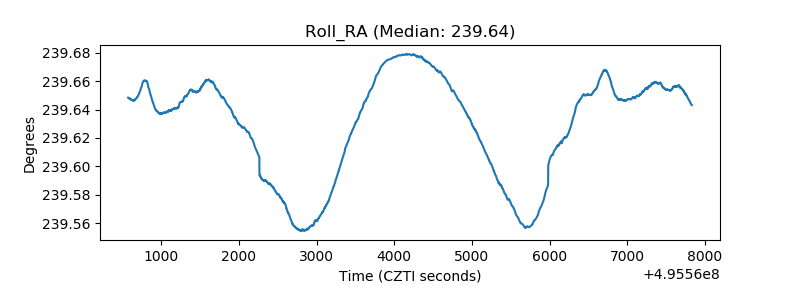 |
| Veto Counter | 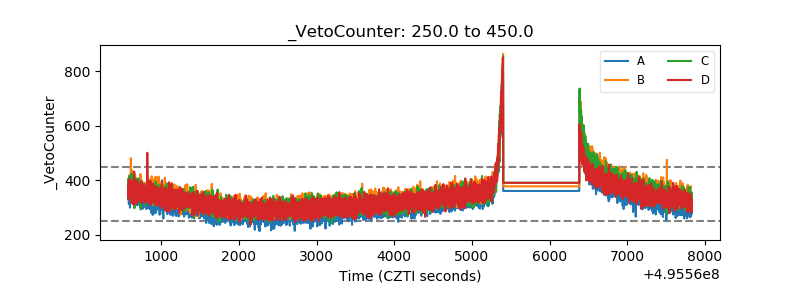 |