| Param | Original file | Final file |
|---|---|---|
| Filename | modeM0/AS1A14_057T04_9000006508_53904cztM0_level2.fits | modeM0/AS1A14_057T04_9000006508_53904cztM0_level2_quad_clean.evt |
| Size (bytes) | 775,414,080 | 74,836,800 |
| Size | 739.5 MB | 71.4 MB |
| Events in quadrant A | 3,624,505 | 623,189 |
| Events in quadrant B | 3,824,572 | 665,415 |
| Events in quadrant C | 6,707,380 | 521,164 |
| Events in quadrant D | 14,050,101 | 10,294 |
| Mode M0 | |||
|---|---|---|---|
| Quadrant | BADHDUFLAG | Total packets | Discarded packets |
| A | 0 | 15362 | 1 |
| B | 0 | 15753 | 1 |
| C | 0 | 24390 | 1 |
| D | 0 | 46125 | 2 |
| Mode SS | |||
|---|---|---|---|
| Quadrant | BADHDUFLAG | Total packets | Discarded packets |
| A | 0 | 130 | 0 |
| B | 0 | 130 | 0 |
| C | 0 | 130 | 0 |
| D | 0 | 130 | 0 |
| Mode M9 | |||
|---|---|---|---|
| Quadrant | BADHDUFLAG | Total packets | Discarded packets |
| A | 0 | 11 | 0 |
| B | 0 | 11 | 0 |
| C | 0 | 11 | 0 |
| D | 0 | 11 | 0 |
| Quadrant | Total seconds | Saturated seconds | Saturation percentage |
|---|---|---|---|
| A | 6387 | 166 | 2.599029% |
| B | 6387 | 114 | 1.784876% |
| C | 6388 | 1073 | 16.797120% |
| D | 6387 | 6296 | 98.575231% |
Noise dominated data is calculated using 1-second bins in cleaned event files. If a bin has >2000 counts, and if more than 50% of those come from <1% of pixels, then it is considered to be noise-dominated and hence unusable.
| Quadrant | # 1 sec bins | Bins with >0 counts | Bins with >2000 counts | High rate bins dominated by noise | Noise dominated (total time) | Noise dominated (detector-on time) | Marked lightcurve |
|---|---|---|---|---|---|---|---|
| A | 7512 | 6388 | 141 | 141 | 1.88% | 2.21% | 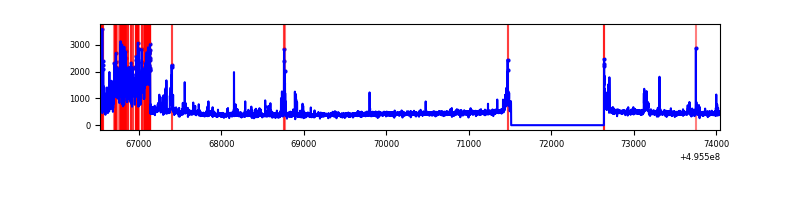 |
| B | 7512 | 6388 | 52 | 52 | 0.69% | 0.81% | 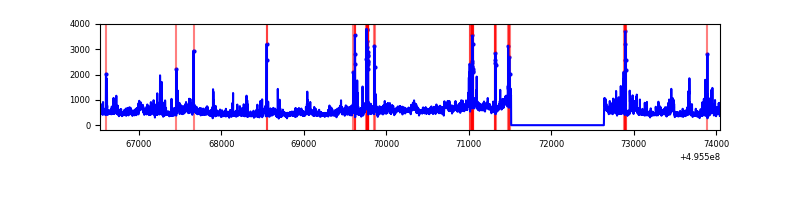 |
| C | 7513 | 6388 | 878 | 878 | 11.69% | 13.74% | 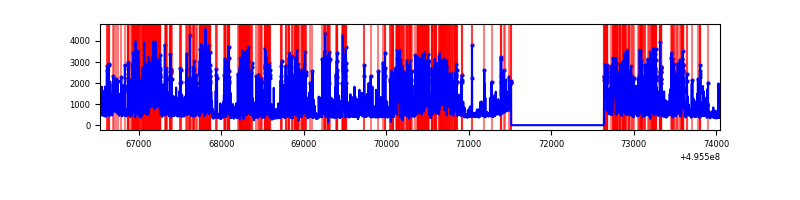 |
| D | 7511 | 6386 | 4519 | 4519 | 60.17% | 70.76% | 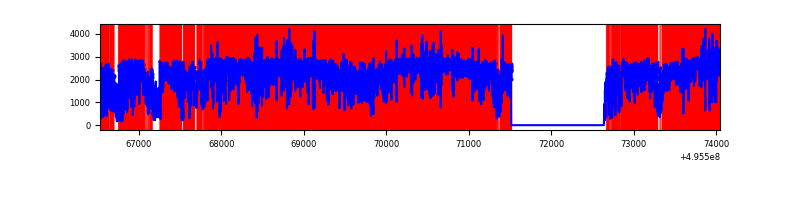 |
Top three noisy pixels from each quadrant. If the there are fewer than three noisy pixels in the level2.evt file, extra rows are filled as -1
| Pixel properties | Quadrant properties | ||||||
|---|---|---|---|---|---|---|---|
| Quadrant | DetID | PixID | Counts | Sigma | Mean | Median | Sigma |
| A | 12 | 115 | 575195 | 3372.27 | 687 | 671 | 170.4 |
| A | 10 | 253 | 81231 | 472.86 | 687 | 671 | 170.4 |
| A | 8 | 249 | 75919 | 441.68 | 687 | 671 | 170.4 |
| B | 7 | 0 | 600788 | 4152.99 | 683 | 660 | 144.5 |
| B | 10 | 247 | 128364 | 883.73 | 683 | 660 | 144.5 |
| B | 5 | 185 | 107578 | 739.89 | 683 | 660 | 144.5 |
| C | 15 | 224 | 2964039 | 16999.53 | 628 | 620 | 174.3 |
| C | 15 | 174 | 532235 | 3049.59 | 628 | 620 | 174.3 |
| C | 2 | 12 | 249898 | 1429.97 | 628 | 620 | 174.3 |
| D | 8 | 176 | 13328195 | 405763.65 | 108 | 103 | 32.8 |
| D | 2 | 172 | 140131 | 4263.05 | 108 | 103 | 32.8 |
| D | 10 | 172 | 27503 | 834.17 | 108 | 103 | 32.8 |
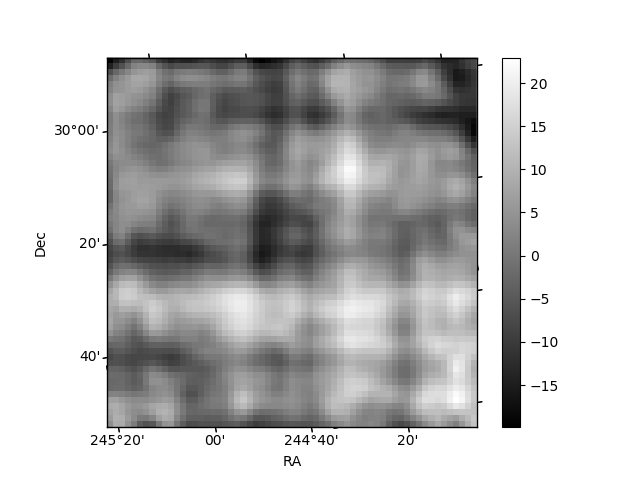
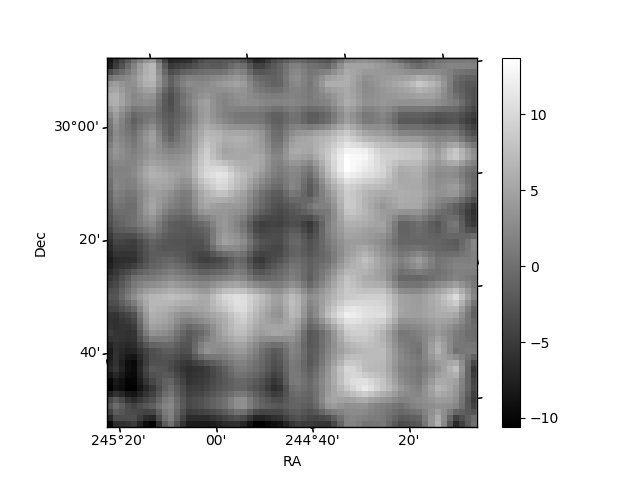
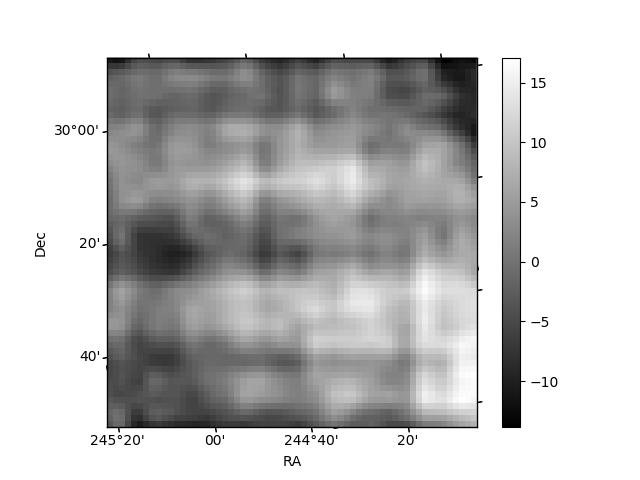
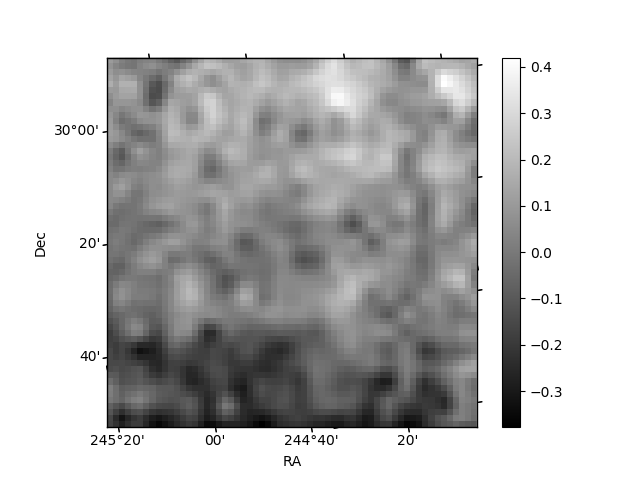
Histogram calculated using DETX and DETY for each event in the final _common_clean file
| Quadrant A | 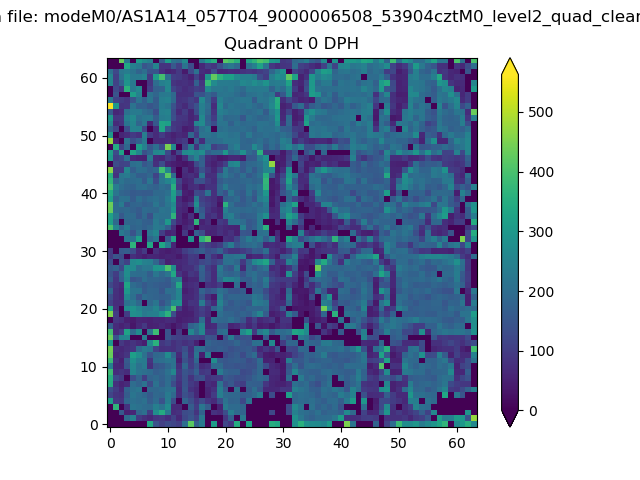 |
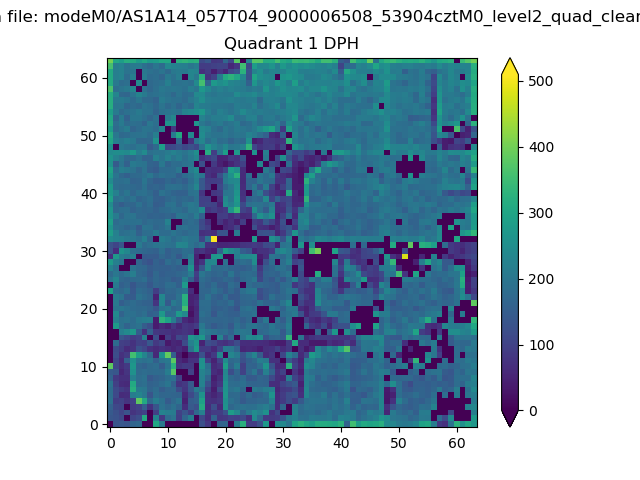 |
Quadrant B |
|---|---|---|---|
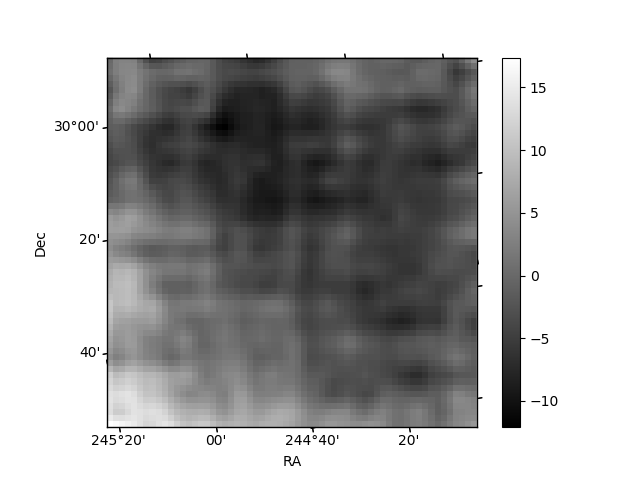
| Quadrant D | 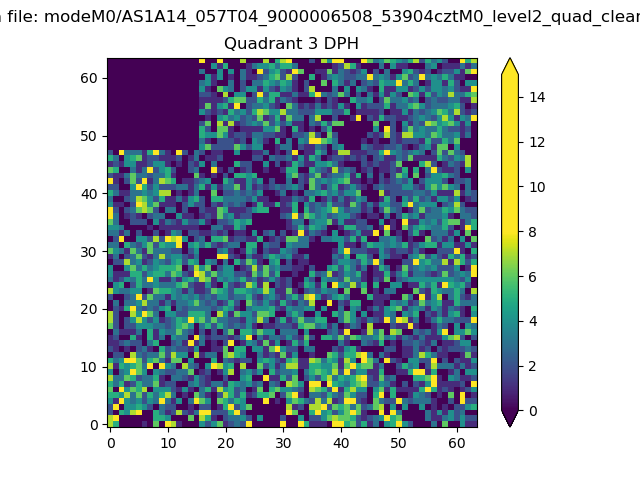 |
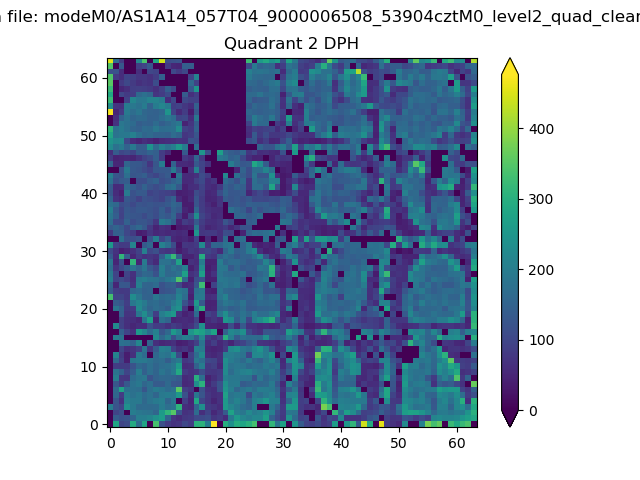 |
Quadrant C |
| Plot type | Count rate plots | Images |
|---|---|---|
| Comparison with Poisson distribution Blue bars denote a histogram of data divided into 1 sec bins. Red curve is a Poisson curve with rate = median count rate of data. |
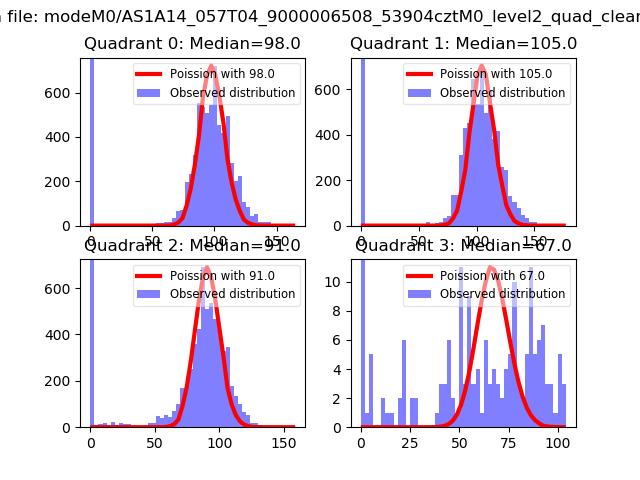 |
 |
| Quadrant-wise count rates Data is divided into 100 sec bins |
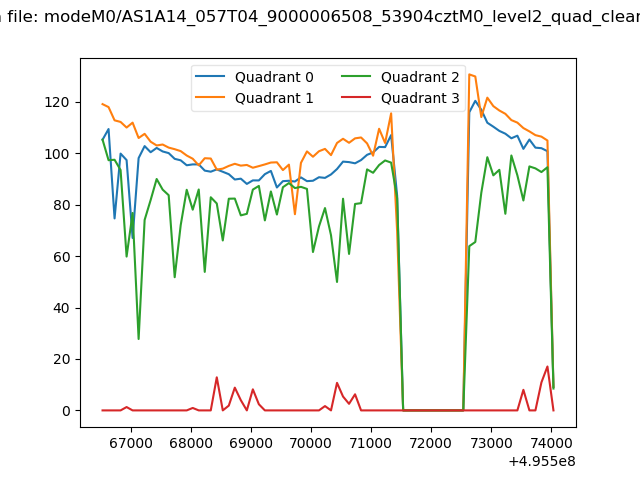 |
|
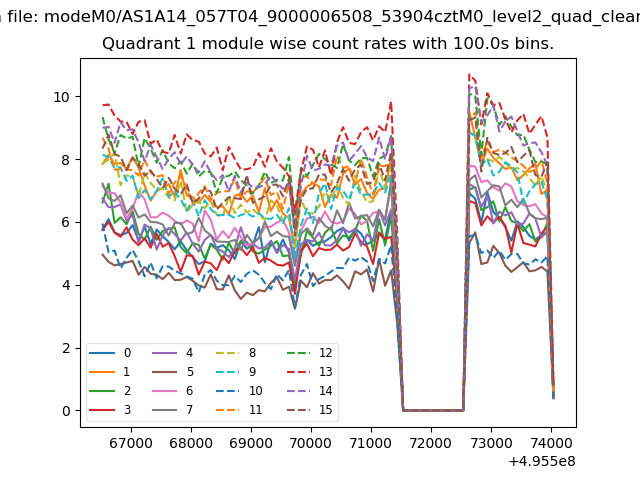
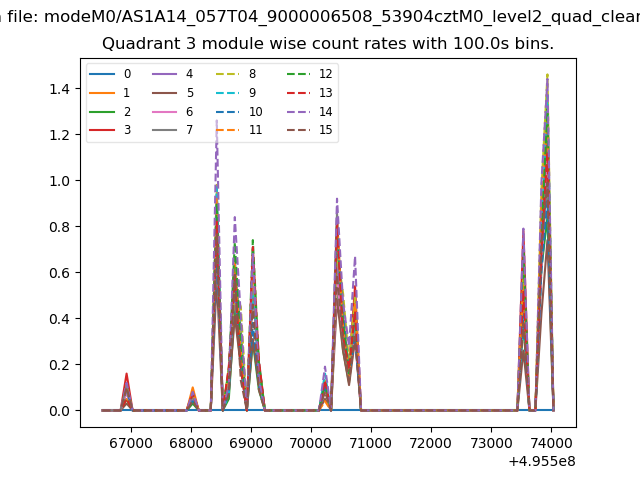
| Module-wise count rates for Quadrant A Data is divided into 100 sec bins |
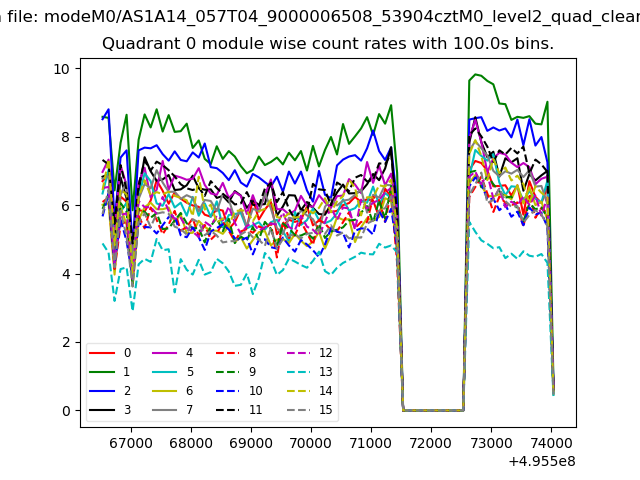 |
 |
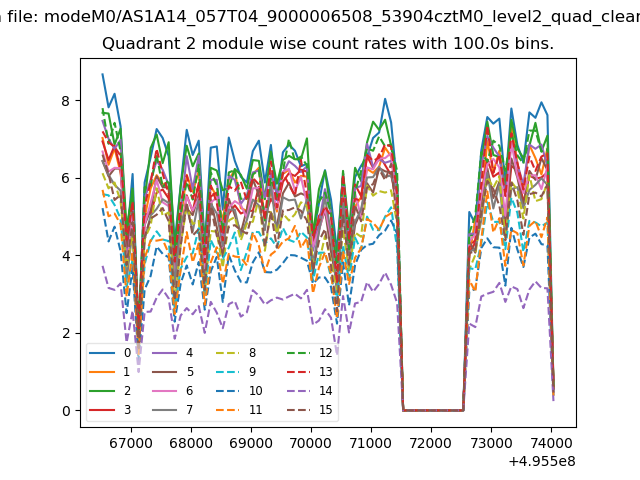
| Module-wise count rates for Quadrant B Data is divided into 100 sec bins |
 |
 |
| Module-wise count rates for Quadrant C Data is divided into 100 sec bins |
 |
 |
| Module-wise count rates for Quadrant D Data is divided into 100 sec bins |
 |
 |
| Parameter | Plot |
|---|---|
| CZT HV Monitor | 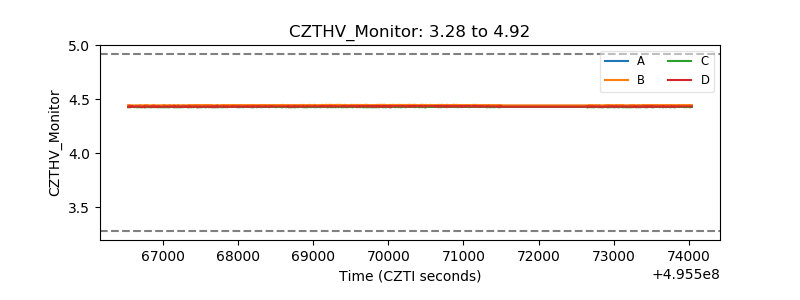 |
| D_VDD | 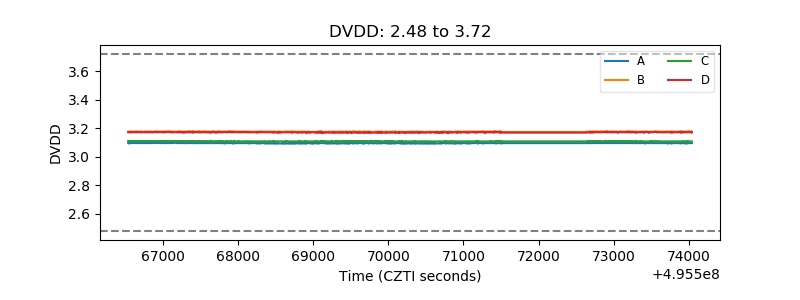 |
| Temperature 1 | 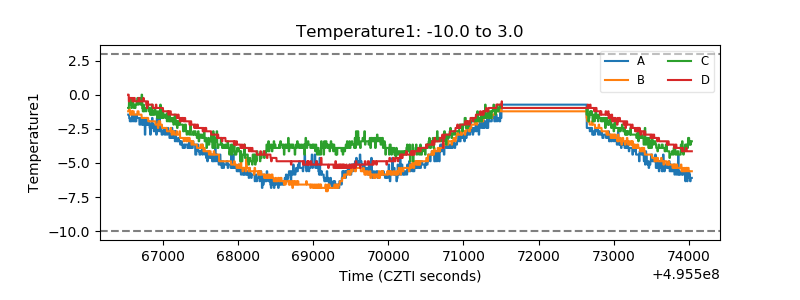 |
| Veto HV Monitor |  |
| Veto LLD | 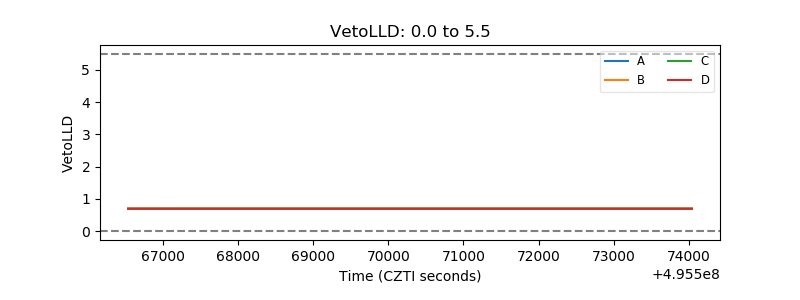 |
| Alpha Counter | 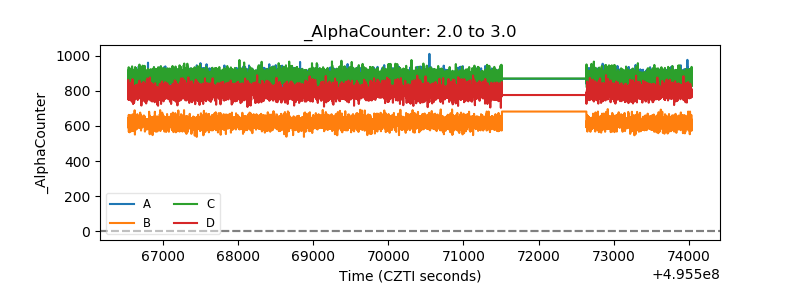 |
| _CPM_Rate | 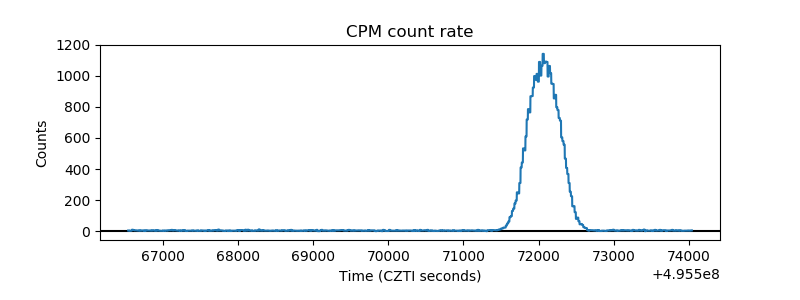 |
| CZT Counter | 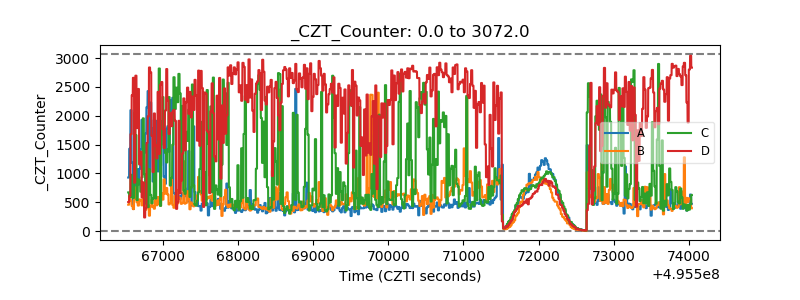 |
| +2.5 Volts monitor |  |
| +5 Volts monitor | 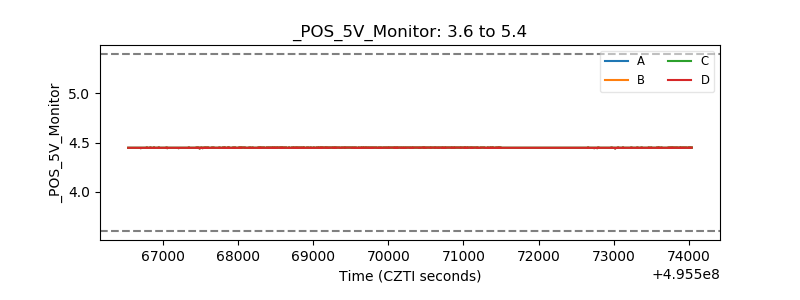 |
| _ROLL_ROT | 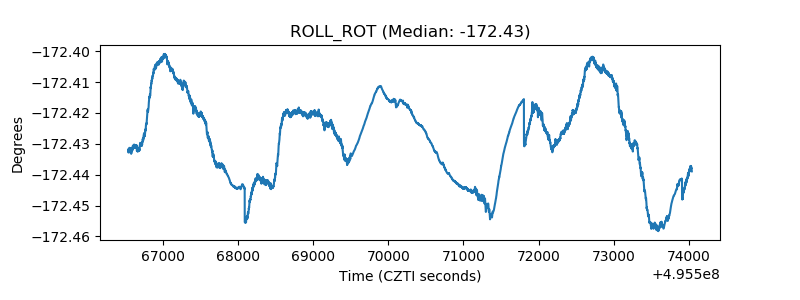 |
| _Roll_DEC | 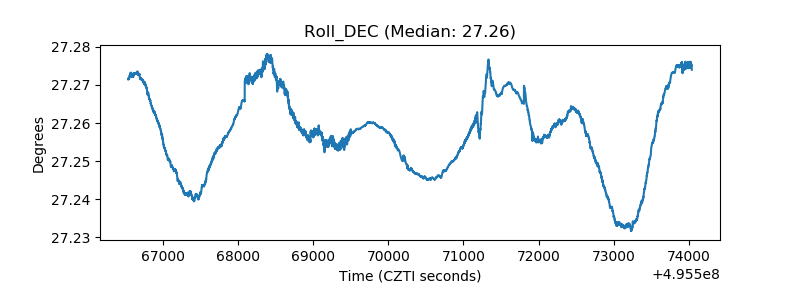 |
| _Roll_RA | 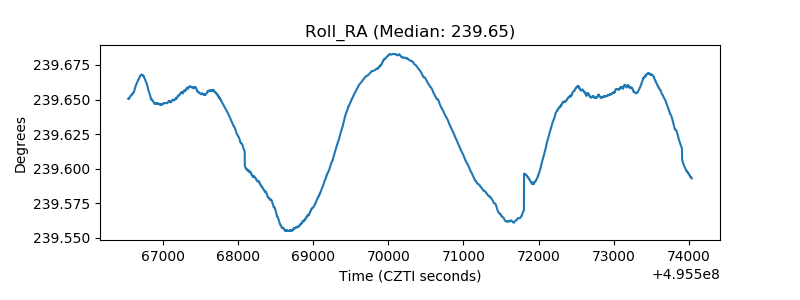 |
| Veto Counter | 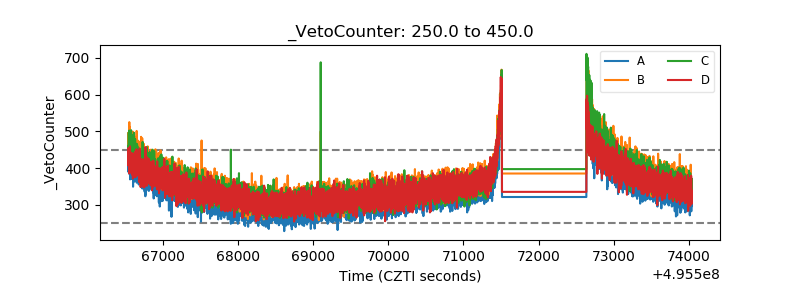 |