| Param | Original file | Final file |
|---|---|---|
| Filename | modeM0/AS1A14_057T04_9000006508_53905cztM0_level2.fits | modeM0/AS1A14_057T04_9000006508_53905cztM0_level2_quad_clean.evt |
| Size (bytes) | 790,165,440 | 75,447,360 |
| Size | 753.6 MB | 72.0 MB |
| Events in quadrant A | 2,989,512 | 649,158 |
| Events in quadrant B | 5,699,469 | 615,133 |
| Events in quadrant C | 6,178,078 | 537,559 |
| Events in quadrant D | 13,888,398 | 39,403 |
| Mode M0 | |||
|---|---|---|---|
| Quadrant | BADHDUFLAG | Total packets | Discarded packets |
| A | 0 | 13374 | 2 |
| B | 0 | 21261 | 2 |
| C | 0 | 22787 | 2 |
| D | 0 | 45654 | 2 |
| Mode SS | |||
|---|---|---|---|
| Quadrant | BADHDUFLAG | Total packets | Discarded packets |
| A | 0 | 128 | 0 |
| B | 0 | 128 | 0 |
| C | 0 | 128 | 0 |
| D | 0 | 128 | 0 |
| Mode M9 | |||
|---|---|---|---|
| Quadrant | BADHDUFLAG | Total packets | Discarded packets |
| A | 0 | 15 | 0 |
| B | 0 | 16 | 0 |
| C | 0 | 16 | 0 |
| D | 0 | 16 | 0 |
| Quadrant | Total seconds | Saturated seconds | Saturation percentage |
|---|---|---|---|
| A | 6353 | 28 | 0.440737% |
| B | 6353 | 861 | 13.552652% |
| C | 6353 | 888 | 13.977648% |
| D | 6352 | 5986 | 94.238035% |
Noise dominated data is calculated using 1-second bins in cleaned event files. If a bin has >2000 counts, and if more than 50% of those come from <1% of pixels, then it is considered to be noise-dominated and hence unusable.
| Quadrant | # 1 sec bins | Bins with >0 counts | Bins with >2000 counts | High rate bins dominated by noise | Noise dominated (total time) | Noise dominated (detector-on time) | Marked lightcurve |
|---|---|---|---|---|---|---|---|
| A | 7558 | 6354 | 11 | 11 | 0.15% | 0.17% | 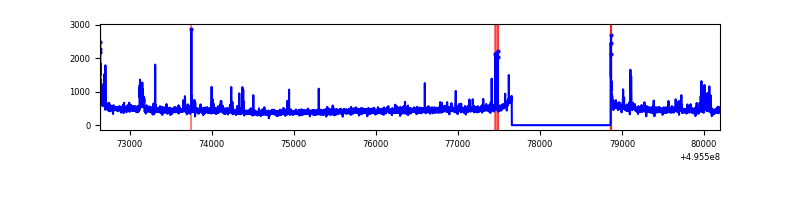 |
| B | 7558 | 6354 | 674 | 674 | 8.92% | 10.61% | 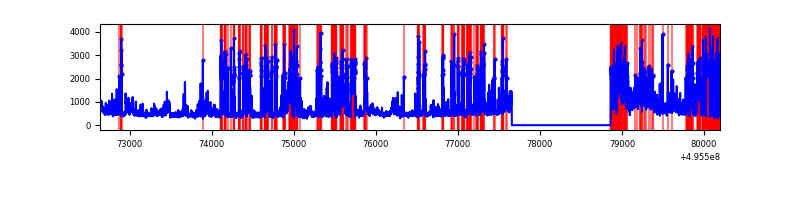 |
| C | 7558 | 6354 | 791 | 791 | 10.47% | 12.45% | 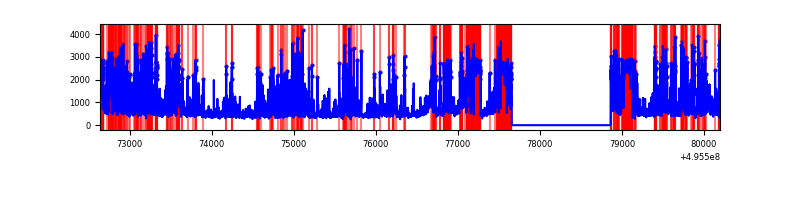 |
| D | 7556 | 6351 | 4304 | 4304 | 56.96% | 67.77% | 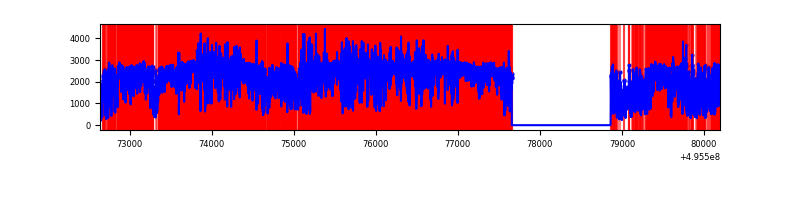 |
Top three noisy pixels from each quadrant. If the there are fewer than three noisy pixels in the level2.evt file, extra rows are filled as -1
| Pixel properties | Quadrant properties | ||||||
|---|---|---|---|---|---|---|---|
| Quadrant | DetID | PixID | Counts | Sigma | Mean | Median | Sigma |
| A | 15 | 174 | 37446 | 209.65 | 704 | 688 | 175.3 |
| A | 15 | 190 | 34696 | 193.96 | 704 | 688 | 175.3 |
| A | 12 | 115 | 34394 | 192.24 | 704 | 688 | 175.3 |
| B | 10 | 44 | 1490715 | 10569.44 | 662 | 639 | 141.0 |
| B | 5 | 172 | 1151517 | 8163.43 | 662 | 639 | 141.0 |
| B | 5 | 250 | 123039 | 868.21 | 662 | 639 | 141.0 |
| C | 15 | 224 | 2092034 | 11832.04 | 639 | 634 | 176.8 |
| C | 1 | 241 | 1110035 | 6276.41 | 639 | 634 | 176.8 |
| C | 13 | 3 | 228259 | 1287.78 | 639 | 634 | 176.8 |
| D | 8 | 176 | 13048796 | 265998.5 | 166 | 159 | 49.1 |
| D | 10 | 172 | 70621 | 1436.38 | 166 | 159 | 49.1 |
| D | 3 | 144 | 23218 | 470.06 | 166 | 159 | 49.1 |
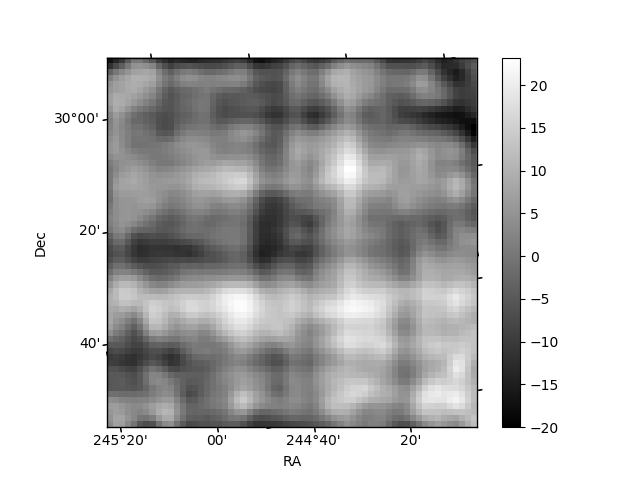
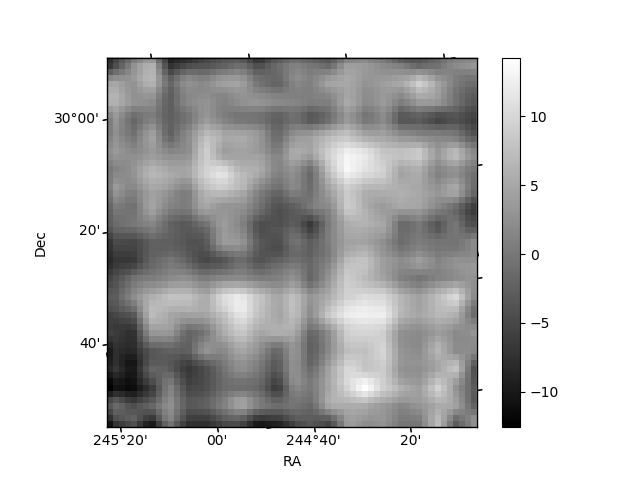
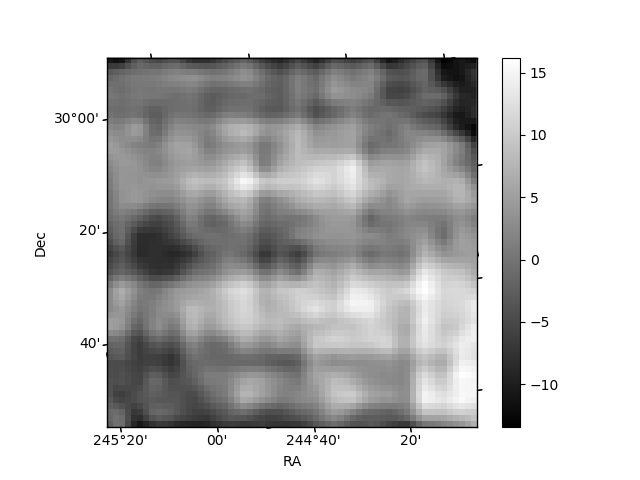
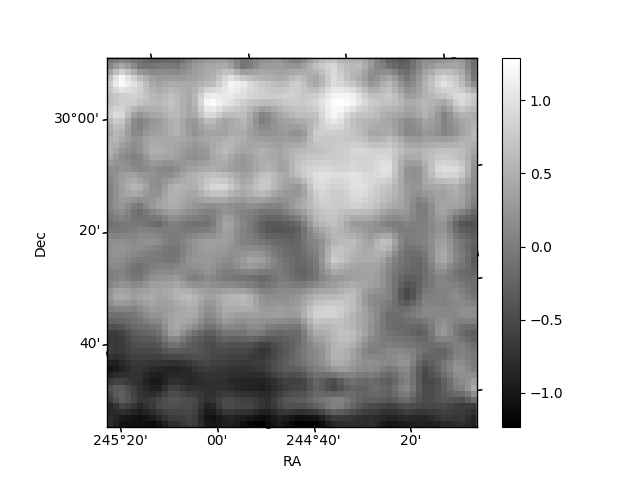
Histogram calculated using DETX and DETY for each event in the final _common_clean file
| Quadrant A | 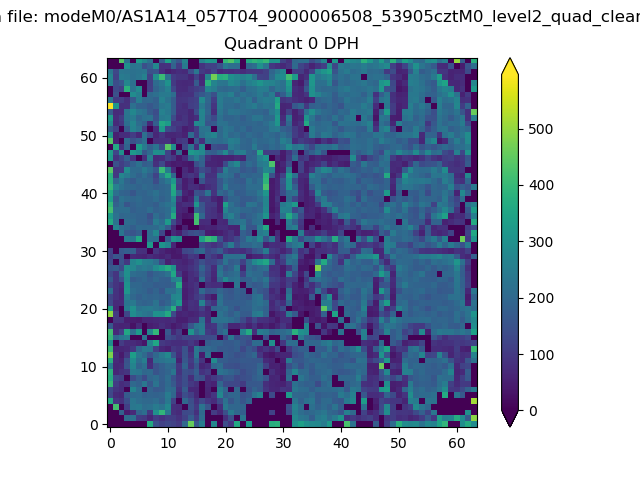 |
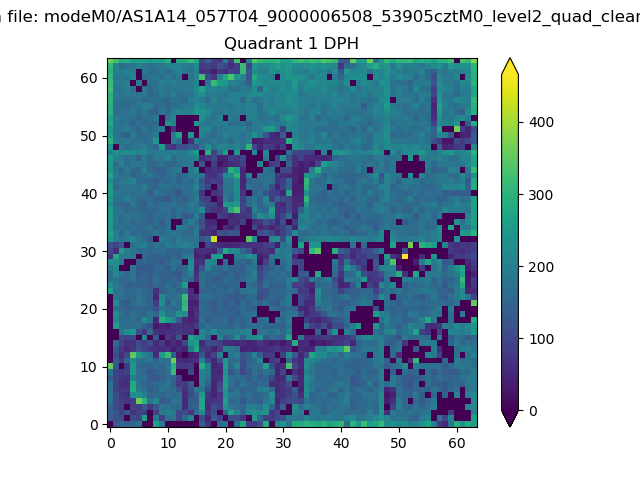 |
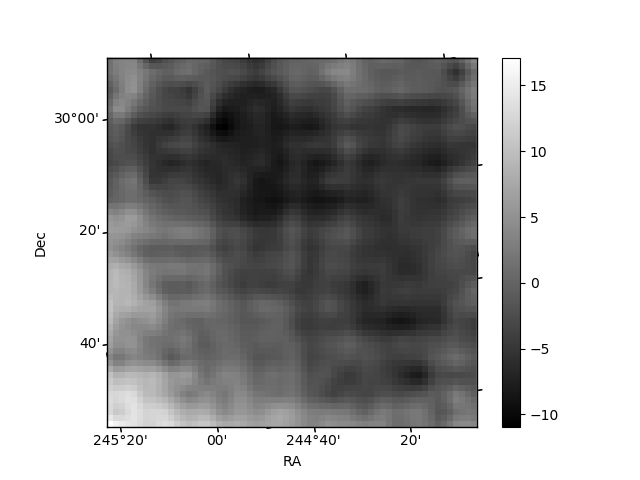
Quadrant B |
|---|---|---|---|
| Quadrant D | 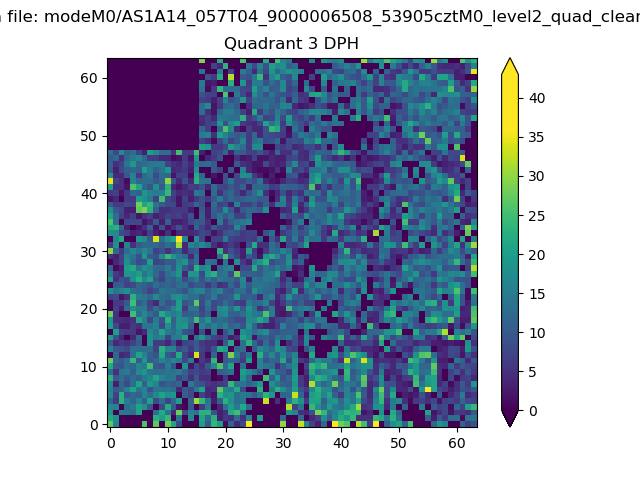 |
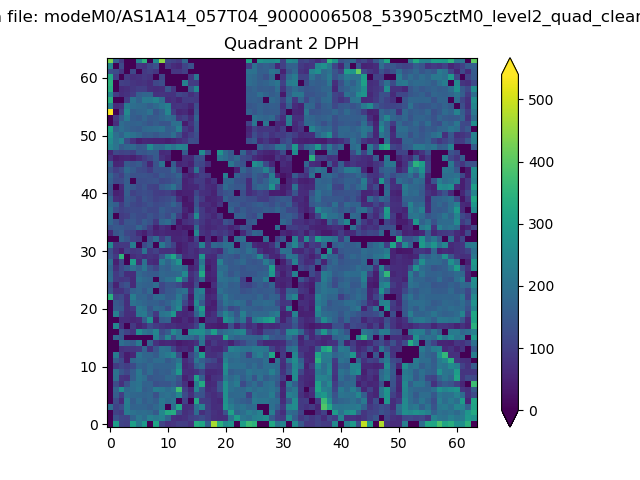 |
Quadrant C |
| Plot type | Count rate plots | Images |
|---|---|---|
| Comparison with Poisson distribution Blue bars denote a histogram of data divided into 1 sec bins. Red curve is a Poisson curve with rate = median count rate of data. |
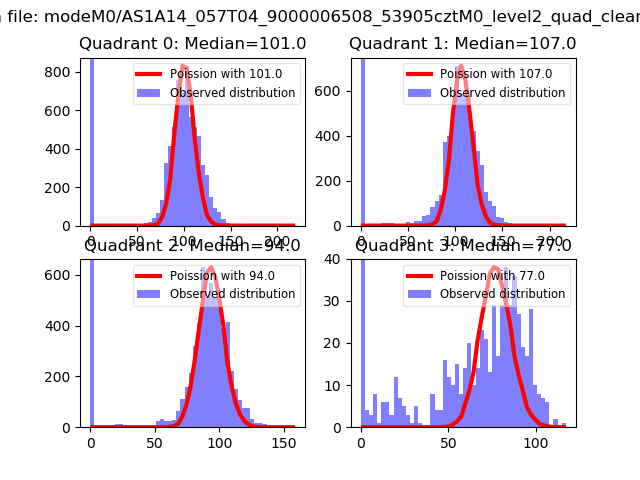 |
 |
| Quadrant-wise count rates Data is divided into 100 sec bins |
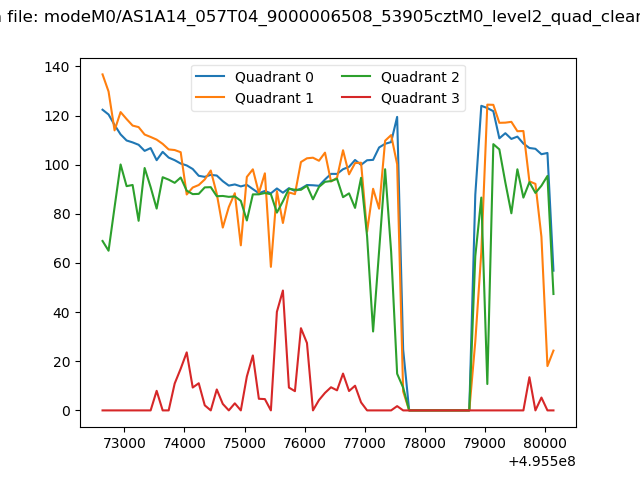 |
|
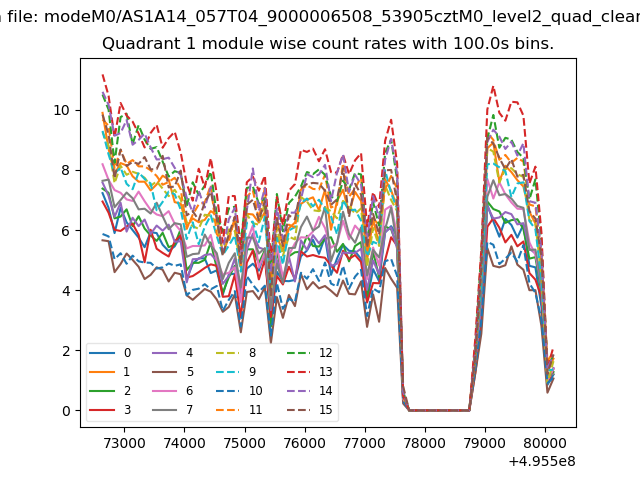
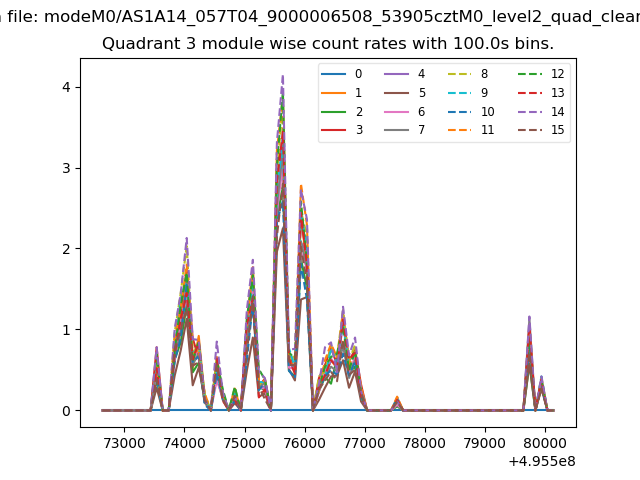
| Module-wise count rates for Quadrant A Data is divided into 100 sec bins |
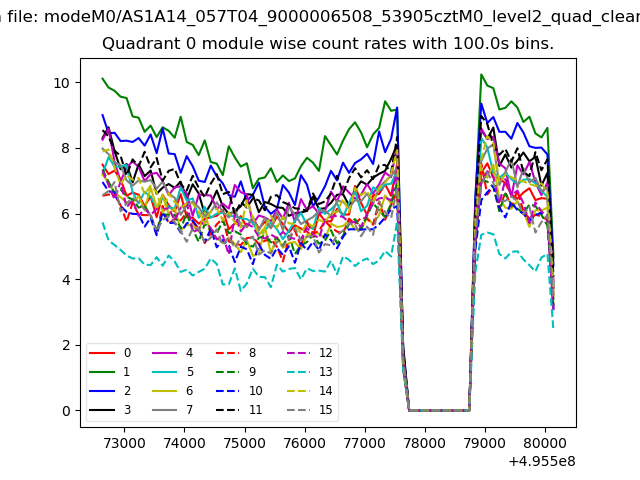 |
 |
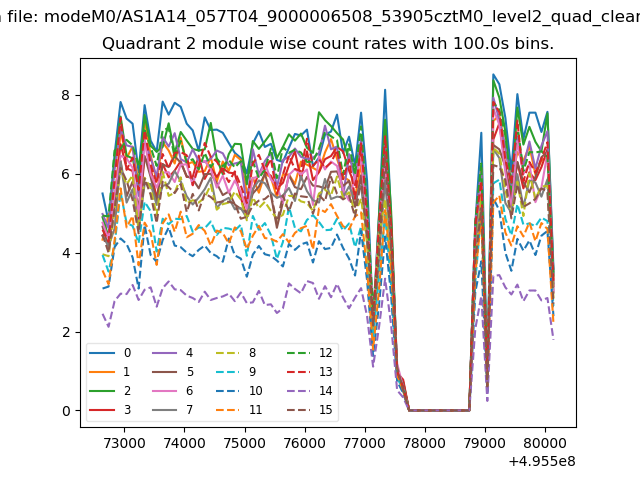
| Module-wise count rates for Quadrant B Data is divided into 100 sec bins |
 |
 |
| Module-wise count rates for Quadrant C Data is divided into 100 sec bins |
 |
 |
| Module-wise count rates for Quadrant D Data is divided into 100 sec bins |
 |
 |
| Parameter | Plot |
|---|---|
| CZT HV Monitor | 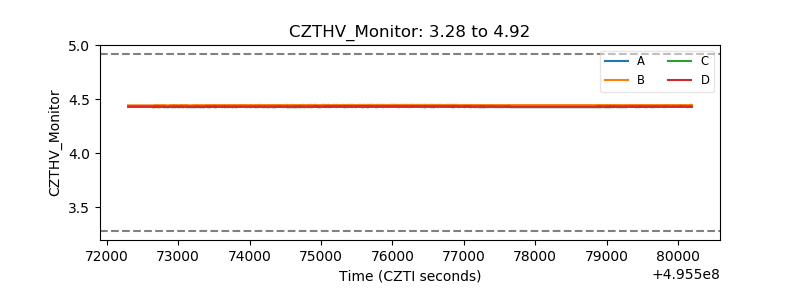 |
| D_VDD | 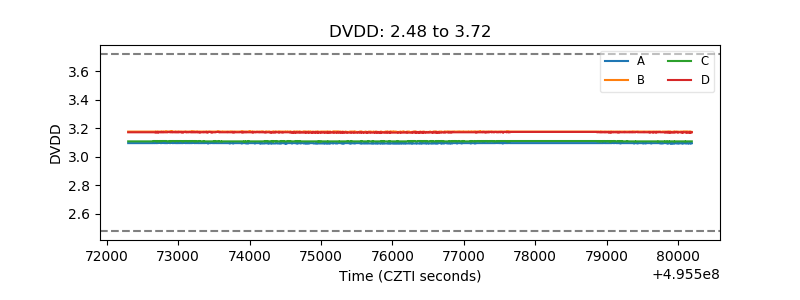 |
| Temperature 1 | 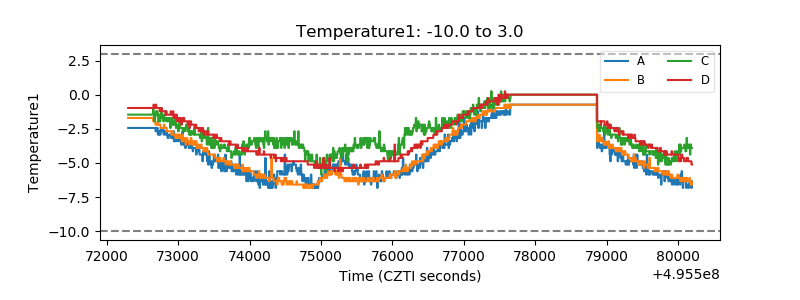 |
| Veto HV Monitor | 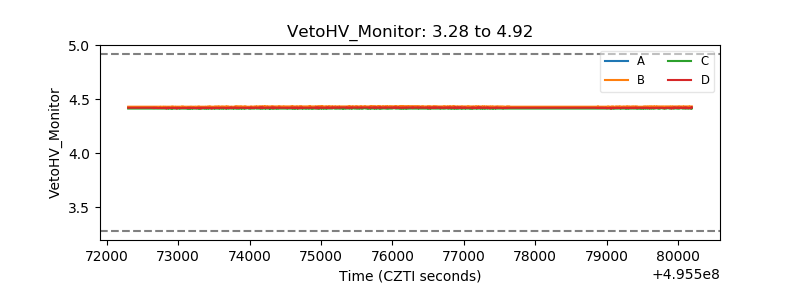 |
| Veto LLD | 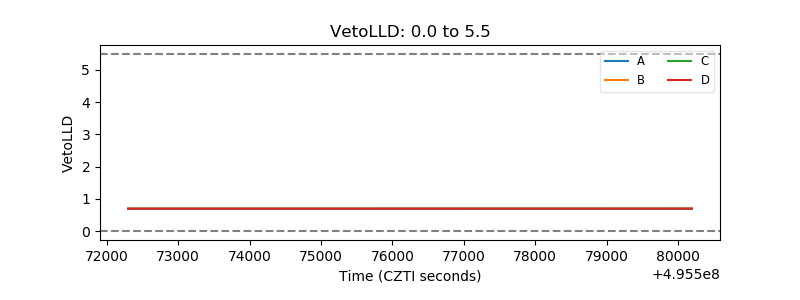 |
| Alpha Counter | 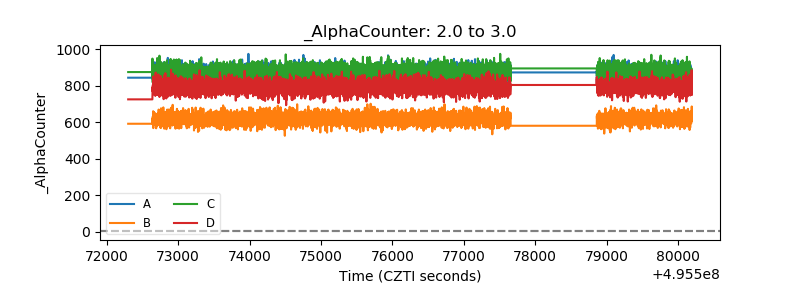 |
| _CPM_Rate | 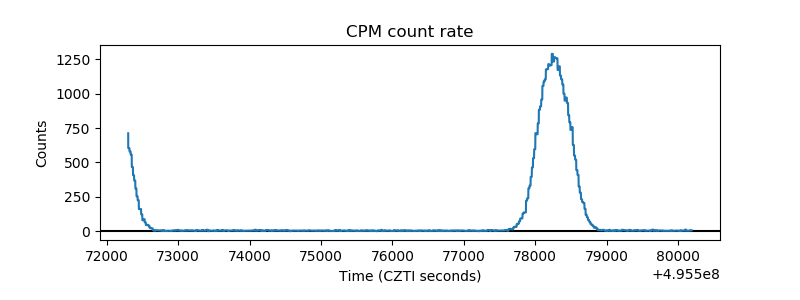 |
| CZT Counter | 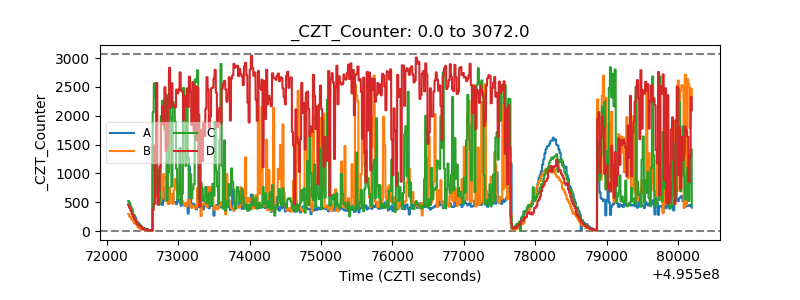 |
| +2.5 Volts monitor |  |
| +5 Volts monitor |  |
| _ROLL_ROT | 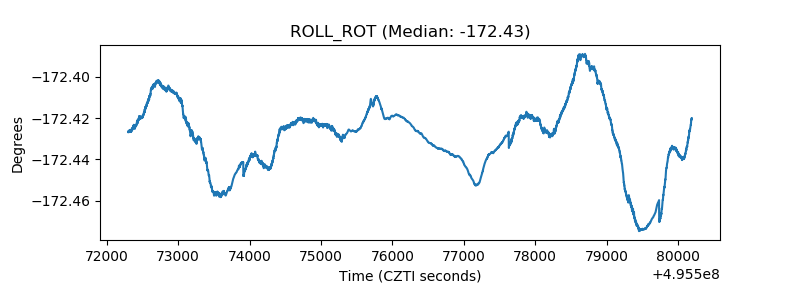 |
| _Roll_DEC | 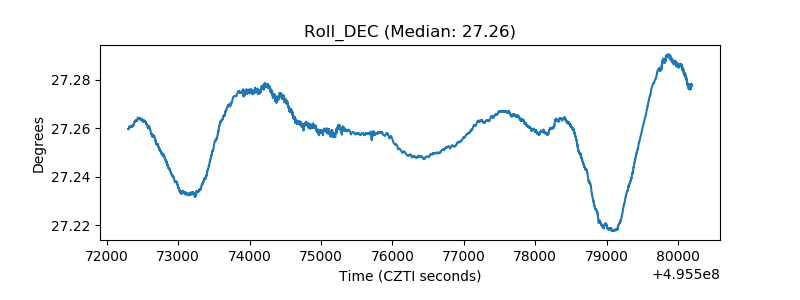 |
| _Roll_RA | 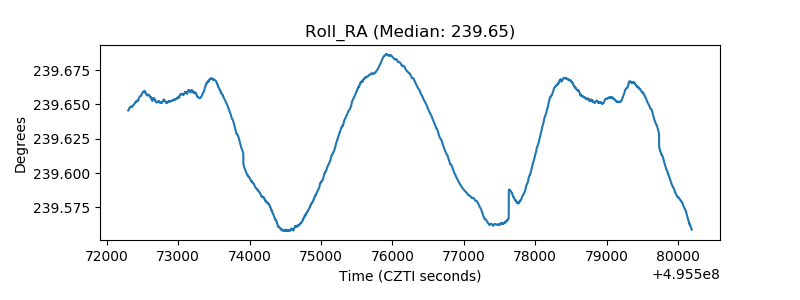 |
| Veto Counter | 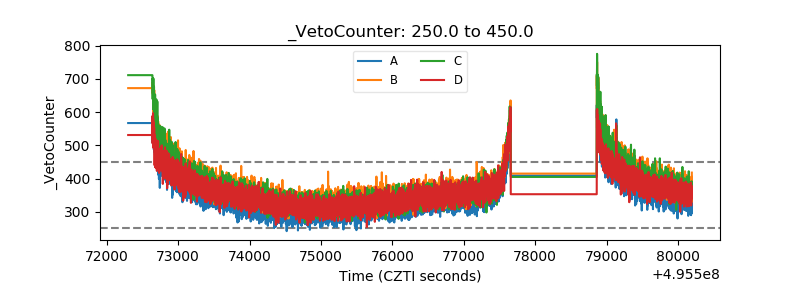 |