| Param | Original file | Final file |
|---|---|---|
| Filename | modeM0/AS1A14_057T04_9000006508_53906cztM0_level2.fits | modeM0/AS1A14_057T04_9000006508_53906cztM0_level2_quad_clean.evt |
| Size (bytes) | 705,326,400 | 82,555,200 |
| Size | 672.7 MB | 78.7 MB |
| Events in quadrant A | 3,096,342 | 670,013 |
| Events in quadrant B | 4,355,923 | 679,529 |
| Events in quadrant C | 7,948,188 | 483,397 |
| Events in quadrant D | 10,201,302 | 212,192 |
| Mode M0 | |||
|---|---|---|---|
| Quadrant | BADHDUFLAG | Total packets | Discarded packets |
| A | 0 | 13760 | 1 |
| B | 0 | 17621 | 1 |
| C | 0 | 28039 | 1 |
| D | 0 | 34777 | 1 |
| Mode SS | |||
|---|---|---|---|
| Quadrant | BADHDUFLAG | Total packets | Discarded packets |
| A | 0 | 132 | 0 |
| B | 0 | 132 | 0 |
| C | 0 | 132 | 0 |
| D | 0 | 132 | 0 |
| Mode M9 | |||
|---|---|---|---|
| Quadrant | BADHDUFLAG | Total packets | Discarded packets |
| A | 0 | 12 | 0 |
| B | 0 | 12 | 0 |
| C | 0 | 12 | 0 |
| D | 0 | 12 | 0 |
| Quadrant | Total seconds | Saturated seconds | Saturation percentage |
|---|---|---|---|
| A | 6517 | 26 | 0.398957% |
| B | 6517 | 427 | 6.552095% |
| C | 6517 | 1749 | 26.837502% |
| D | 6518 | 4209 | 64.575023% |
Noise dominated data is calculated using 1-second bins in cleaned event files. If a bin has >2000 counts, and if more than 50% of those come from <1% of pixels, then it is considered to be noise-dominated and hence unusable.
| Quadrant | # 1 sec bins | Bins with >0 counts | Bins with >2000 counts | High rate bins dominated by noise | Noise dominated (total time) | Noise dominated (detector-on time) | Marked lightcurve |
|---|---|---|---|---|---|---|---|
| A | 7732 | 6518 | 3 | 3 | 0.04% | 0.05% | 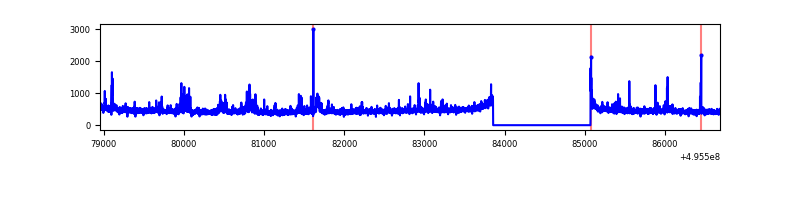 |
| B | 7732 | 6518 | 342 | 342 | 4.42% | 5.25% | 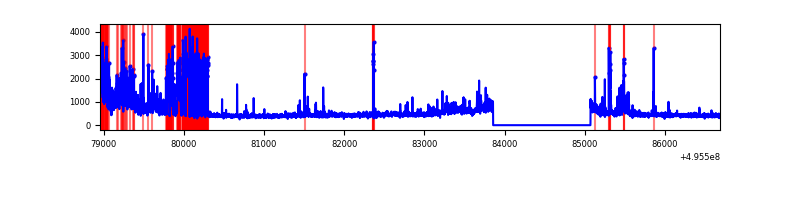 |
| C | 7732 | 6518 | 1630 | 1630 | 21.08% | 25.01% | 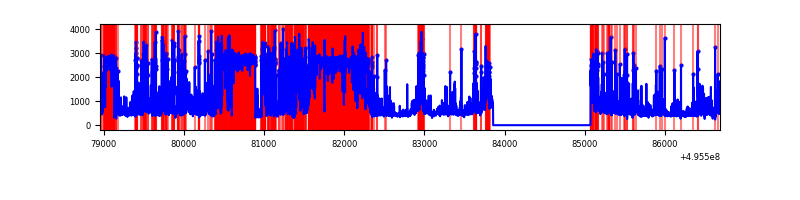 |
| D | 7732 | 6517 | 2307 | 2307 | 29.84% | 35.40% | 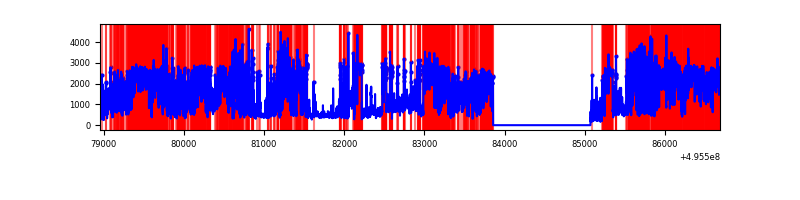 |
Top three noisy pixels from each quadrant. If the there are fewer than three noisy pixels in the level2.evt file, extra rows are filled as -1
| Pixel properties | Quadrant properties | ||||||
|---|---|---|---|---|---|---|---|
| Quadrant | DetID | PixID | Counts | Sigma | Mean | Median | Sigma |
| A | 12 | 115 | 154380 | 851.36 | 724 | 708 | 180.5 |
| A | 15 | 174 | 31261 | 169.27 | 724 | 708 | 180.5 |
| A | 4 | 249 | 22605 | 121.31 | 724 | 708 | 180.5 |
| B | 5 | 172 | 1188308 | 7893.65 | 708 | 685 | 150.5 |
| B | 7 | 0 | 83762 | 552.18 | 708 | 685 | 150.5 |
| B | 5 | 185 | 59569 | 391.38 | 708 | 685 | 150.5 |
| C | 1 | 241 | 3398064 | 20049.17 | 616 | 609 | 169.5 |
| C | 15 | 224 | 1442950 | 8511.59 | 616 | 609 | 169.5 |
| C | 13 | 3 | 483800 | 2851.42 | 616 | 609 | 169.5 |
| D | 8 | 176 | 8463600 | 93202.16 | 311 | 297 | 90.8 |
| D | 5 | 113 | 269004 | 2959.14 | 311 | 297 | 90.8 |
| D | 10 | 172 | 42553 | 465.34 | 311 | 297 | 90.8 |
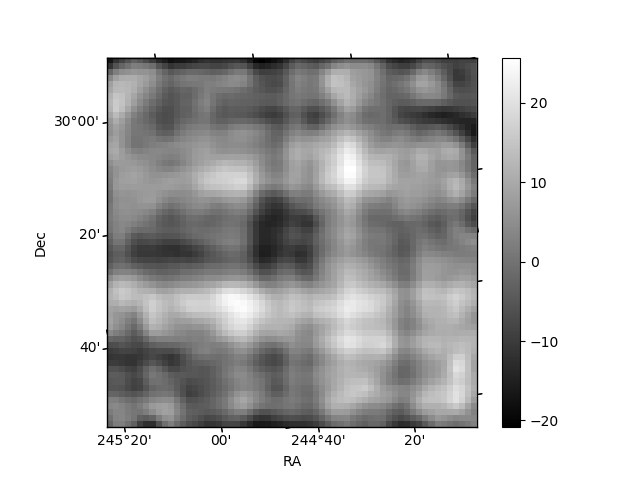
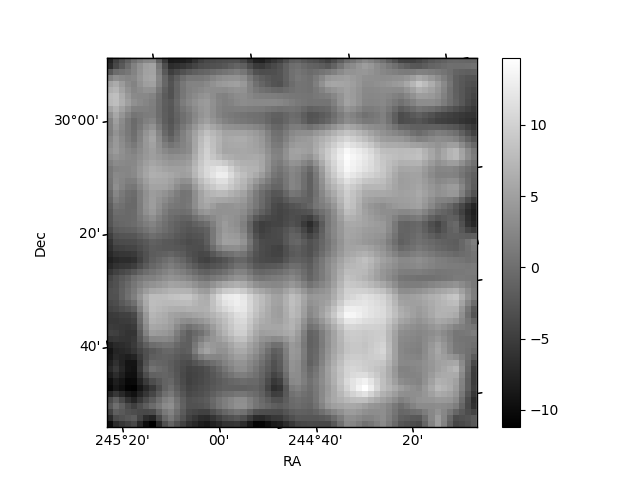
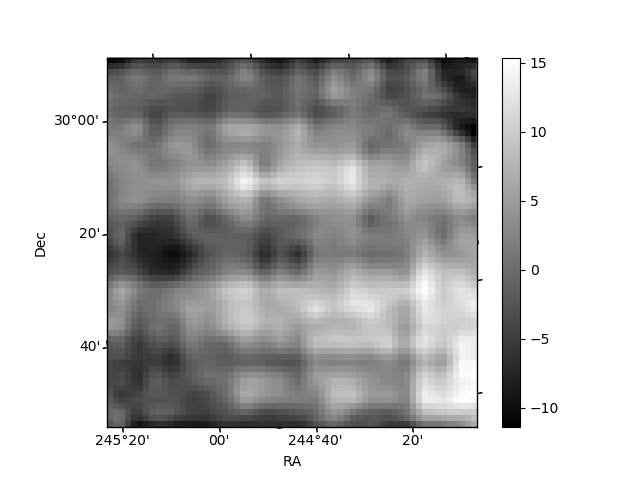
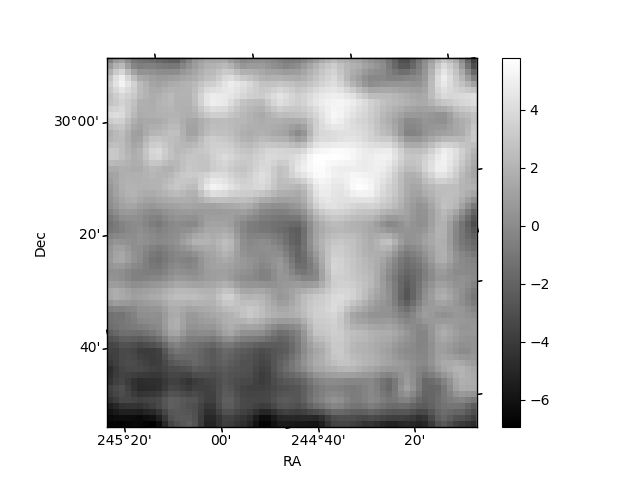
Histogram calculated using DETX and DETY for each event in the final _common_clean file
| Quadrant A | 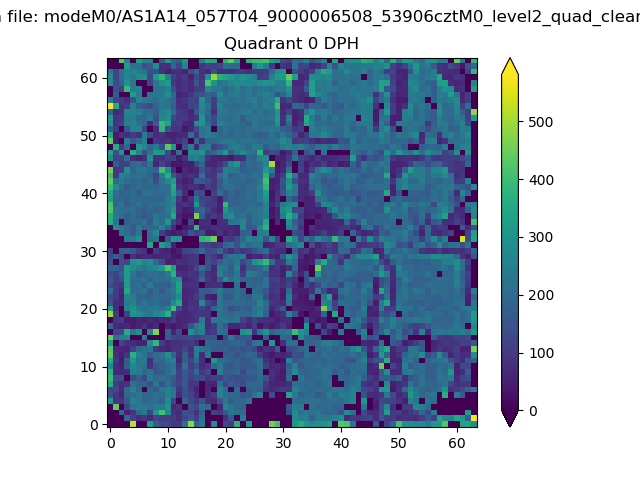 |
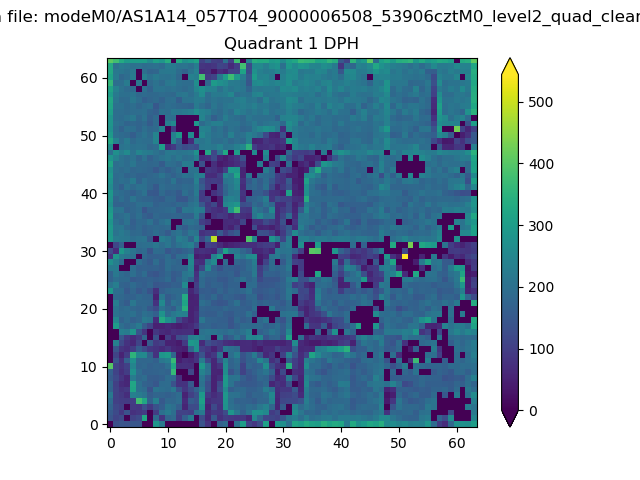 |
Quadrant B |
|---|---|---|---|
| Quadrant D | 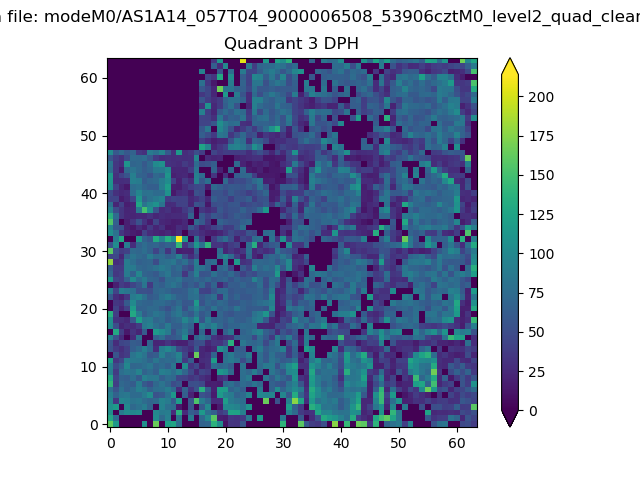 |
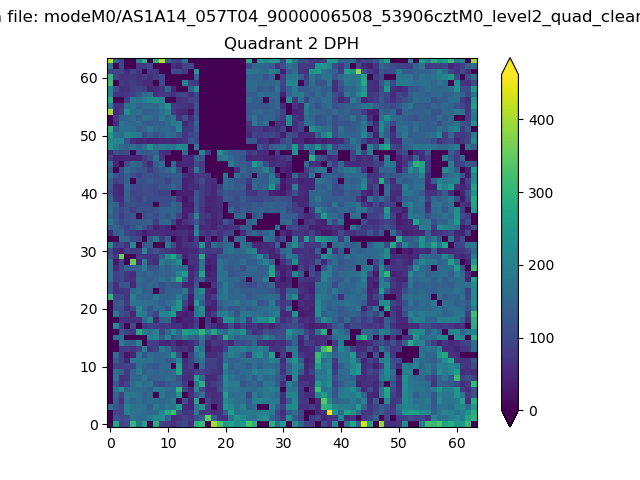 |
Quadrant C |
| Plot type | Count rate plots | Images |
|---|---|---|
| Comparison with Poisson distribution Blue bars denote a histogram of data divided into 1 sec bins. Red curve is a Poisson curve with rate = median count rate of data. |
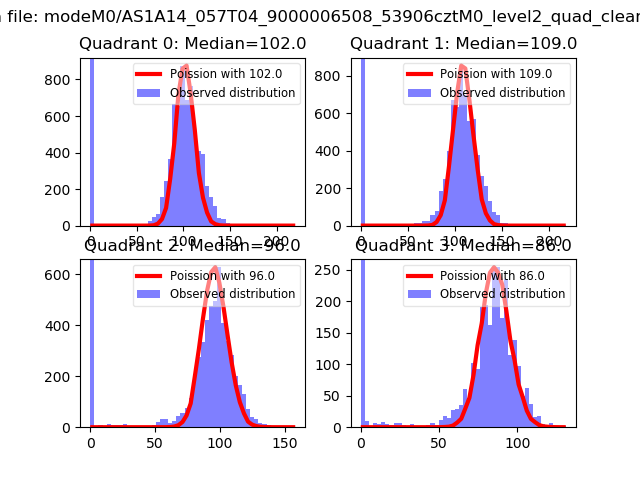 |
 |
| Quadrant-wise count rates Data is divided into 100 sec bins |
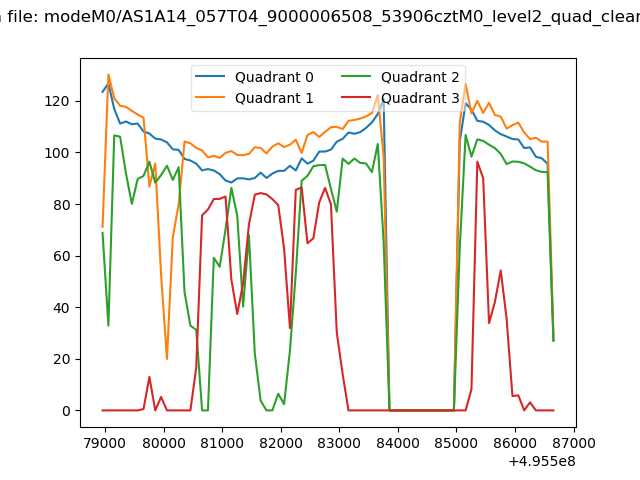 |
|
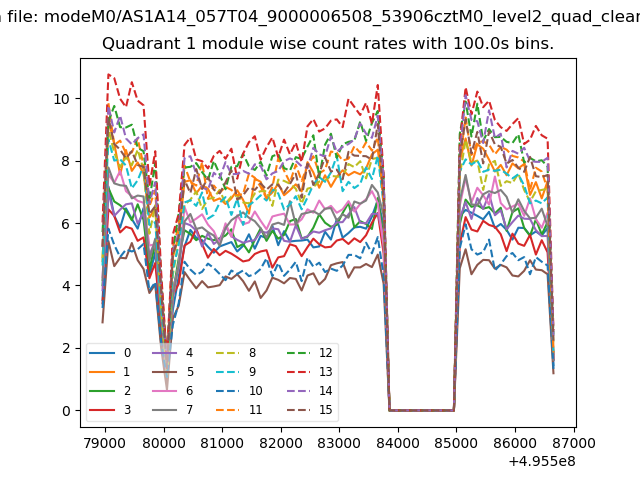
| Module-wise count rates for Quadrant A Data is divided into 100 sec bins |
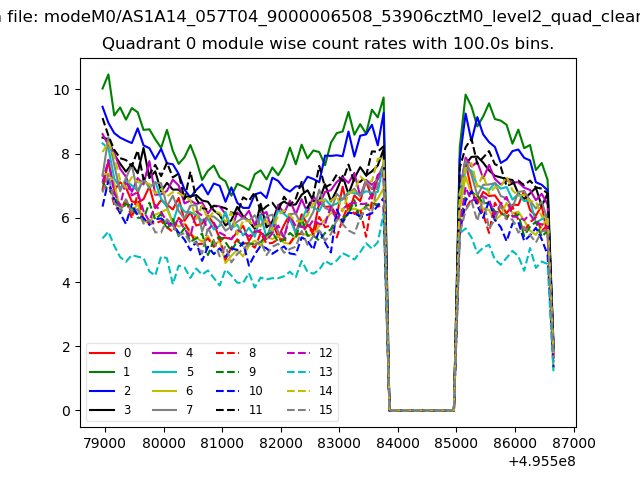 |
 |
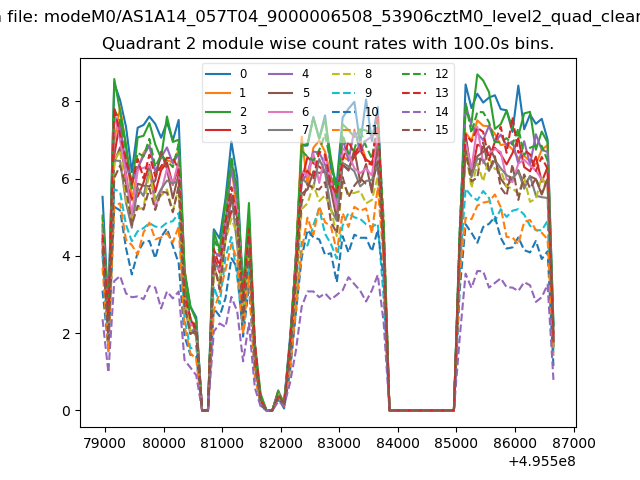
| Module-wise count rates for Quadrant B Data is divided into 100 sec bins |
 |
 |
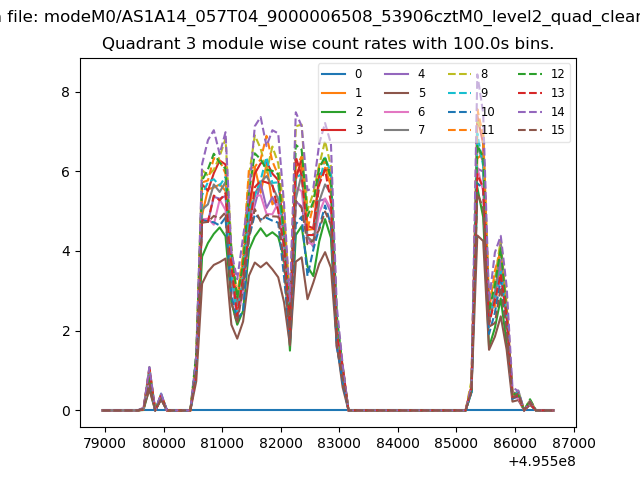
| Module-wise count rates for Quadrant C Data is divided into 100 sec bins |
 |
 |
| Module-wise count rates for Quadrant D Data is divided into 100 sec bins |
 |
 |
| Parameter | Plot |
|---|---|
| CZT HV Monitor | 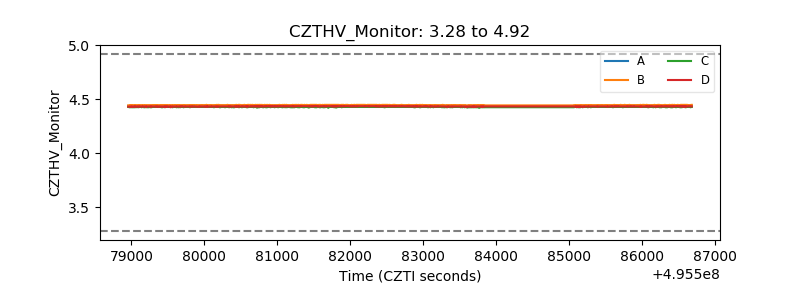 |
| D_VDD | 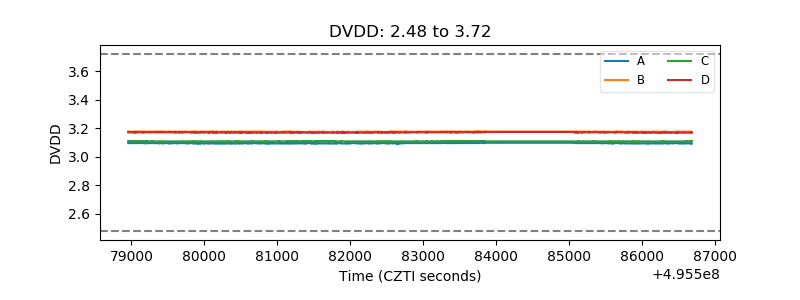 |
| Temperature 1 | 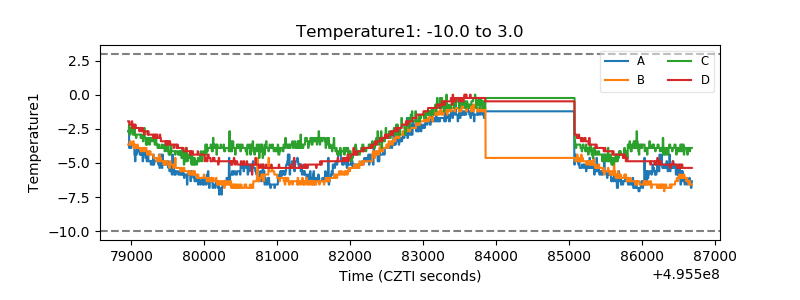 |
| Veto HV Monitor | 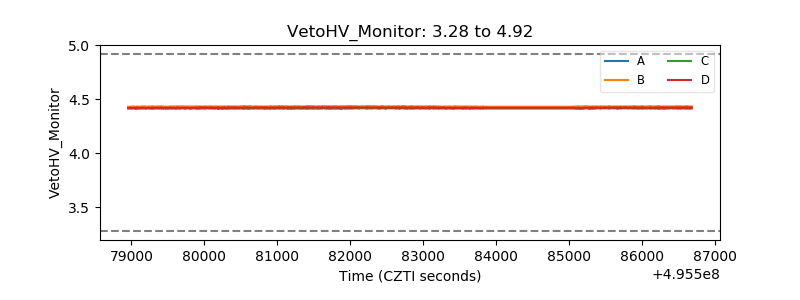 |
| Veto LLD | 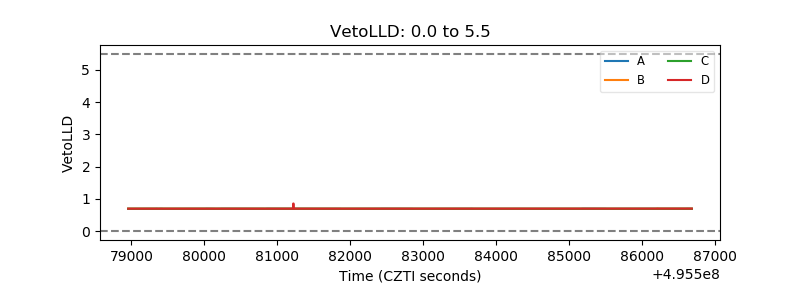 |
| Alpha Counter | 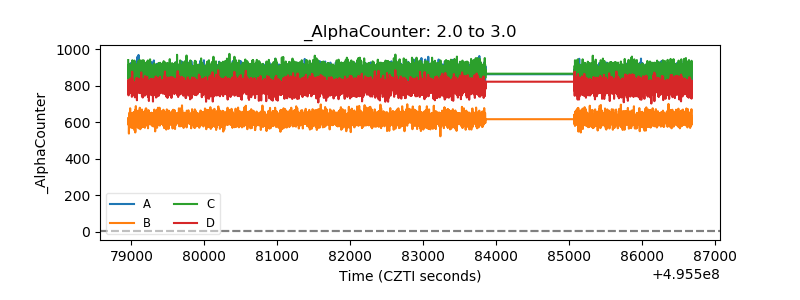 |
| _CPM_Rate | 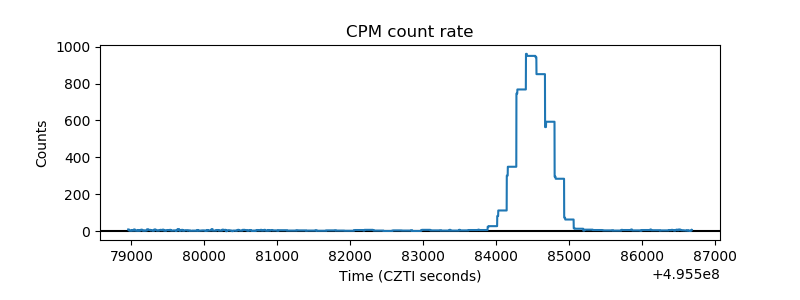 |
| CZT Counter | 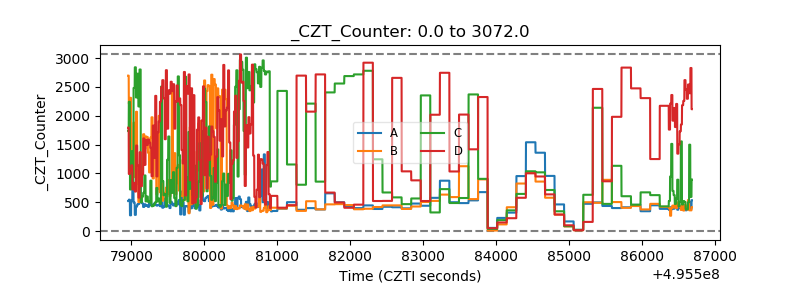 |
| +2.5 Volts monitor |  |
| +5 Volts monitor |  |
| _ROLL_ROT | 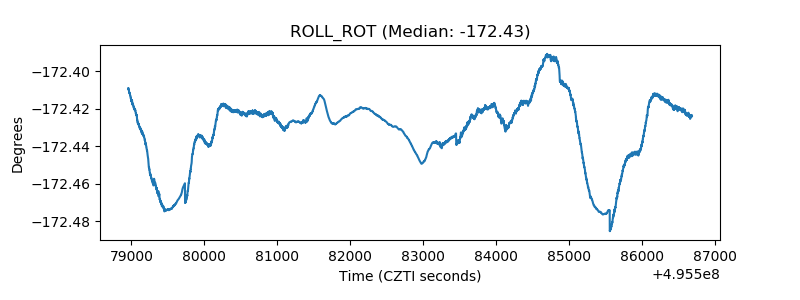 |
| _Roll_DEC | 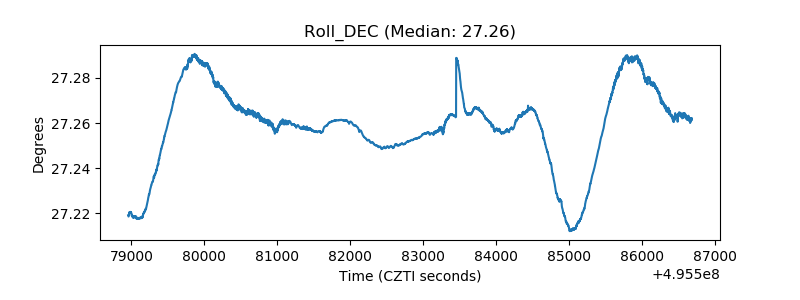 |
| _Roll_RA | 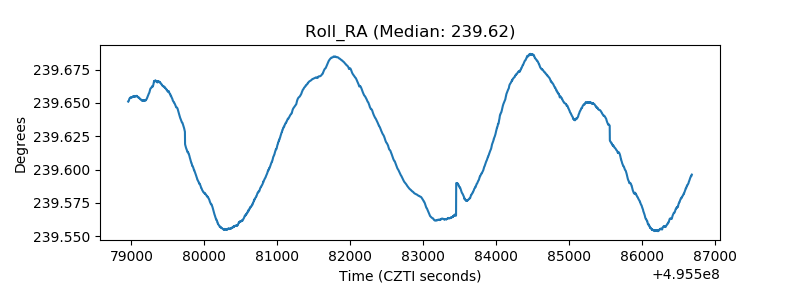 |
| Veto Counter | 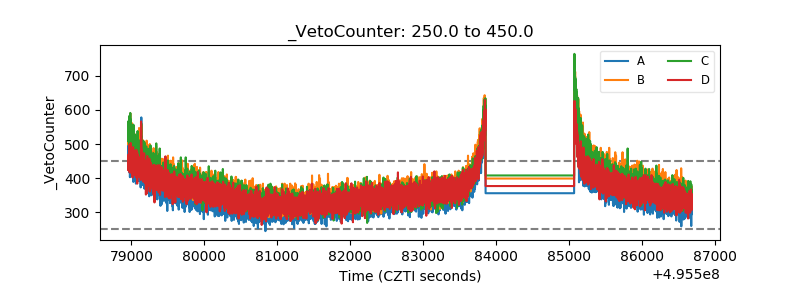 |