| Param | Original file | Final file |
|---|---|---|
| Filename | modeM0/AS1A14_057T04_9000006508_53908cztM0_level2.fits | modeM0/AS1A14_057T04_9000006508_53908cztM0_level2_quad_clean.evt |
| Size (bytes) | 688,256,640 | 89,280,000 |
| Size | 656.4 MB | 85.1 MB |
| Events in quadrant A | 3,514,955 | 655,562 |
| Events in quadrant B | 3,511,261 | 705,526 |
| Events in quadrant C | 6,731,898 | 567,291 |
| Events in quadrant D | 11,190,823 | 300,287 |
| Mode M0 | |||
|---|---|---|---|
| Quadrant | BADHDUFLAG | Total packets | Discarded packets |
| A | 0 | 15435 | 2 |
| B | 0 | 15097 | 2 |
| C | 0 | 24673 | 2 |
| D | 0 | 37957 | 2 |
| Mode SS | |||
|---|---|---|---|
| Quadrant | BADHDUFLAG | Total packets | Discarded packets |
| A | 0 | 140 | 0 |
| B | 0 | 140 | 0 |
| C | 0 | 140 | 0 |
| D | 0 | 140 | 0 |
| Mode M9 | |||
|---|---|---|---|
| Quadrant | BADHDUFLAG | Total packets | Discarded packets |
| A | 0 | 18 | 0 |
| B | 0 | 19 | 0 |
| C | 0 | 19 | 0 |
| D | 0 | 19 | 0 |
| Quadrant | Total seconds | Saturated seconds | Saturation percentage |
|---|---|---|---|
| A | 6801 | 213 | 3.131892% |
| B | 6801 | 160 | 2.352595% |
| C | 6801 | 978 | 14.380238% |
| D | 6801 | 3523 | 51.801206% |
Noise dominated data is calculated using 1-second bins in cleaned event files. If a bin has >2000 counts, and if more than 50% of those come from <1% of pixels, then it is considered to be noise-dominated and hence unusable.
| Quadrant | # 1 sec bins | Bins with >0 counts | Bins with >2000 counts | High rate bins dominated by noise | Noise dominated (total time) | Noise dominated (detector-on time) | Marked lightcurve |
|---|---|---|---|---|---|---|---|
| A | 7736 | 6802 | 83 | 83 | 1.07% | 1.22% | 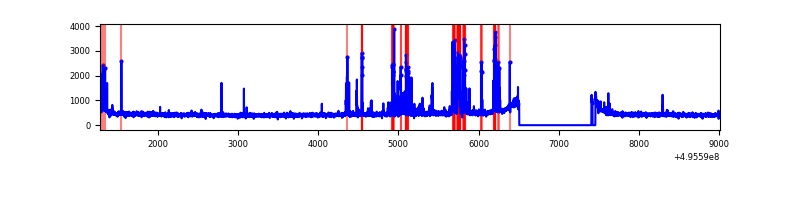 |
| B | 7736 | 6803 | 33 | 33 | 0.43% | 0.49% | 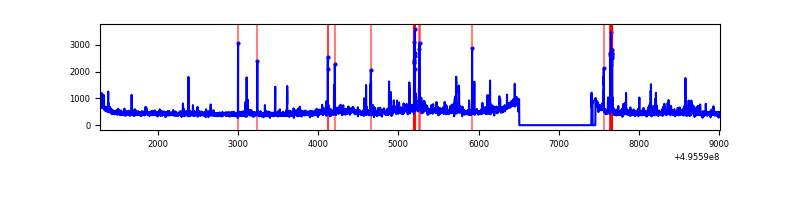 |
| C | 7736 | 6803 | 859 | 859 | 11.10% | 12.63% | 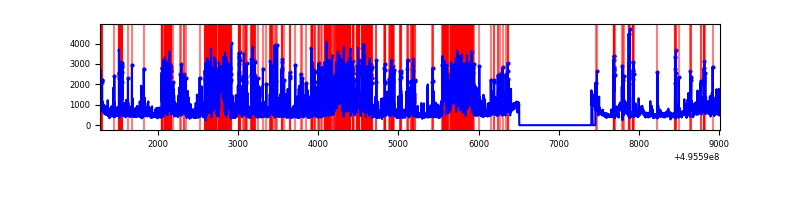 |
| D | 7736 | 6801 | 3112 | 3112 | 40.23% | 45.76% | 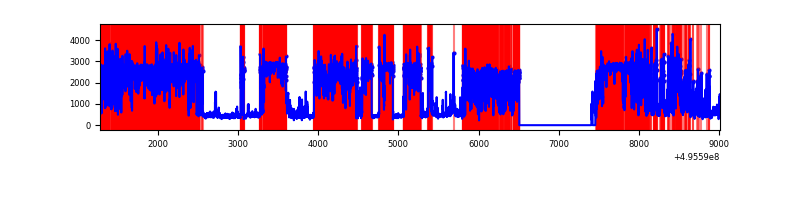 |
Top three noisy pixels from each quadrant. If the there are fewer than three noisy pixels in the level2.evt file, extra rows are filled as -1
| Pixel properties | Quadrant properties | ||||||
|---|---|---|---|---|---|---|---|
| Quadrant | DetID | PixID | Counts | Sigma | Mean | Median | Sigma |
| A | 15 | 174 | 259503 | 1373.47 | 764 | 743 | 188.4 |
| A | 0 | 8 | 171031 | 903.87 | 764 | 743 | 188.4 |
| A | 8 | 246 | 32302 | 167.51 | 764 | 743 | 188.4 |
| B | 7 | 0 | 121307 | 740.62 | 761 | 734 | 162.8 |
| B | 4 | 171 | 75363 | 458.41 | 761 | 734 | 162.8 |
| B | 10 | 247 | 54466 | 330.05 | 761 | 734 | 162.8 |
| C | 1 | 241 | 1691155 | 8672.82 | 708 | 700 | 194.9 |
| C | 15 | 224 | 1665328 | 8540.31 | 708 | 700 | 194.9 |
| C | 9 | 38 | 183317 | 936.91 | 708 | 700 | 194.9 |
| D | 8 | 176 | 5434727 | 39885.08 | 476 | 455 | 136.2 |
| D | 10 | 181 | 3062005 | 22470.38 | 476 | 455 | 136.2 |
| D | 3 | 12 | 546099 | 4004.78 | 476 | 455 | 136.2 |
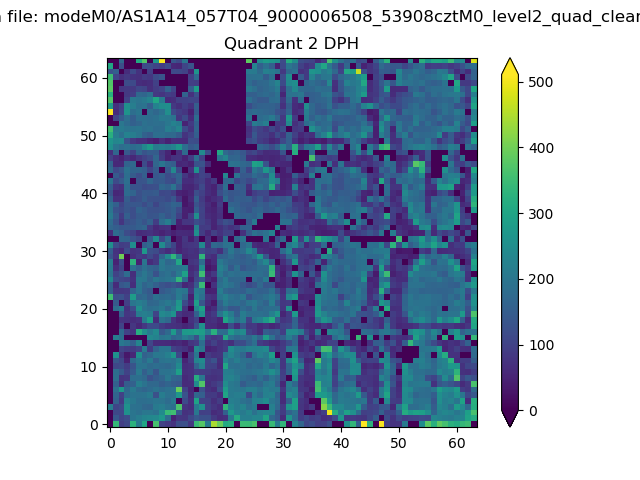
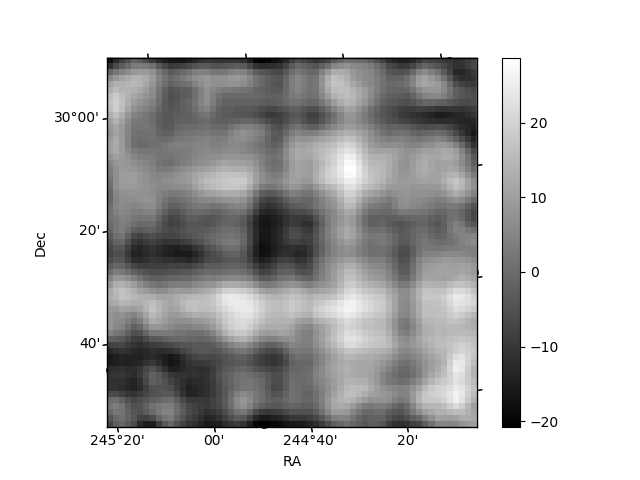
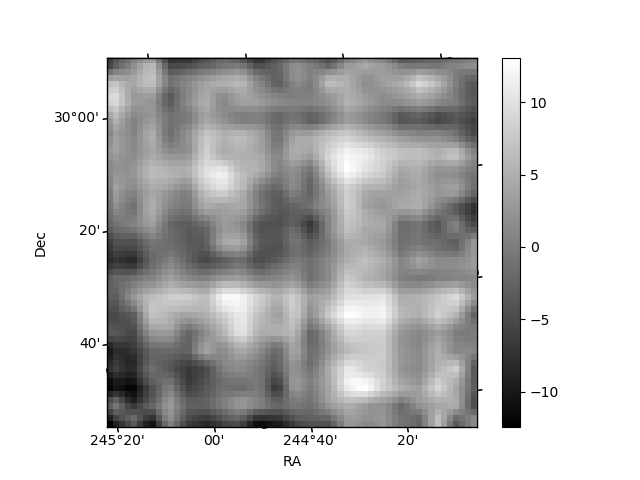
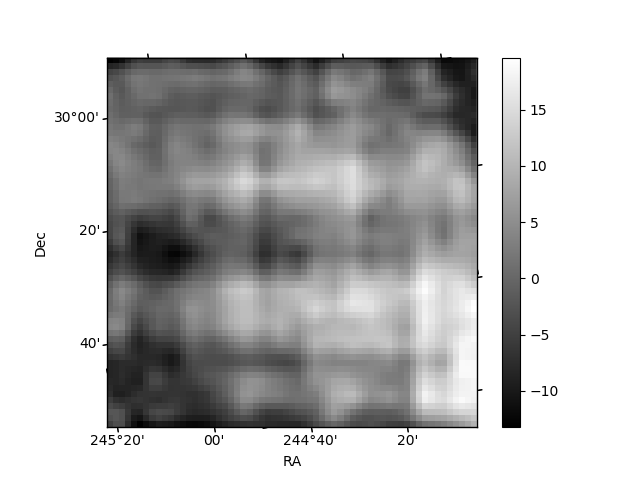
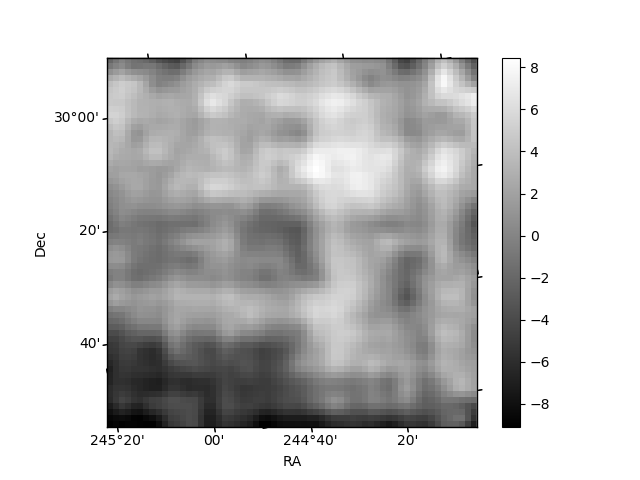
Histogram calculated using DETX and DETY for each event in the final _common_clean file
| Quadrant A | 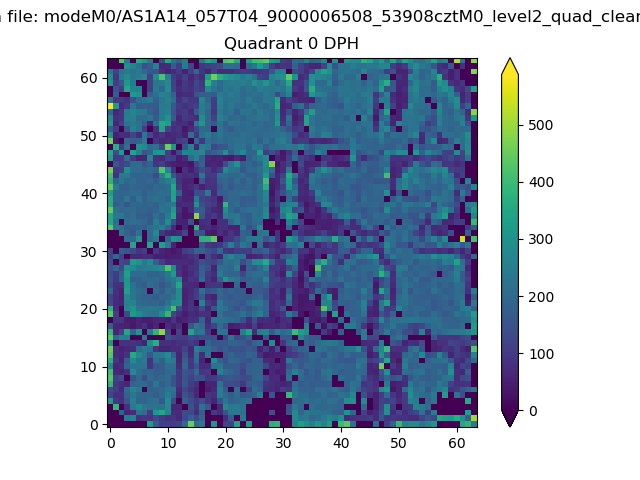 |
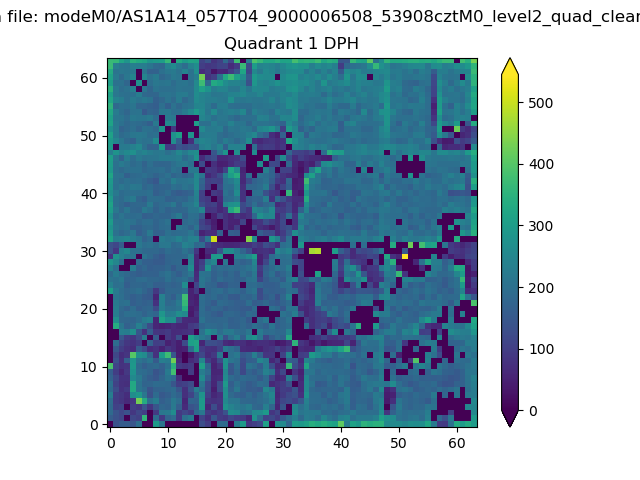 |
Quadrant B |
|---|---|---|---|
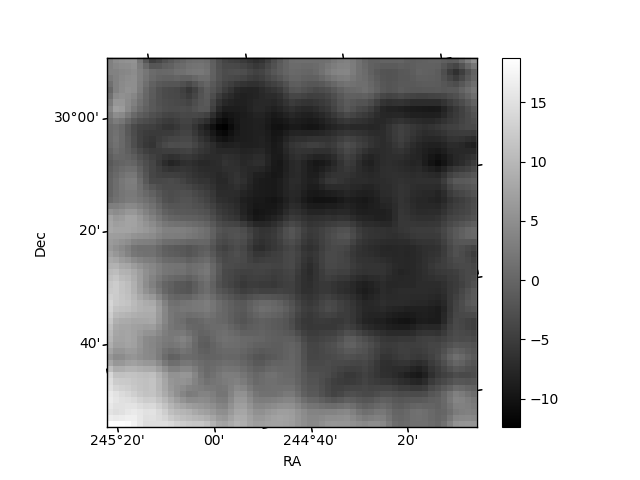
| Quadrant D | 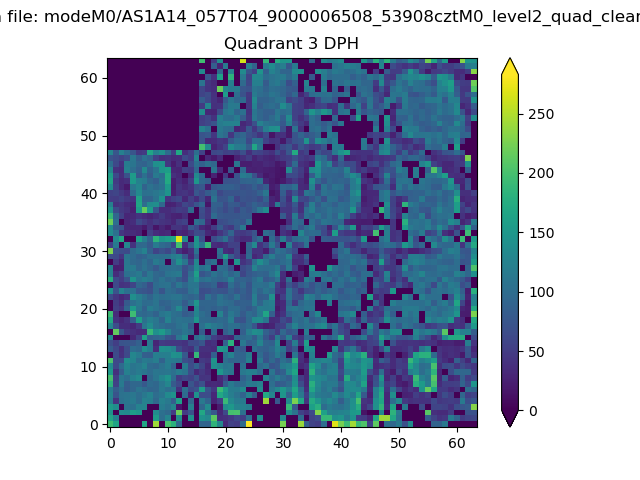 |
 |
Quadrant C |
| Plot type | Count rate plots | Images |
|---|---|---|
| Comparison with Poisson distribution Blue bars denote a histogram of data divided into 1 sec bins. Red curve is a Poisson curve with rate = median count rate of data. |
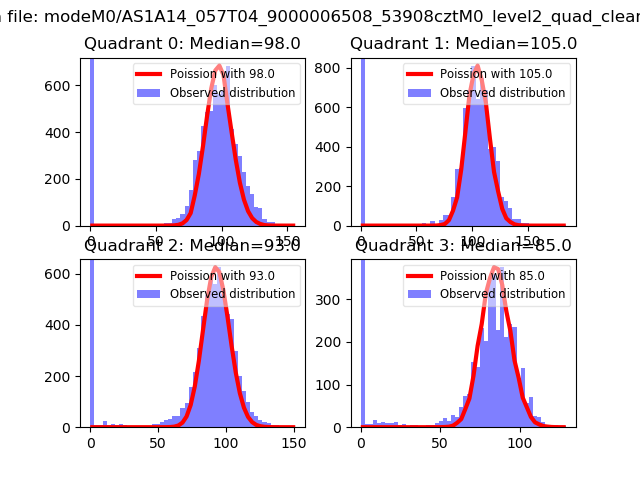 |
 |
| Quadrant-wise count rates Data is divided into 100 sec bins |
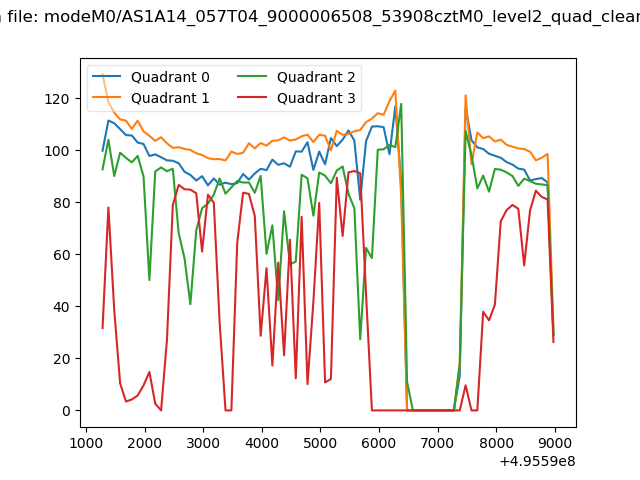 |
|
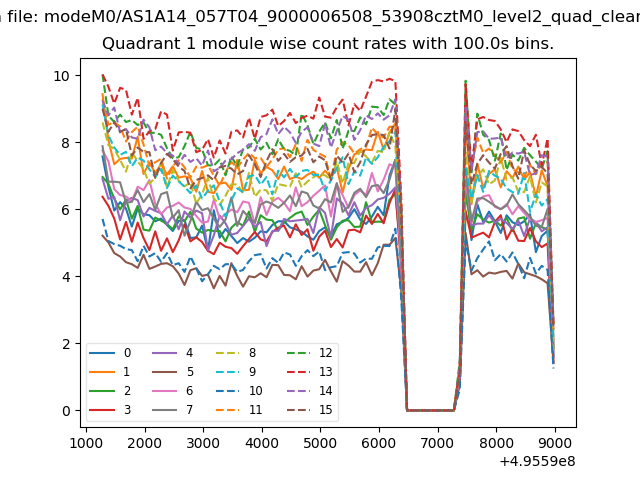
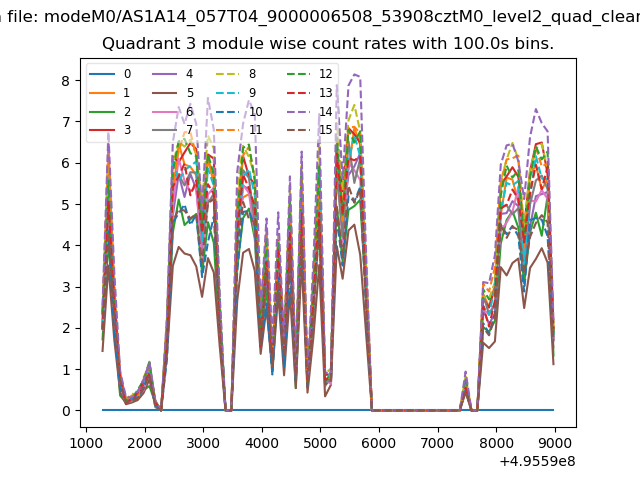
| Module-wise count rates for Quadrant A Data is divided into 100 sec bins |
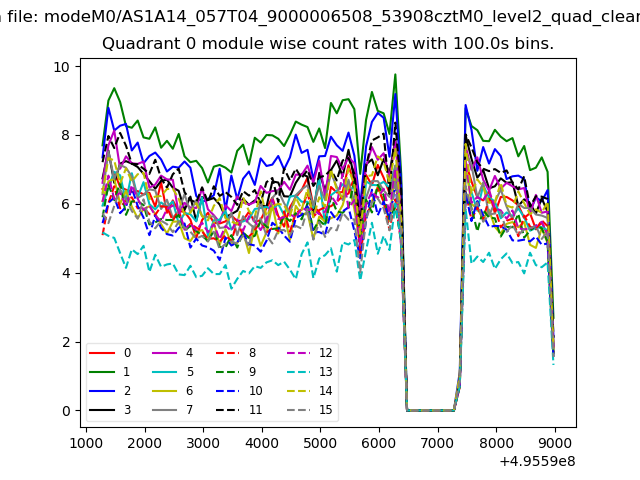 |
 |
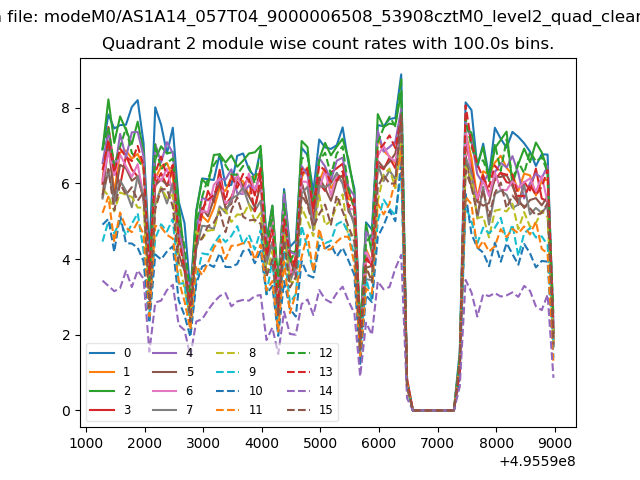
| Module-wise count rates for Quadrant B Data is divided into 100 sec bins |
 |
 |
| Module-wise count rates for Quadrant C Data is divided into 100 sec bins |
 |
 |
| Module-wise count rates for Quadrant D Data is divided into 100 sec bins |
 |
 |
| Parameter | Plot |
|---|---|
| CZT HV Monitor |  |
| D_VDD | 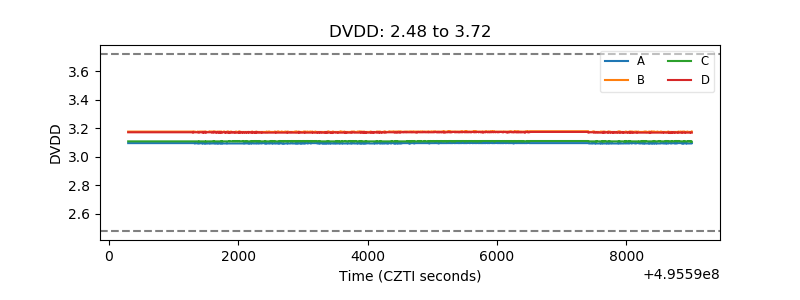 |
| Temperature 1 | 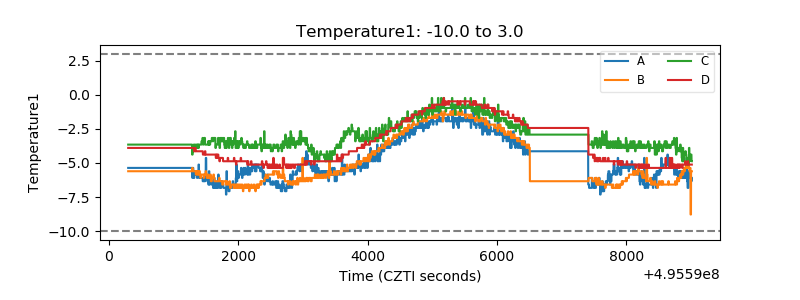 |
| Veto HV Monitor | 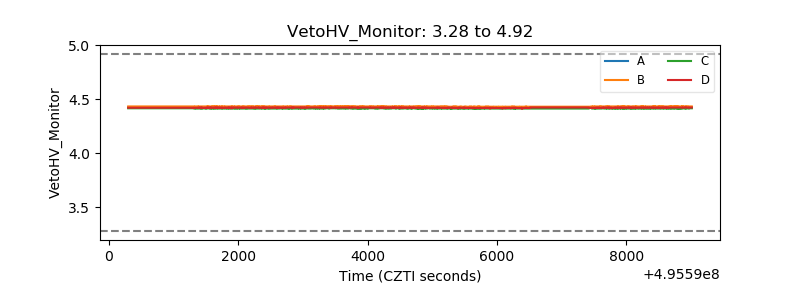 |
| Veto LLD | 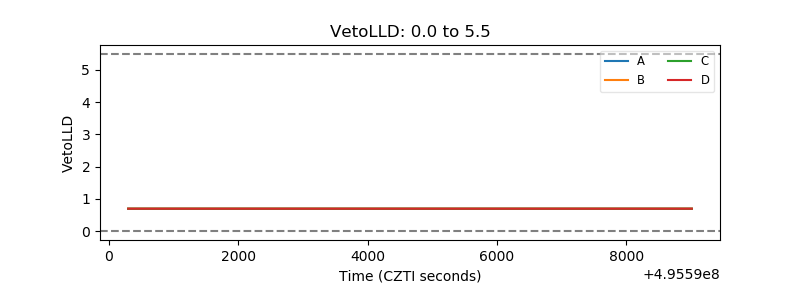 |
| Alpha Counter | 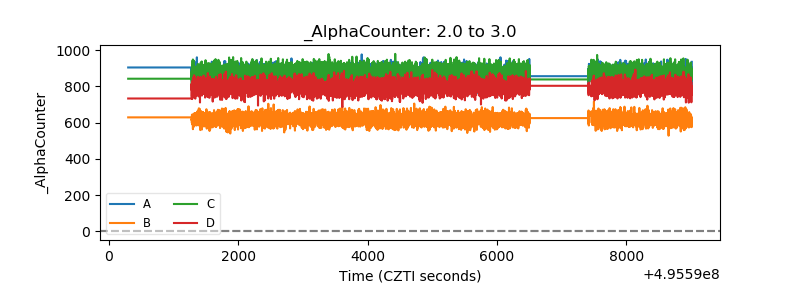 |
| _CPM_Rate | 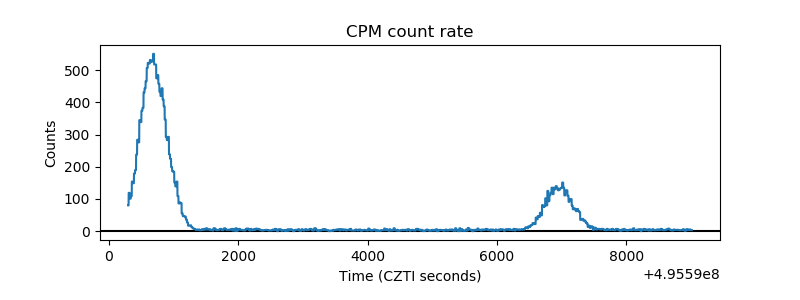 |
| CZT Counter | 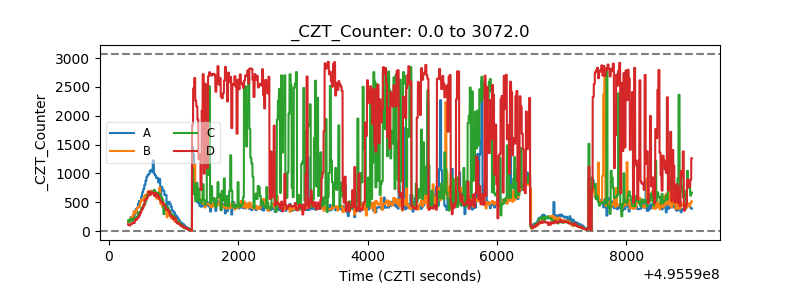 |
| +2.5 Volts monitor | 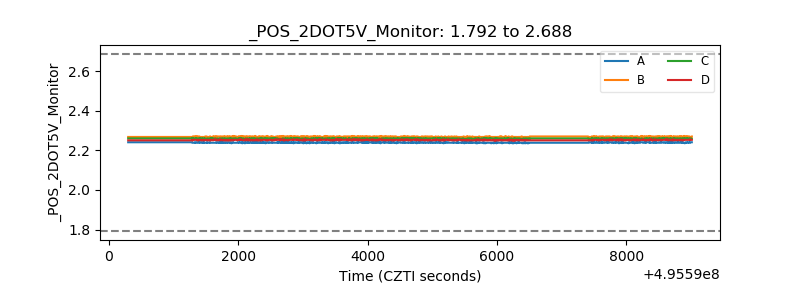 |
| +5 Volts monitor | 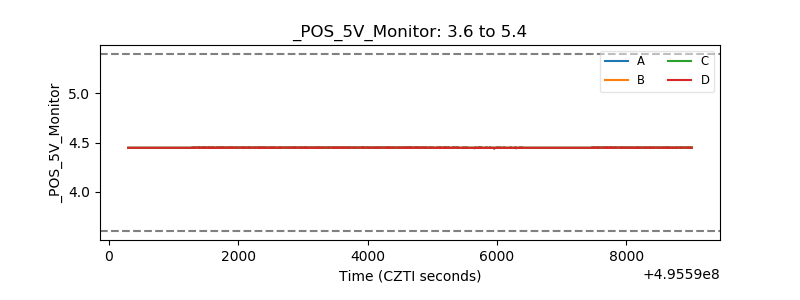 |
| _ROLL_ROT | 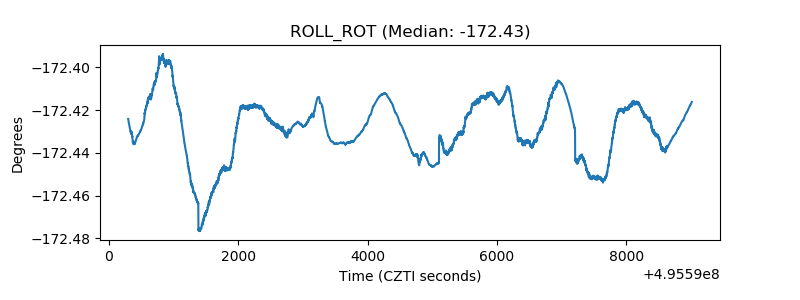 |
| _Roll_DEC | 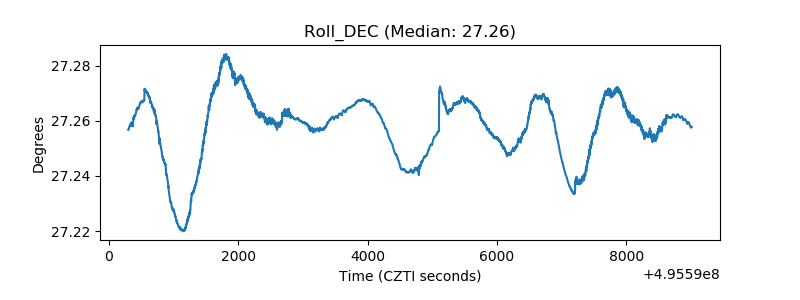 |
| _Roll_RA | 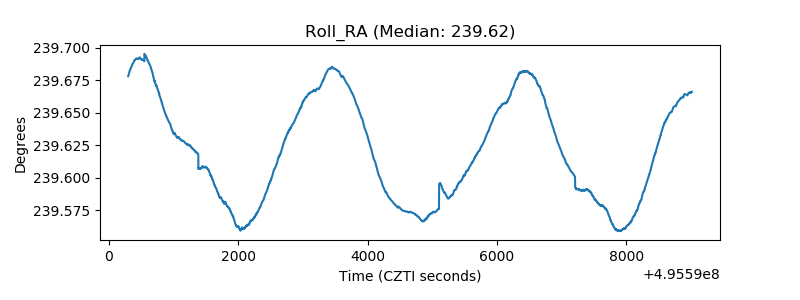 |
| Veto Counter | 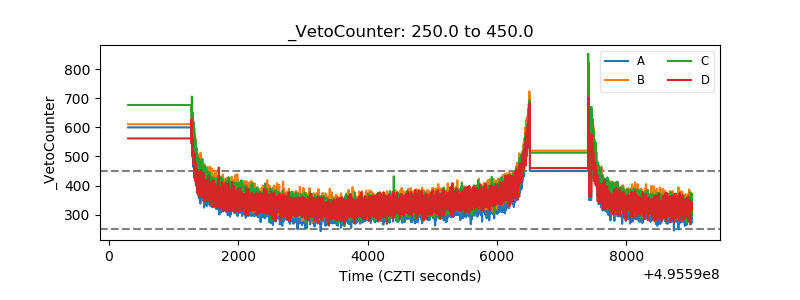 |