| Param | Original file | Final file |
|---|---|---|
| Filename | modeM0/AS1A14_057T04_9000006508_53909cztM0_level2.fits | modeM0/AS1A14_057T04_9000006508_53909cztM0_level2_quad_clean.evt |
| Size (bytes) | 740,208,960 | 99,535,680 |
| Size | 705.9 MB | 94.9 MB |
| Events in quadrant A | 3,855,953 | 745,416 |
| Events in quadrant B | 4,385,933 | 778,589 |
| Events in quadrant C | 4,954,916 | 688,750 |
| Events in quadrant D | 13,613,080 | 272,009 |
| Mode M0 | |||
|---|---|---|---|
| Quadrant | BADHDUFLAG | Total packets | Discarded packets |
| A | 0 | 16943 | 3 |
| B | 0 | 18280 | 3 |
| C | 0 | 20068 | 3 |
| D | 0 | 45709 | 3 |
| Mode SS | |||
|---|---|---|---|
| Quadrant | BADHDUFLAG | Total packets | Discarded packets |
| A | 0 | 158 | 0 |
| B | 0 | 158 | 0 |
| C | 0 | 158 | 0 |
| D | 0 | 158 | 0 |
| Mode M9 | |||
|---|---|---|---|
| Quadrant | BADHDUFLAG | Total packets | Discarded packets |
| A | 0 | 13 | 0 |
| B | 0 | 13 | 0 |
| C | 0 | 13 | 0 |
| D | 0 | 13 | 0 |
| Quadrant | Total seconds | Saturated seconds | Saturation percentage |
|---|---|---|---|
| A | 7597 | 263 | 3.461893% |
| B | 7596 | 348 | 4.581359% |
| C | 7596 | 381 | 5.015798% |
| D | 7597 | 4525 | 59.562985% |
Noise dominated data is calculated using 1-second bins in cleaned event files. If a bin has >2000 counts, and if more than 50% of those come from <1% of pixels, then it is considered to be noise-dominated and hence unusable.
| Quadrant | # 1 sec bins | Bins with >0 counts | Bins with >2000 counts | High rate bins dominated by noise | Noise dominated (total time) | Noise dominated (detector-on time) | Marked lightcurve |
|---|---|---|---|---|---|---|---|
| A | 9022 | 7599 | 47 | 47 | 0.52% | 0.62% | 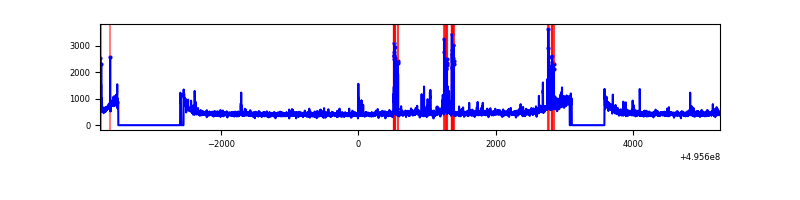 |
| B | 9021 | 7598 | 49 | 49 | 0.54% | 0.64% | 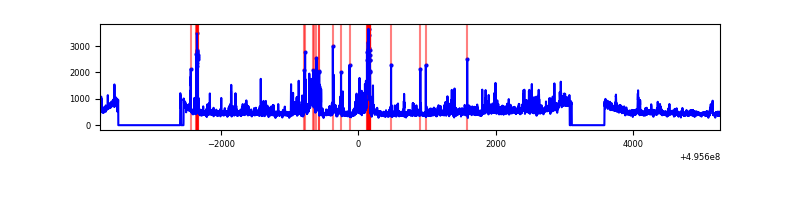 |
| C | 9021 | 7599 | 183 | 183 | 2.03% | 2.41% | 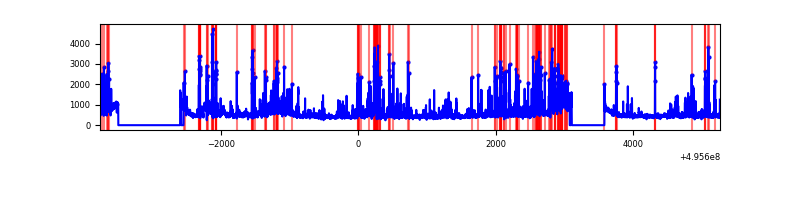 |
| D | 9021 | 7596 | 4040 | 4040 | 44.78% | 53.19% | 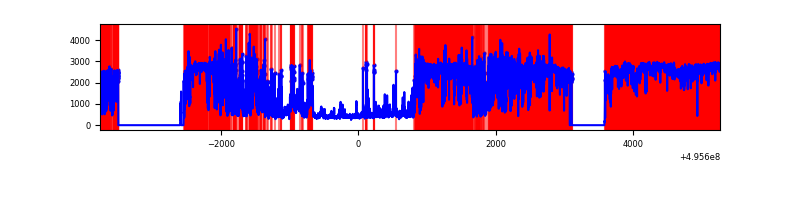 |
Top three noisy pixels from each quadrant. If the there are fewer than three noisy pixels in the level2.evt file, extra rows are filled as -1
| Pixel properties | Quadrant properties | ||||||
|---|---|---|---|---|---|---|---|
| Quadrant | DetID | PixID | Counts | Sigma | Mean | Median | Sigma |
| A | 15 | 174 | 211578 | 954.91 | 887 | 866 | 220.7 |
| A | 8 | 246 | 33840 | 149.43 | 887 | 866 | 220.7 |
| A | 10 | 253 | 33628 | 148.47 | 887 | 866 | 220.7 |
| B | 5 | 250 | 314524 | 1666.36 | 870 | 838 | 188.2 |
| B | 4 | 171 | 219567 | 1161.93 | 870 | 838 | 188.2 |
| B | 5 | 172 | 177119 | 936.44 | 870 | 838 | 188.2 |
| C | 15 | 224 | 713141 | 3083.09 | 844 | 840 | 231.0 |
| C | 13 | 3 | 303138 | 1308.45 | 844 | 840 | 231.0 |
| C | 9 | 38 | 268481 | 1158.45 | 844 | 840 | 231.0 |
| D | 8 | 176 | 10893724 | 87460.35 | 431 | 412 | 124.6 |
| D | 3 | 12 | 664748 | 5333.83 | 431 | 412 | 124.6 |
| D | 10 | 181 | 178295 | 1428.19 | 431 | 412 | 124.6 |
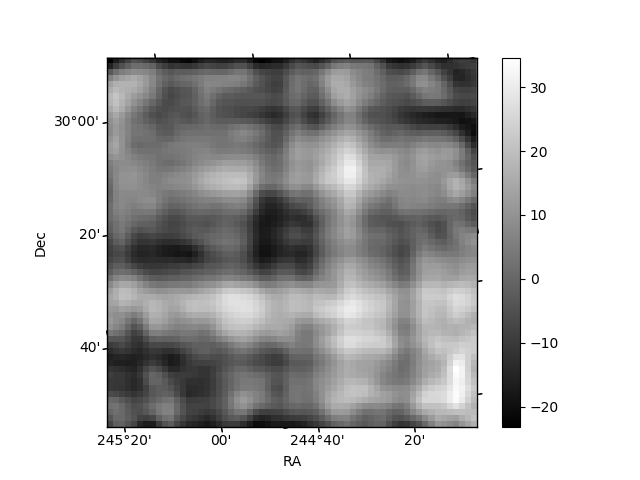
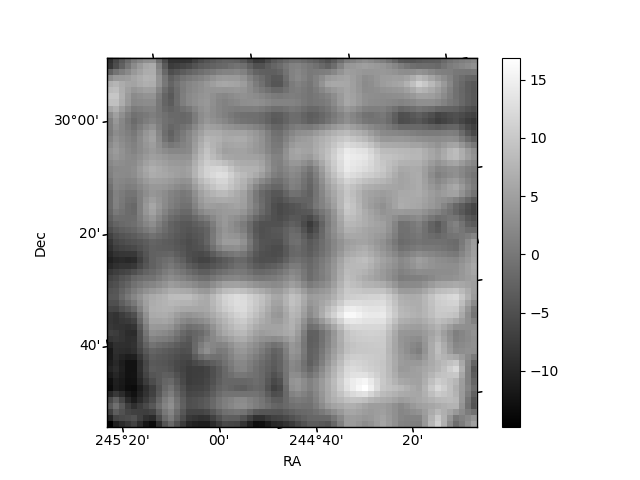
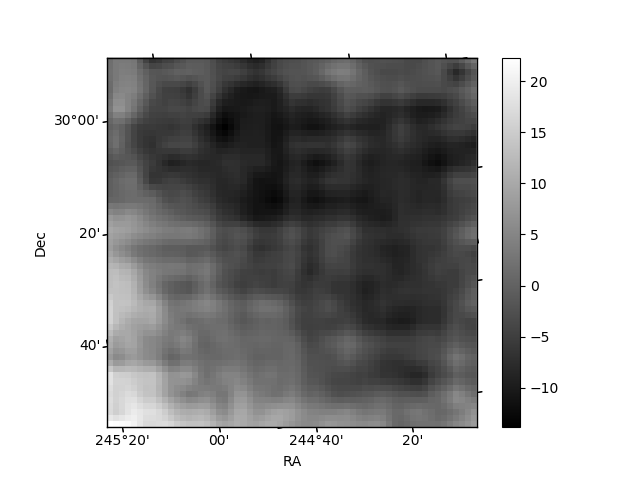
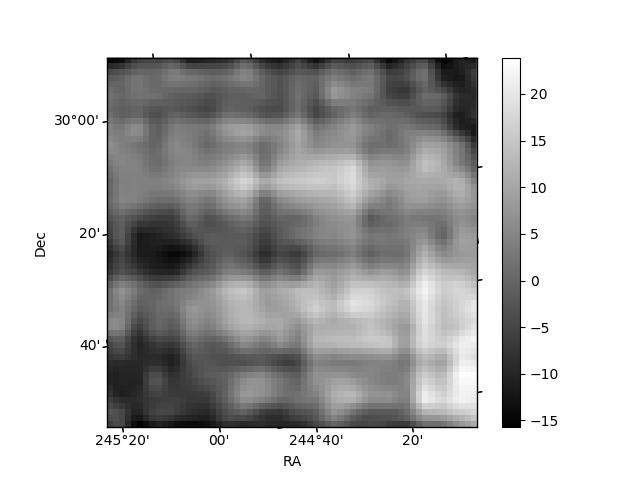
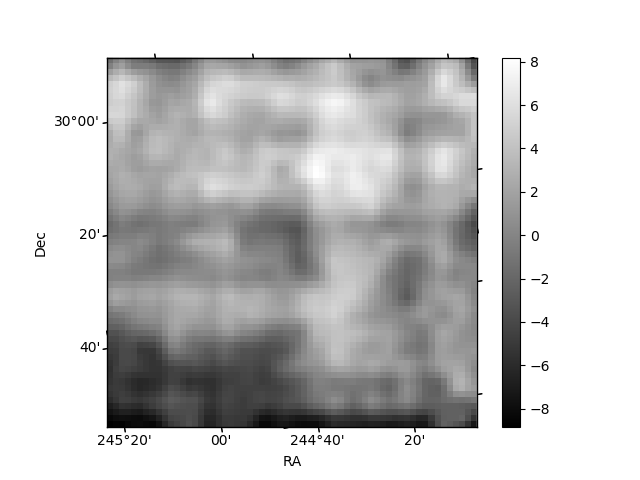
Histogram calculated using DETX and DETY for each event in the final _common_clean file
| Quadrant A | 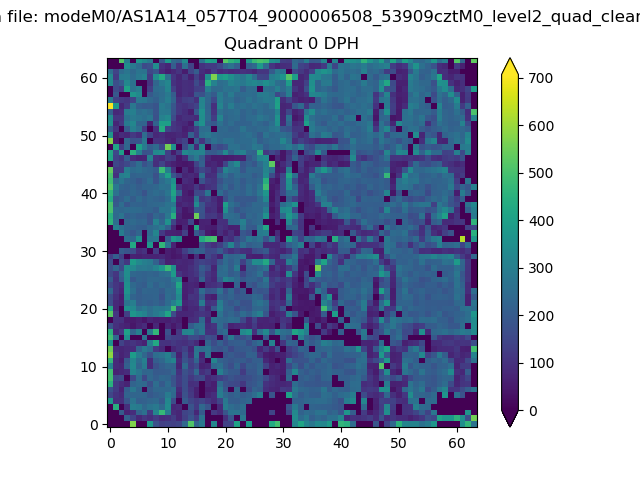 |
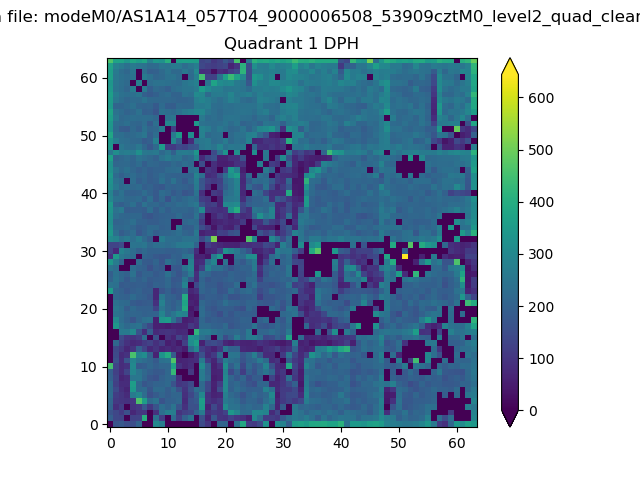 |
Quadrant B |
|---|---|---|---|
| Quadrant D | 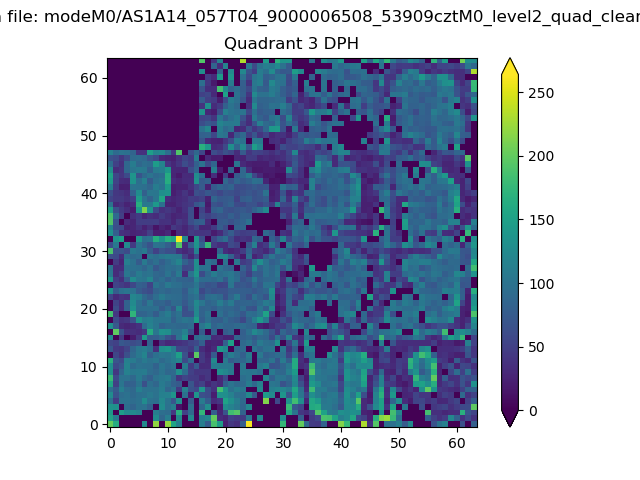 |
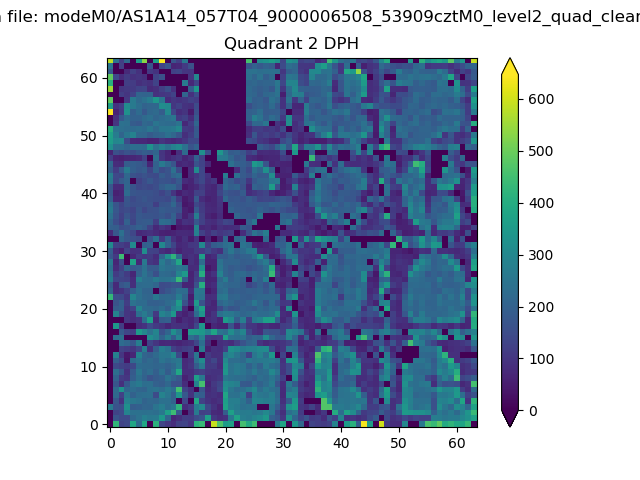 |
Quadrant C |
| Plot type | Count rate plots | Images |
|---|---|---|
| Comparison with Poisson distribution Blue bars denote a histogram of data divided into 1 sec bins. Red curve is a Poisson curve with rate = median count rate of data. |
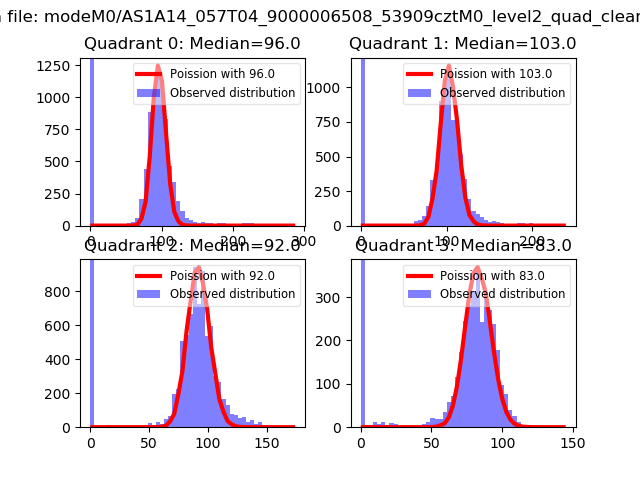 |
 |
| Quadrant-wise count rates Data is divided into 100 sec bins |
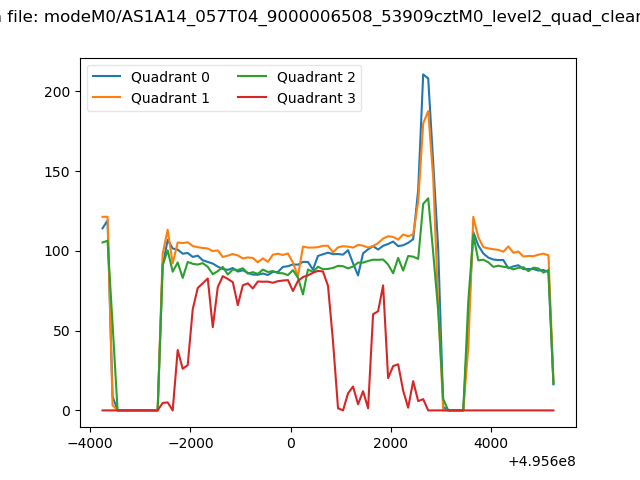 |
|
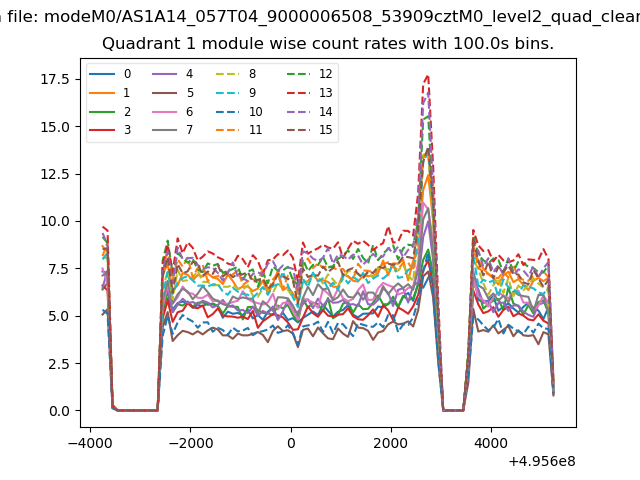
| Module-wise count rates for Quadrant A Data is divided into 100 sec bins |
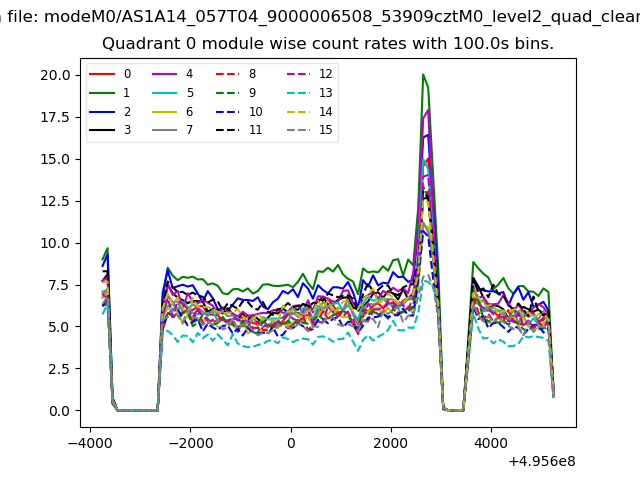 |
 |
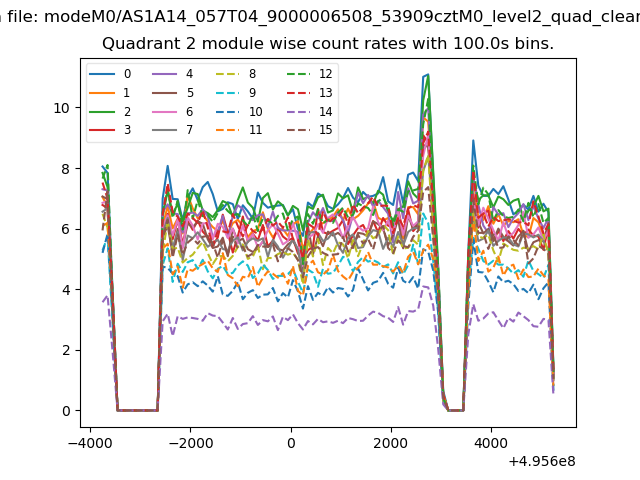
| Module-wise count rates for Quadrant B Data is divided into 100 sec bins |
 |
 |
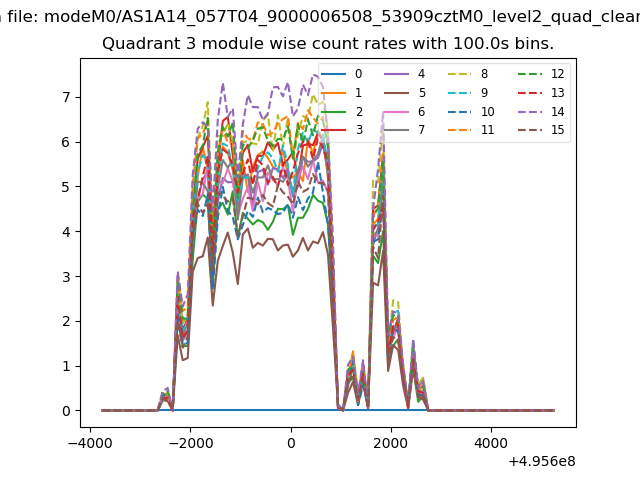
| Module-wise count rates for Quadrant C Data is divided into 100 sec bins |
 |
 |
| Module-wise count rates for Quadrant D Data is divided into 100 sec bins |
 |
 |
| Parameter | Plot |
|---|---|
| CZT HV Monitor | 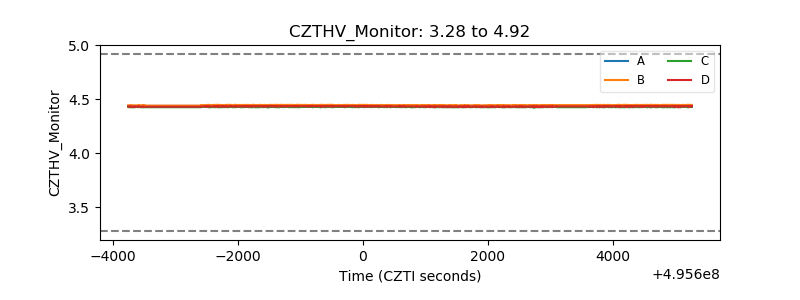 |
| D_VDD | 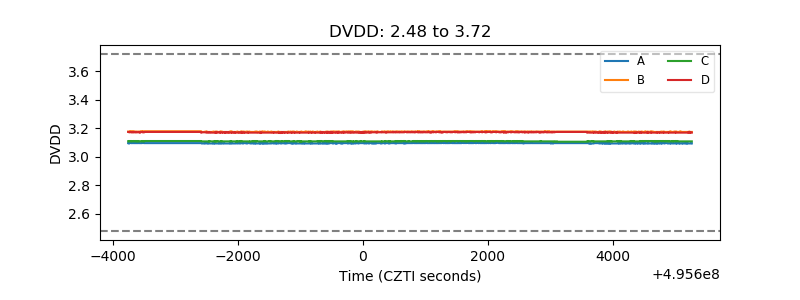 |
| Temperature 1 | 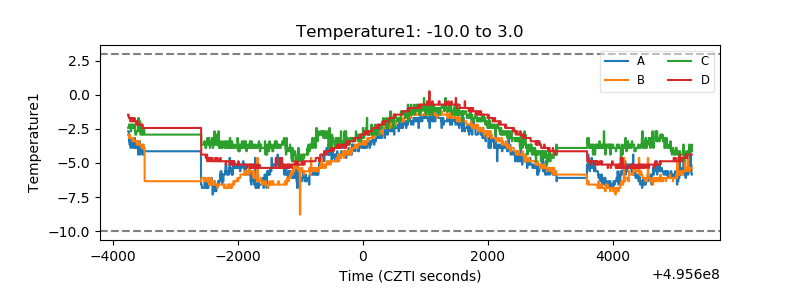 |
| Veto HV Monitor | 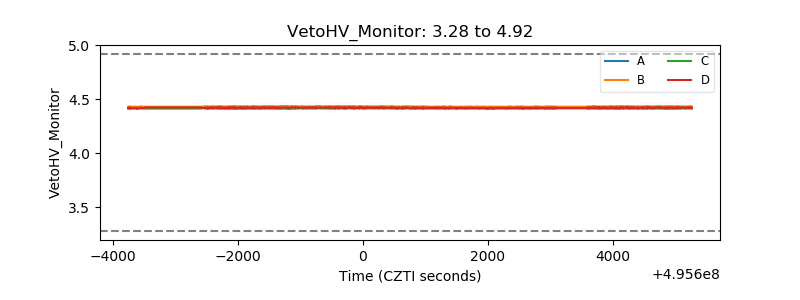 |
| Veto LLD | 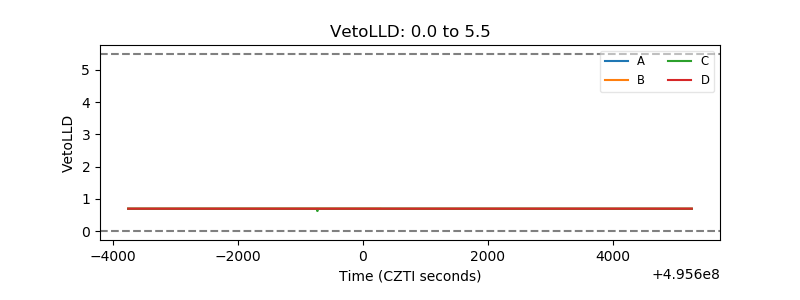 |
| Alpha Counter | 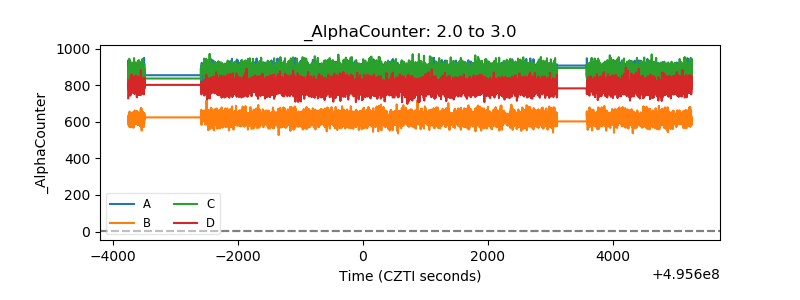 |
| _CPM_Rate | 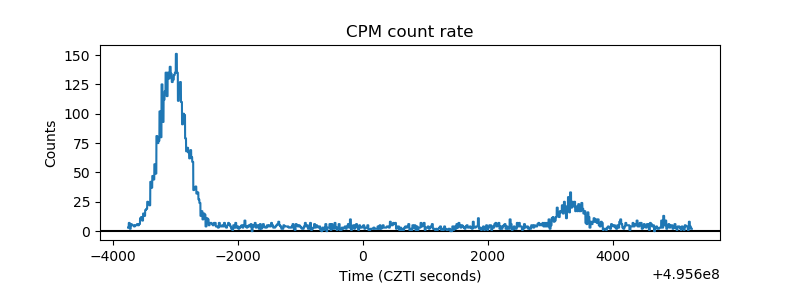 |
| CZT Counter | 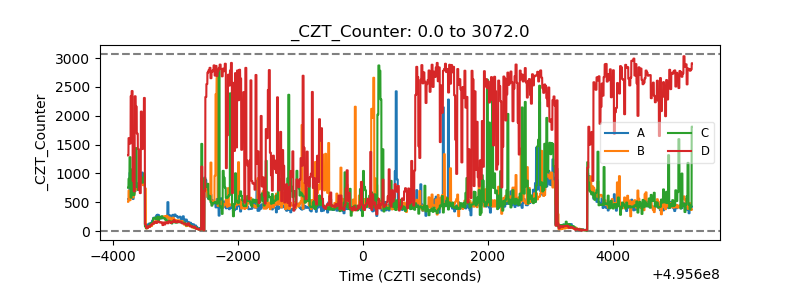 |
| +2.5 Volts monitor | 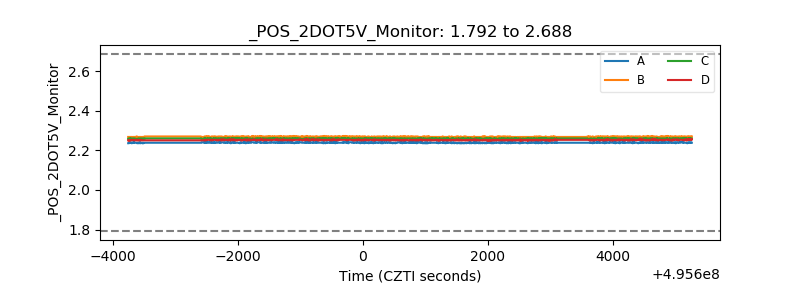 |
| +5 Volts monitor | 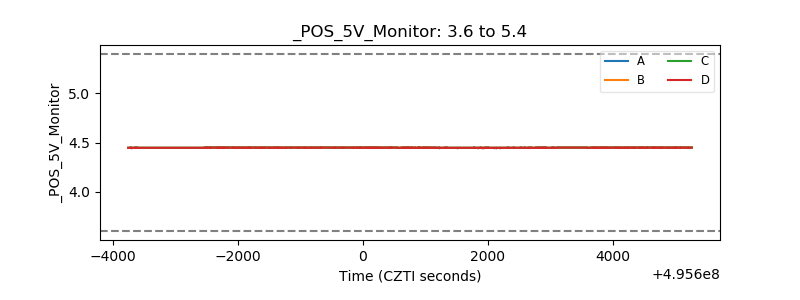 |
| _ROLL_ROT | 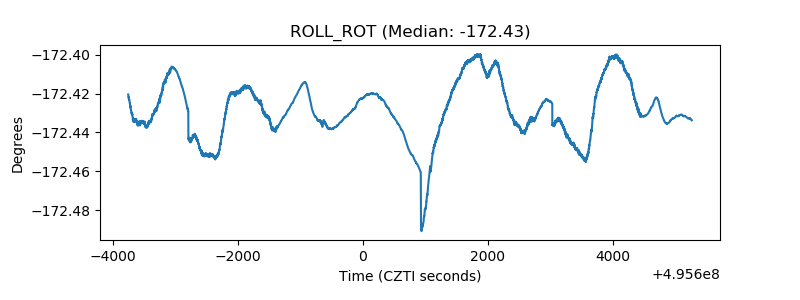 |
| _Roll_DEC | 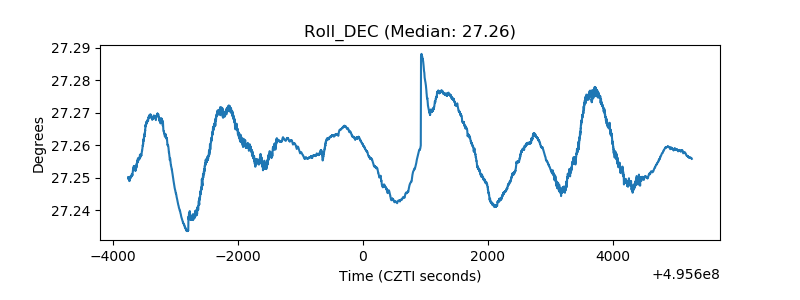 |
| _Roll_RA | 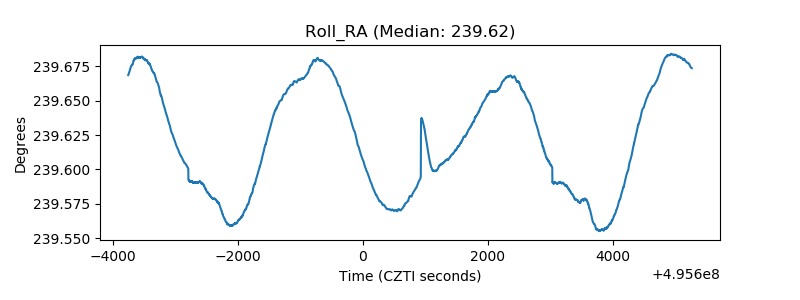 |
| Veto Counter | 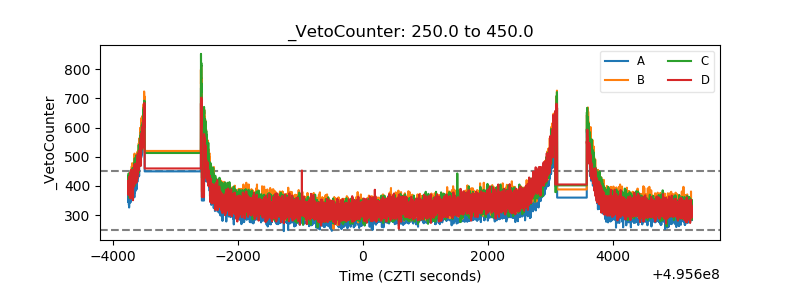 |