| Param | Original file | Final file |
|---|---|---|
| Filename | modeM0/AS1A14_057T04_9000006508_53910cztM0_level2.fits | modeM0/AS1A14_057T04_9000006508_53910cztM0_level2_quad_clean.evt |
| Size (bytes) | 776,053,440 | 90,881,280 |
| Size | 740.1 MB | 86.7 MB |
| Events in quadrant A | 3,866,233 | 693,121 |
| Events in quadrant B | 3,629,669 | 744,346 |
| Events in quadrant C | 5,155,900 | 635,588 |
| Events in quadrant D | 15,510,736 | 172,561 |
| Mode M0 | |||
|---|---|---|---|
| Quadrant | BADHDUFLAG | Total packets | Discarded packets |
| A | 0 | 16666 | 0 |
| B | 0 | 15715 | 0 |
| C | 0 | 20393 | 0 |
| D | 0 | 51074 | 0 |
| Mode SS | |||
|---|---|---|---|
| Quadrant | BADHDUFLAG | Total packets | Discarded packets |
| A | 0 | 146 | 0 |
| B | 0 | 146 | 0 |
| C | 0 | 146 | 0 |
| D | 0 | 146 | 0 |
| Quadrant | Total seconds | Saturated seconds | Saturation percentage |
|---|---|---|---|
| A | 7268 | 165 | 2.270226% |
| B | 7268 | 84 | 1.155751% |
| C | 7268 | 366 | 5.035773% |
| D | 7268 | 5371 | 73.899285% |
Noise dominated data is calculated using 1-second bins in cleaned event files. If a bin has >2000 counts, and if more than 50% of those come from <1% of pixels, then it is considered to be noise-dominated and hence unusable.
| Quadrant | # 1 sec bins | Bins with >0 counts | Bins with >2000 counts | High rate bins dominated by noise | Noise dominated (total time) | Noise dominated (detector-on time) | Marked lightcurve |
|---|---|---|---|---|---|---|---|
| A | 7268 | 7268 | 134 | 134 | 1.84% | 1.84% | 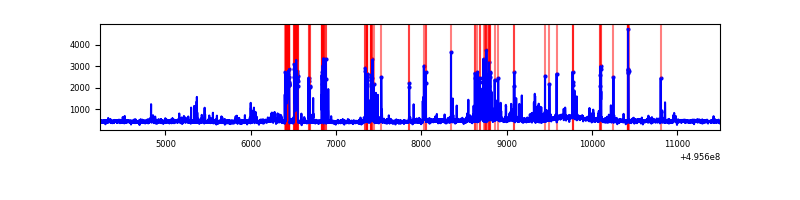 |
| B | 7268 | 7268 | 10 | 10 | 0.14% | 0.14% | 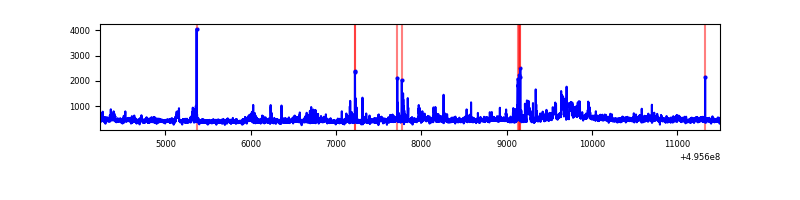 |
| C | 7268 | 7268 | 324 | 324 | 4.46% | 4.46% | 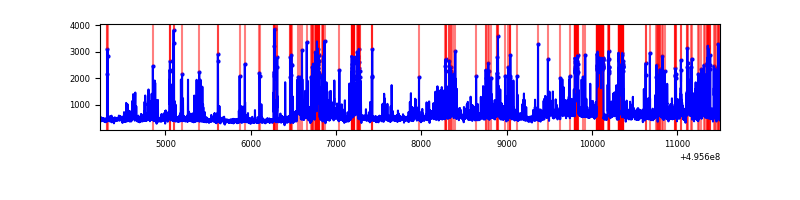 |
| D | 7267 | 7267 | 4999 | 4999 | 68.79% | 68.79% | 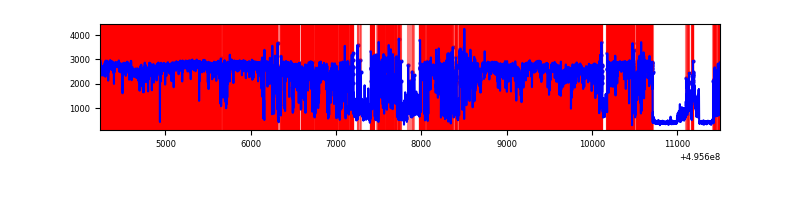 |
Top three noisy pixels from each quadrant. If the there are fewer than three noisy pixels in the level2.evt file, extra rows are filled as -1
| Pixel properties | Quadrant properties | ||||||
|---|---|---|---|---|---|---|---|
| Quadrant | DetID | PixID | Counts | Sigma | Mean | Median | Sigma |
| A | 4 | 249 | 398695 | 2029.37 | 793 | 773 | 196.1 |
| A | 15 | 174 | 240655 | 1223.38 | 793 | 773 | 196.1 |
| A | 4 | 207 | 25314 | 125.16 | 793 | 773 | 196.1 |
| B | 5 | 250 | 225096 | 1336.05 | 790 | 764 | 167.9 |
| B | 7 | 0 | 106872 | 631.95 | 790 | 764 | 167.9 |
| B | 0 | 213 | 29488 | 171.07 | 790 | 764 | 167.9 |
| C | 15 | 224 | 1019302 | 4894.26 | 758 | 752 | 208.1 |
| C | 1 | 44 | 402961 | 1932.67 | 758 | 752 | 208.1 |
| C | 12 | 254 | 355791 | 1706.01 | 758 | 752 | 208.1 |
| D | 8 | 176 | 13255460 | 135112.8 | 341 | 325 | 98.1 |
| D | 2 | 16 | 319093 | 3249.28 | 341 | 325 | 98.1 |
| D | 3 | 12 | 210520 | 2142.57 | 341 | 325 | 98.1 |
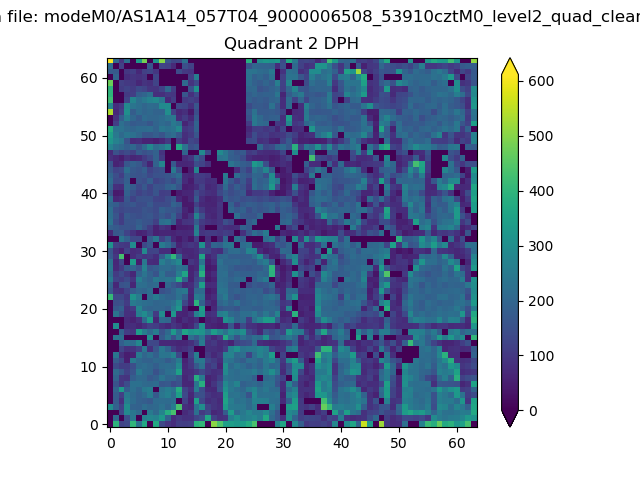
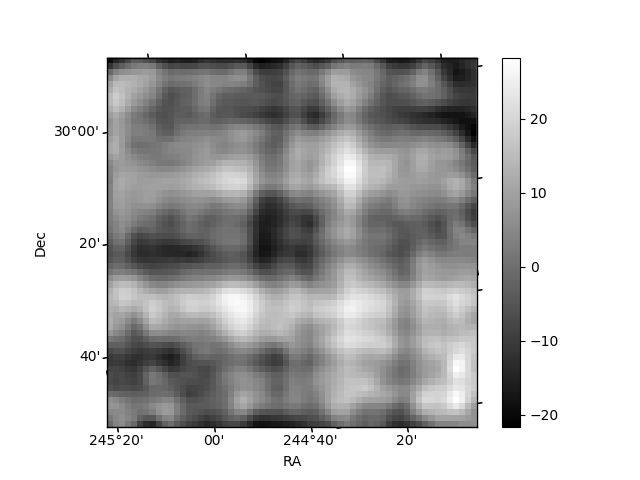
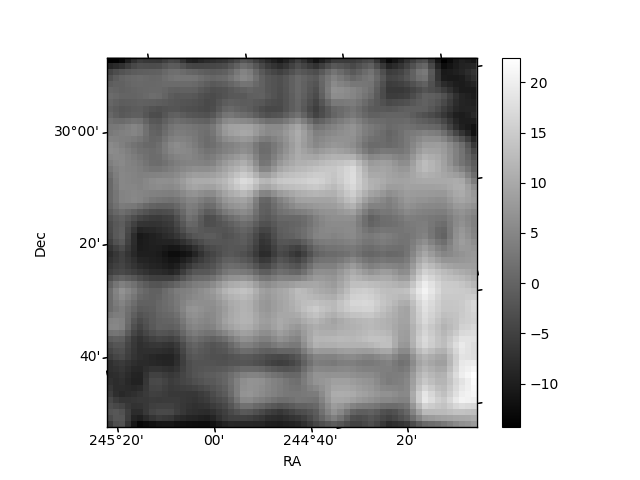
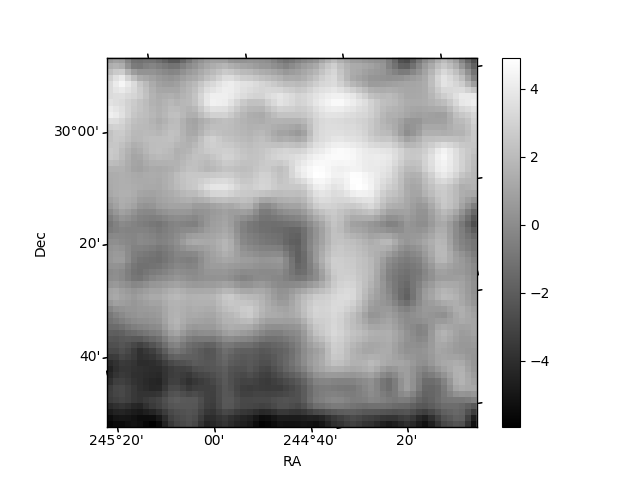
Histogram calculated using DETX and DETY for each event in the final _common_clean file
| Quadrant A | 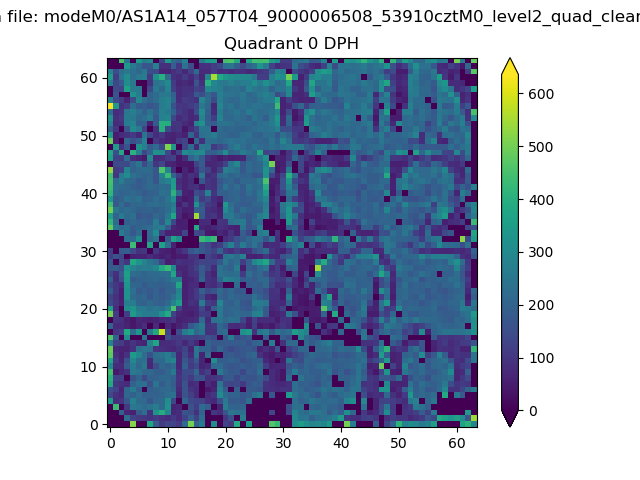 |
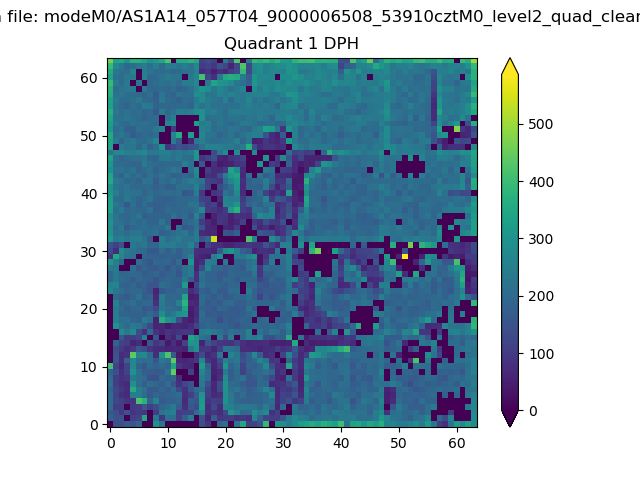 |
Quadrant B |
|---|---|---|---|
| Quadrant D | 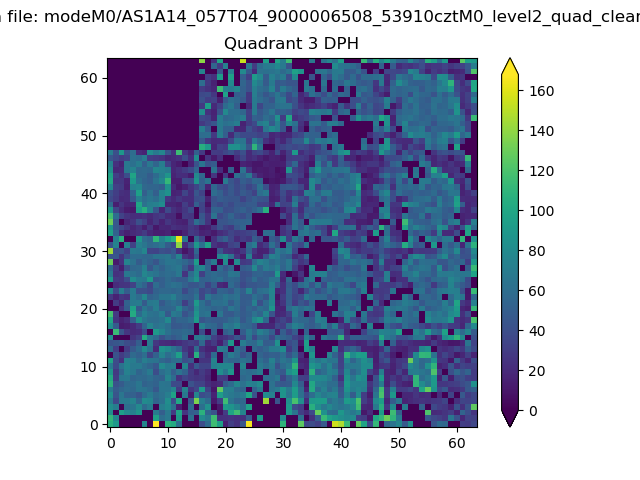 |
 |
Quadrant C |
| Plot type | Count rate plots | Images |
|---|---|---|
| Comparison with Poisson distribution Blue bars denote a histogram of data divided into 1 sec bins. Red curve is a Poisson curve with rate = median count rate of data. |
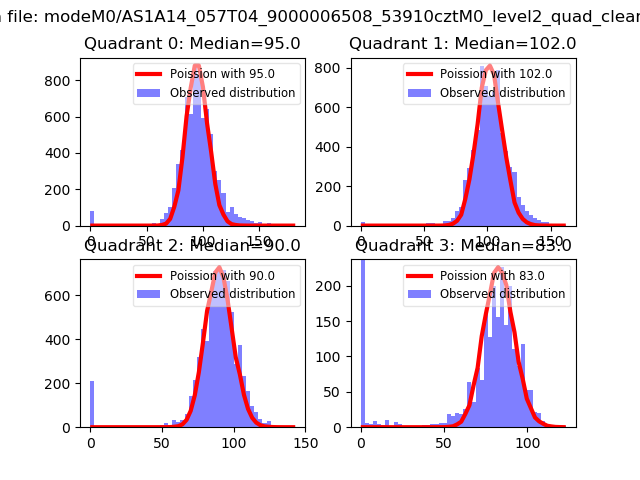 |
 |
| Quadrant-wise count rates Data is divided into 100 sec bins |
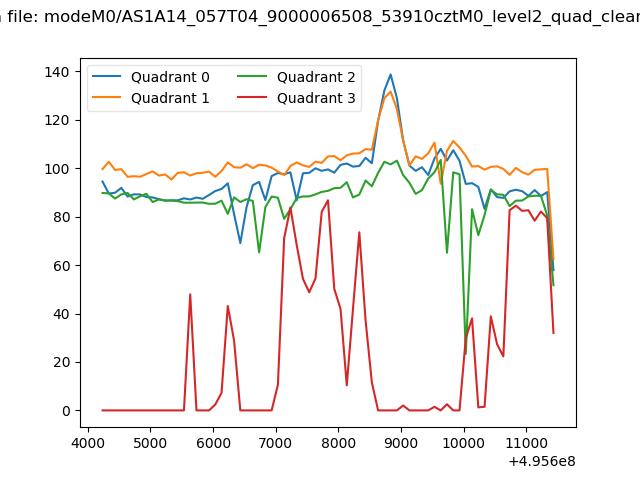 |
|
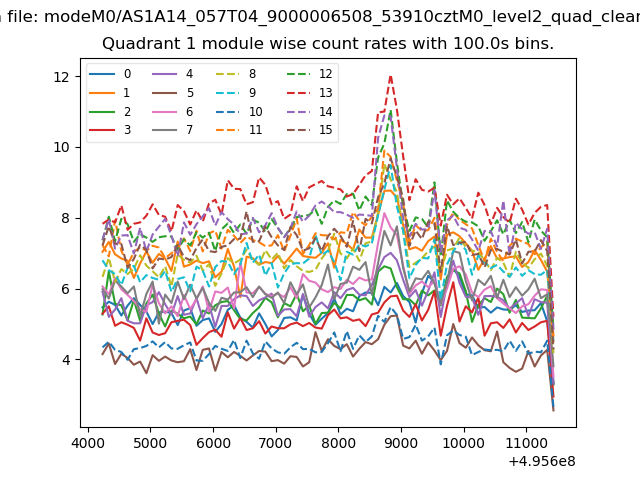
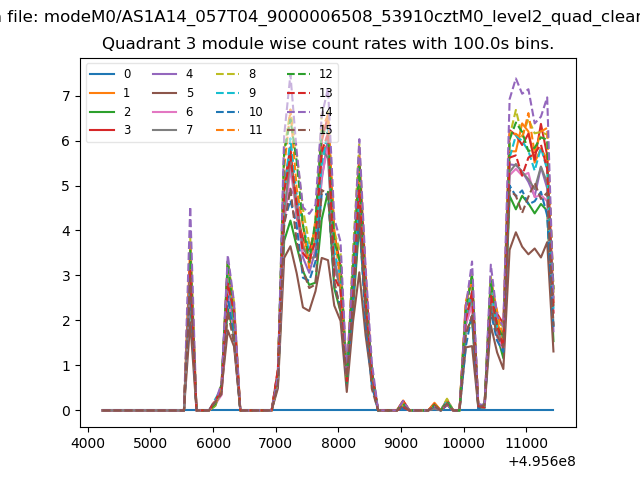
| Module-wise count rates for Quadrant A Data is divided into 100 sec bins |
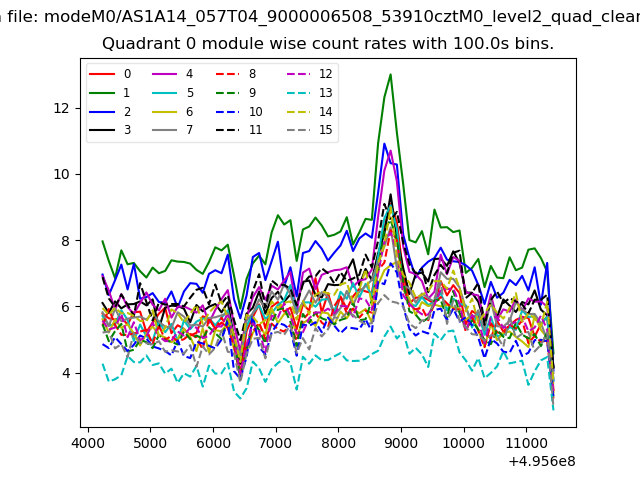 |
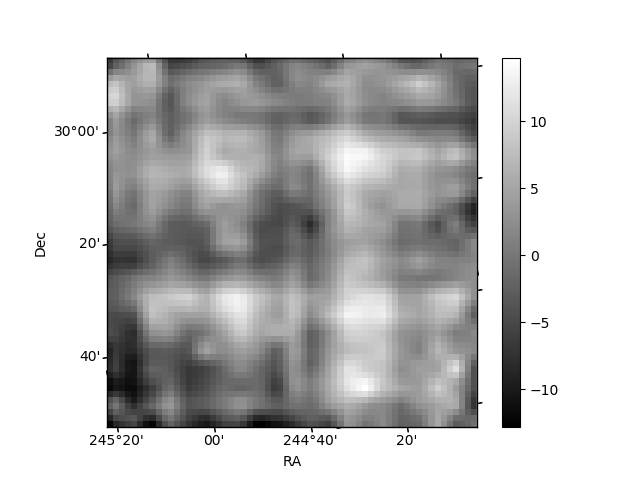 |
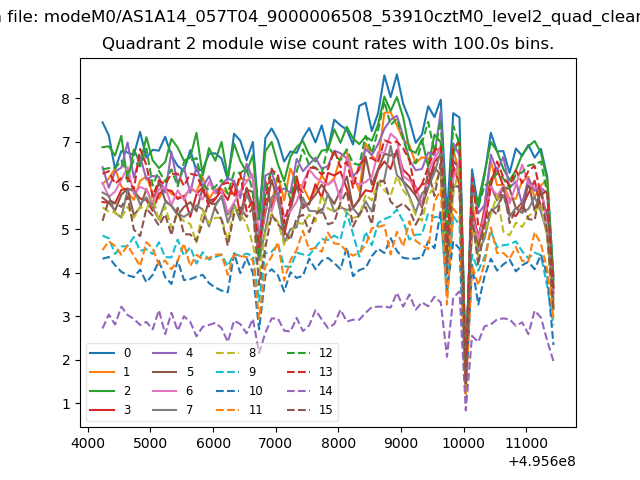
| Module-wise count rates for Quadrant B Data is divided into 100 sec bins |
 |
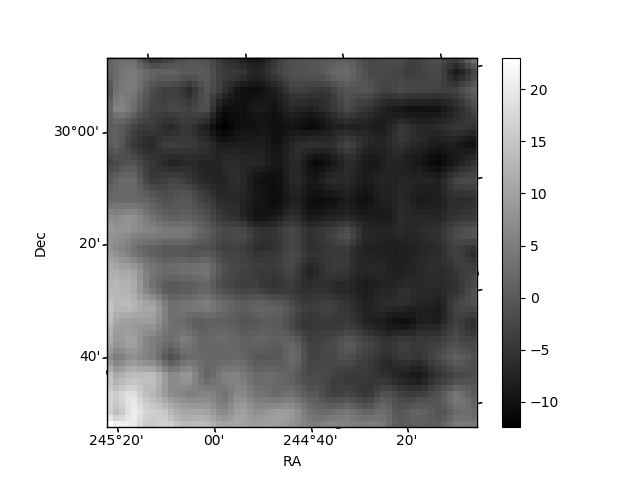 |
| Module-wise count rates for Quadrant C Data is divided into 100 sec bins |
 |
 |
| Module-wise count rates for Quadrant D Data is divided into 100 sec bins |
 |
 |
| Parameter | Plot |
|---|---|
| CZT HV Monitor | 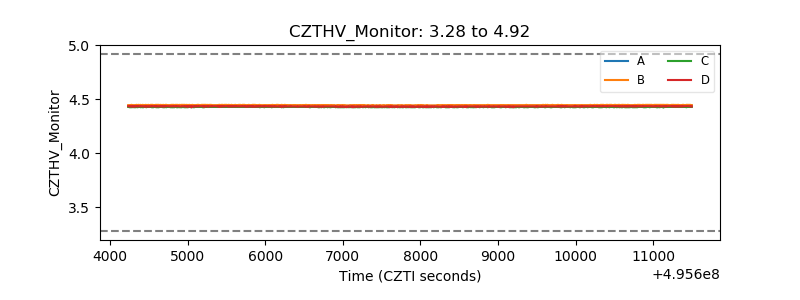 |
| D_VDD | 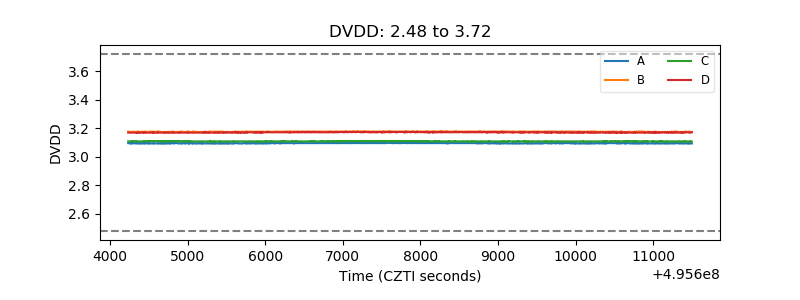 |
| Temperature 1 | 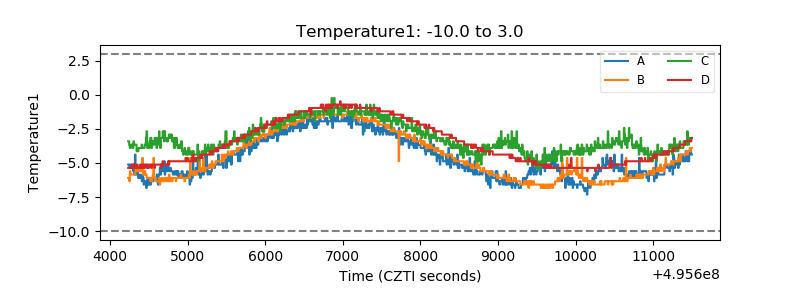 |
| Veto HV Monitor | 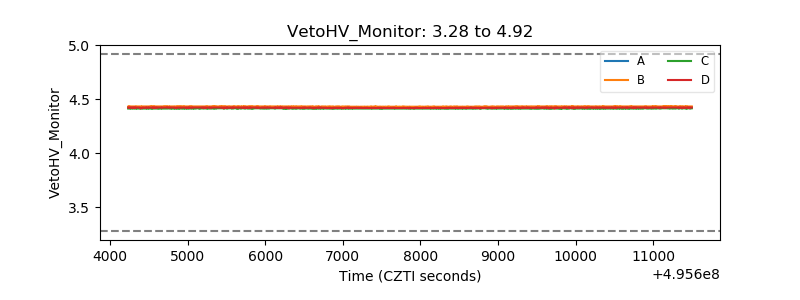 |
| Veto LLD | 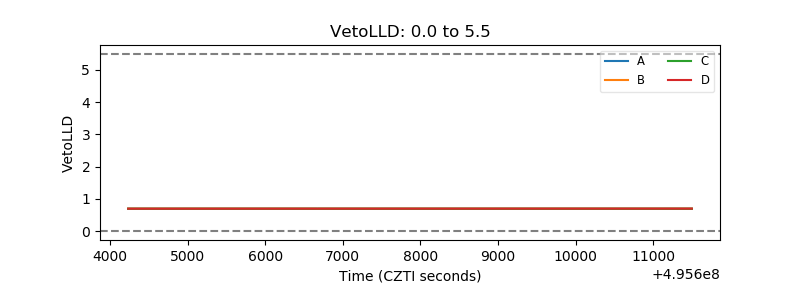 |
| Alpha Counter | 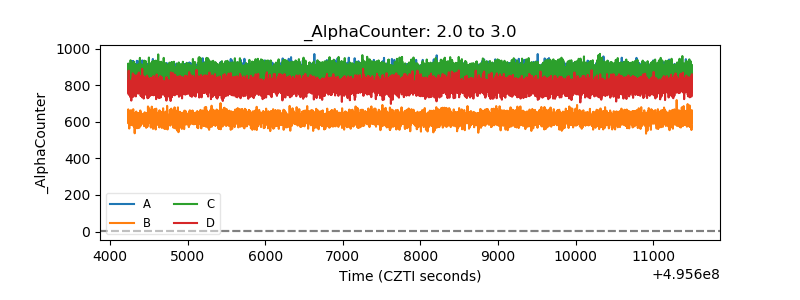 |
| _CPM_Rate | 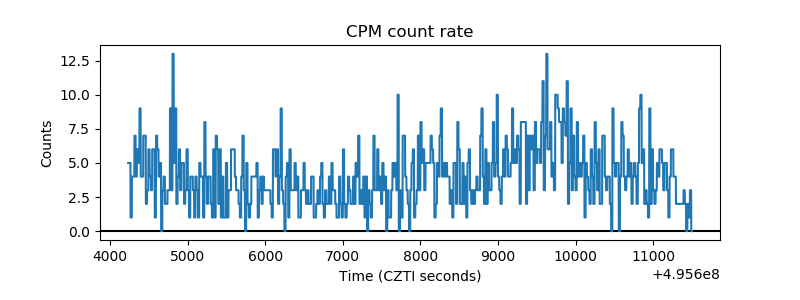 |
| CZT Counter | 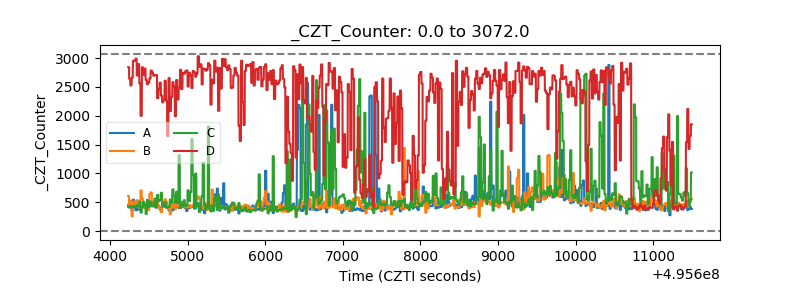 |
| +2.5 Volts monitor |  |
| +5 Volts monitor |  |
| _ROLL_ROT |  |
| _Roll_DEC | 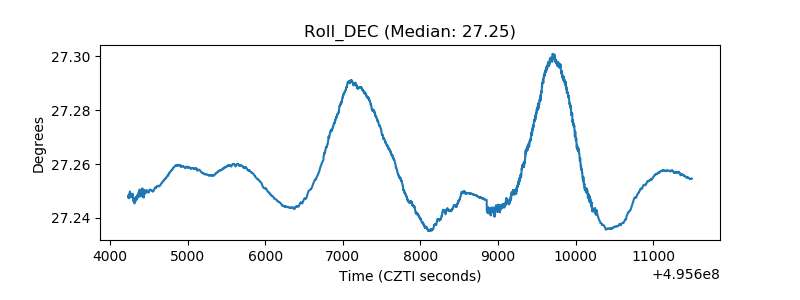 |
| _Roll_RA | 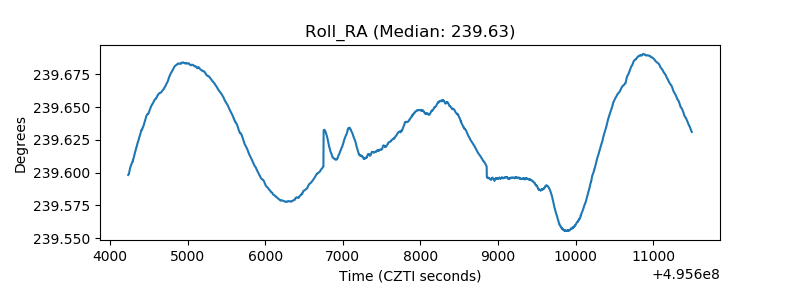 |
| Veto Counter | 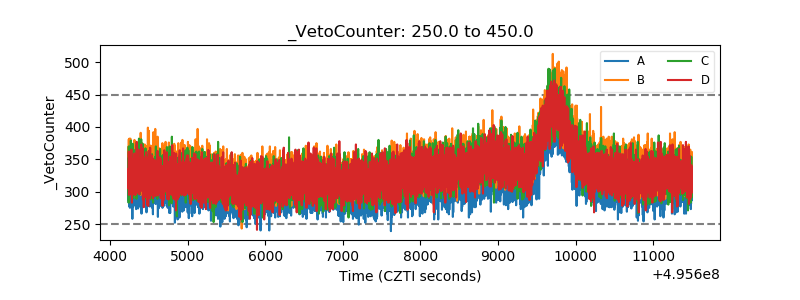 |