| Param | Original file | Final file |
|---|---|---|
| Filename | modeM0/AS1A14_057T04_9000006508_53911cztM0_level2.fits | modeM0/AS1A14_057T04_9000006508_53911cztM0_level2_quad_clean.evt |
| Size (bytes) | 797,788,800 | 109,635,840 |
| Size | 760.8 MB | 104.6 MB |
| Events in quadrant A | 4,744,057 | 782,511 |
| Events in quadrant B | 4,754,063 | 843,864 |
| Events in quadrant C | 6,789,753 | 710,714 |
| Events in quadrant D | 12,601,007 | 406,181 |
| Mode M0 | |||
|---|---|---|---|
| Quadrant | BADHDUFLAG | Total packets | Discarded packets |
| A | 0 | 19875 | 0 |
| B | 0 | 19547 | 0 |
| C | 0 | 25961 | 0 |
| D | 0 | 43207 | 0 |
| Mode SS | |||
|---|---|---|---|
| Quadrant | BADHDUFLAG | Total packets | Discarded packets |
| A | 0 | 166 | 0 |
| B | 0 | 166 | 0 |
| C | 0 | 166 | 0 |
| D | 0 | 166 | 0 |
| Quadrant | Total seconds | Saturated seconds | Saturation percentage |
|---|---|---|---|
| A | 8289 | 230 | 2.774762% |
| B | 8290 | 131 | 1.580217% |
| C | 8290 | 658 | 7.937274% |
| D | 8290 | 3700 | 44.632087% |
Noise dominated data is calculated using 1-second bins in cleaned event files. If a bin has >2000 counts, and if more than 50% of those come from <1% of pixels, then it is considered to be noise-dominated and hence unusable.
| Quadrant | # 1 sec bins | Bins with >0 counts | Bins with >2000 counts | High rate bins dominated by noise | Noise dominated (total time) | Noise dominated (detector-on time) | Marked lightcurve |
|---|---|---|---|---|---|---|---|
| A | 8289 | 8289 | 182 | 182 | 2.20% | 2.20% | 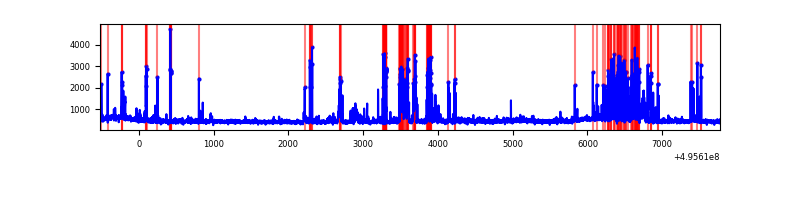 |
| B | 8290 | 8290 | 48 | 48 | 0.58% | 0.58% | 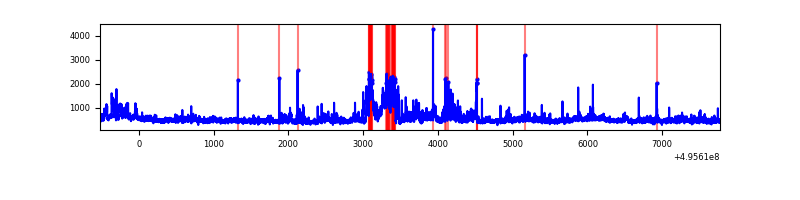 |
| C | 8290 | 8290 | 579 | 579 | 6.98% | 6.98% | 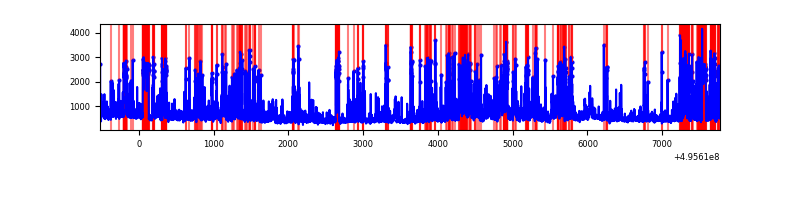 |
| D | 8290 | 8290 | 3307 | 3307 | 39.89% | 39.89% | 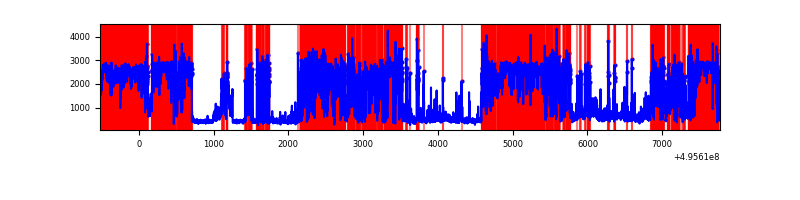 |
Top three noisy pixels from each quadrant. If the there are fewer than three noisy pixels in the level2.evt file, extra rows are filled as -1
| Pixel properties | Quadrant properties | ||||||
|---|---|---|---|---|---|---|---|
| Quadrant | DetID | PixID | Counts | Sigma | Mean | Median | Sigma |
| A | 15 | 174 | 481957 | 2153.39 | 915 | 894 | 223.4 |
| A | 10 | 253 | 409801 | 1830.4 | 915 | 894 | 223.4 |
| A | 4 | 249 | 71252 | 314.95 | 915 | 894 | 223.4 |
| B | 5 | 250 | 679212 | 3461.29 | 912 | 878 | 196.0 |
| B | 7 | 0 | 202886 | 1030.77 | 912 | 878 | 196.0 |
| B | 6 | 255 | 81719 | 412.5 | 912 | 878 | 196.0 |
| C | 15 | 224 | 1018004 | 4302.5 | 865 | 857 | 236.4 |
| C | 12 | 254 | 848523 | 3585.6 | 865 | 857 | 236.4 |
| C | 15 | 174 | 584726 | 2469.75 | 865 | 857 | 236.4 |
| D | 8 | 176 | 9110809 | 52478.4 | 613 | 586 | 173.6 |
| D | 2 | 16 | 370042 | 2128.21 | 613 | 586 | 173.6 |
| D | 2 | 165 | 337307 | 1939.64 | 613 | 586 | 173.6 |
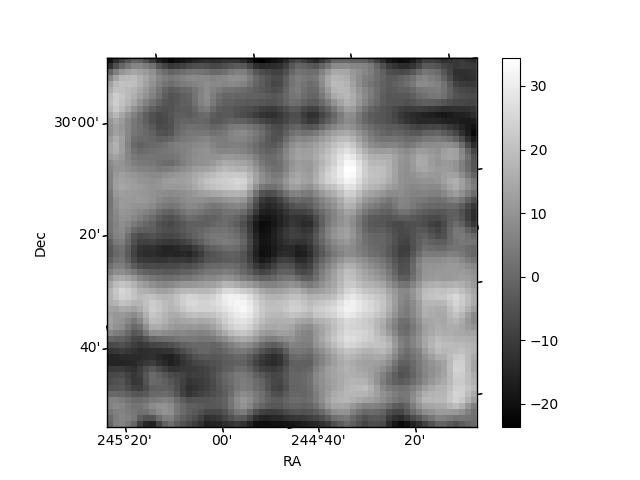
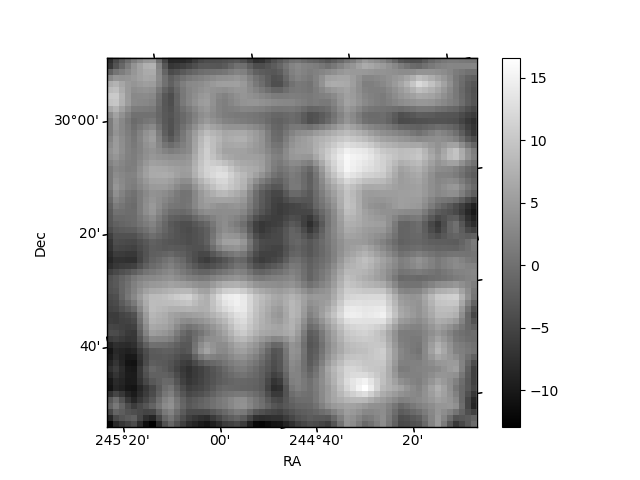
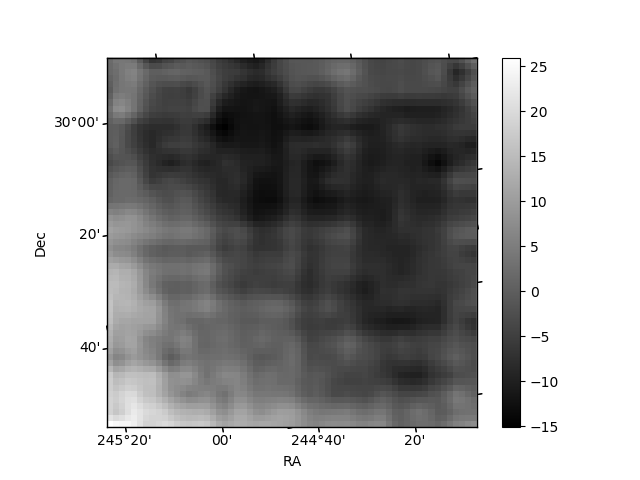
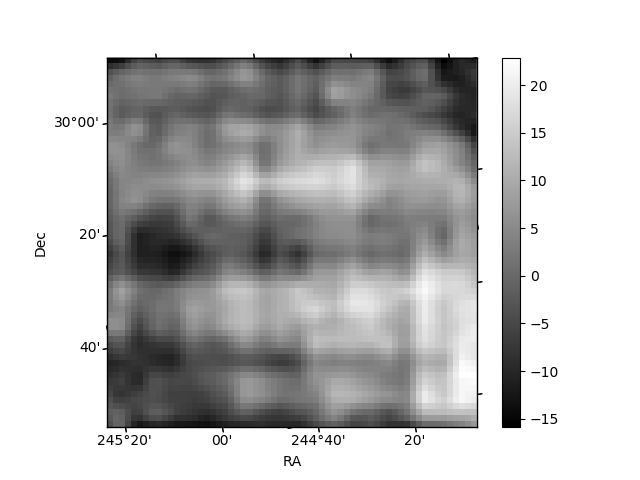
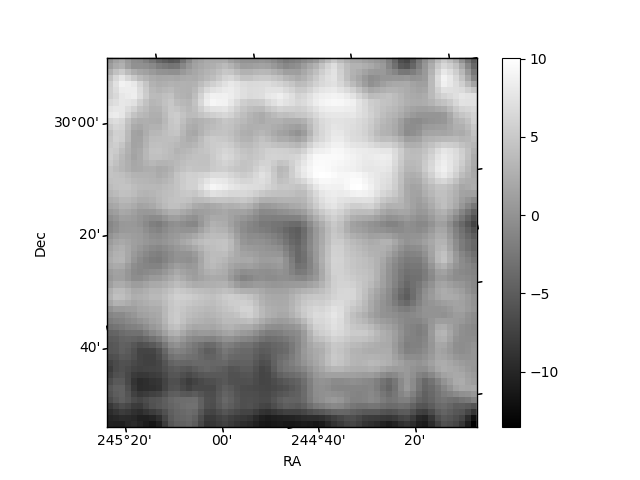
Histogram calculated using DETX and DETY for each event in the final _common_clean file
| Quadrant A | 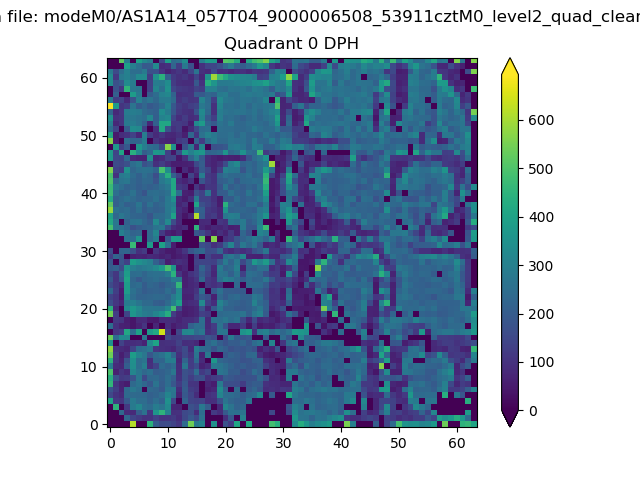 |
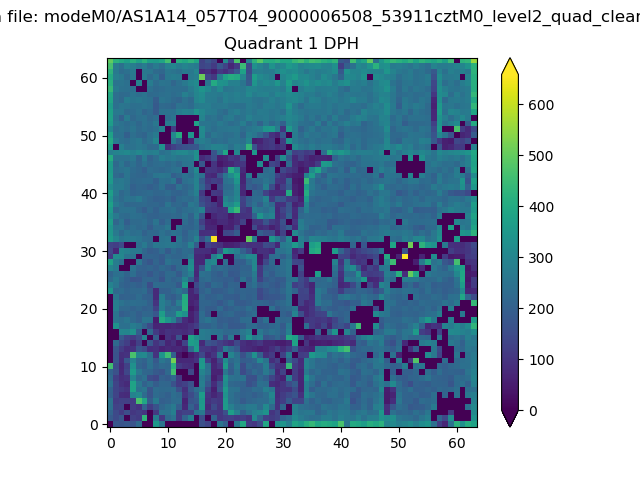 |
Quadrant B |
|---|---|---|---|
| Quadrant D | 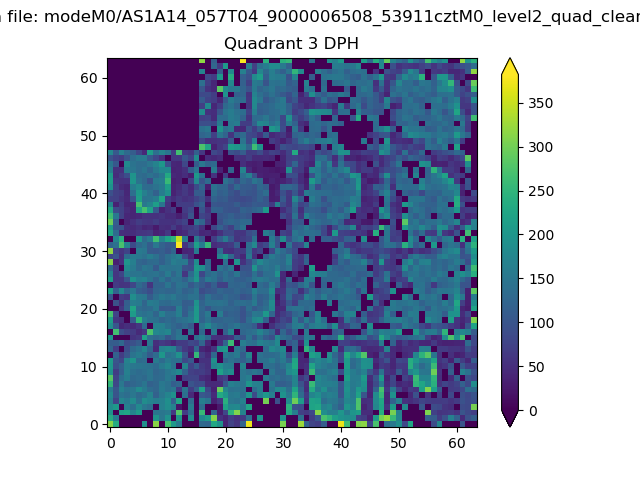 |
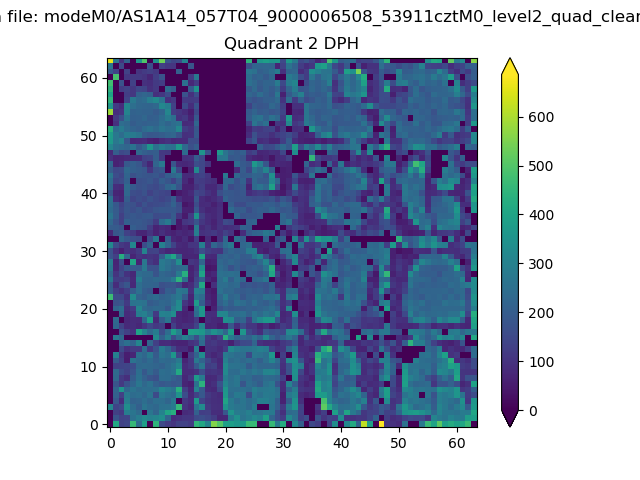 |
Quadrant C |
| Plot type | Count rate plots | Images |
|---|---|---|
| Comparison with Poisson distribution Blue bars denote a histogram of data divided into 1 sec bins. Red curve is a Poisson curve with rate = median count rate of data. |
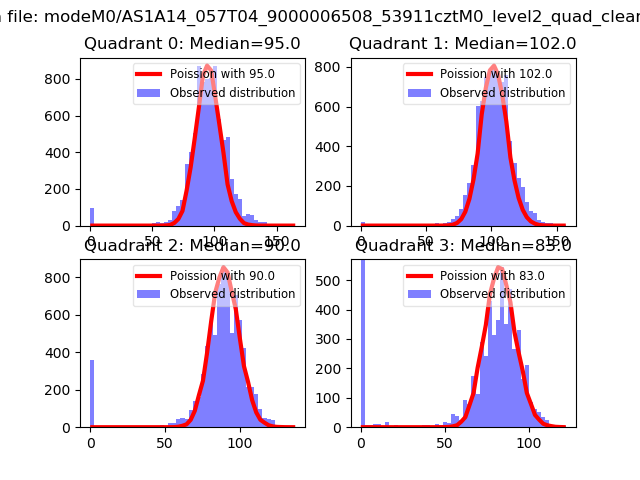 |
 |
| Quadrant-wise count rates Data is divided into 100 sec bins |
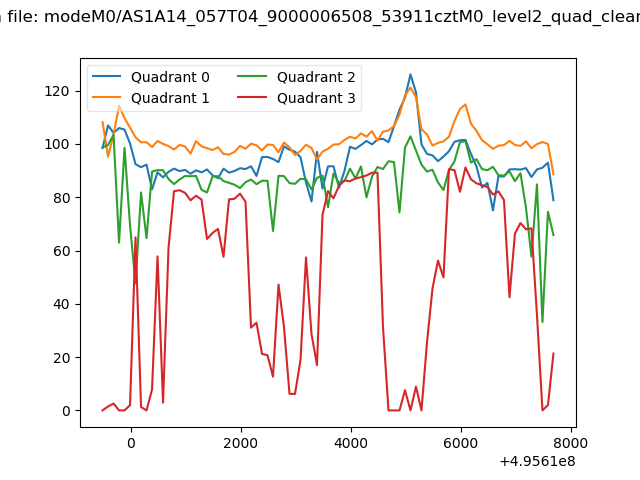 |
|
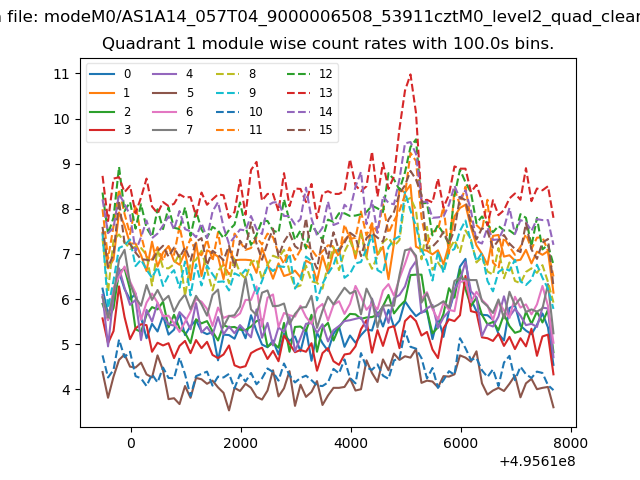
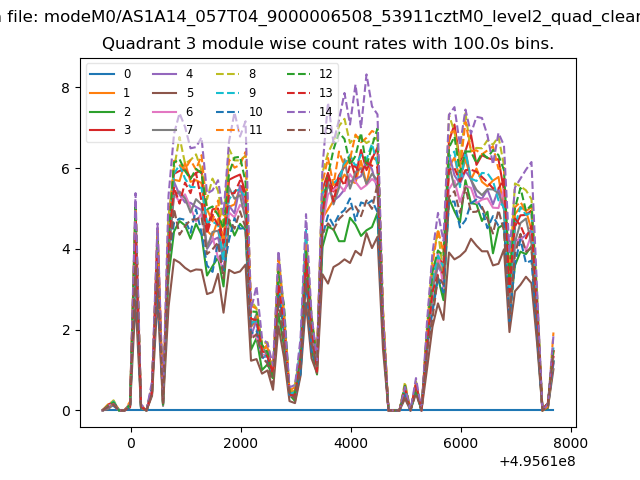
| Module-wise count rates for Quadrant A Data is divided into 100 sec bins |
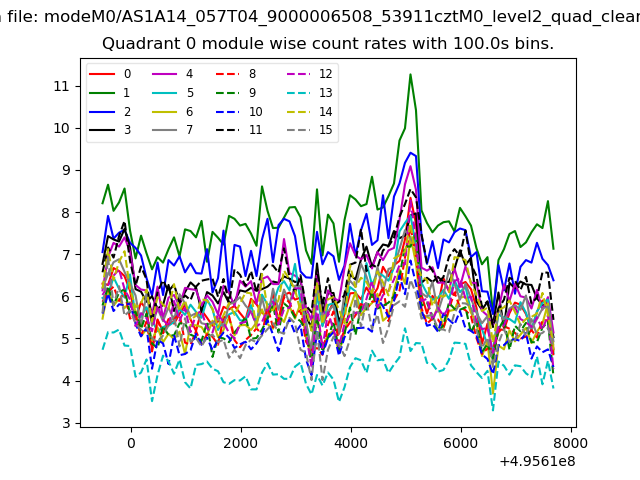 |
 |
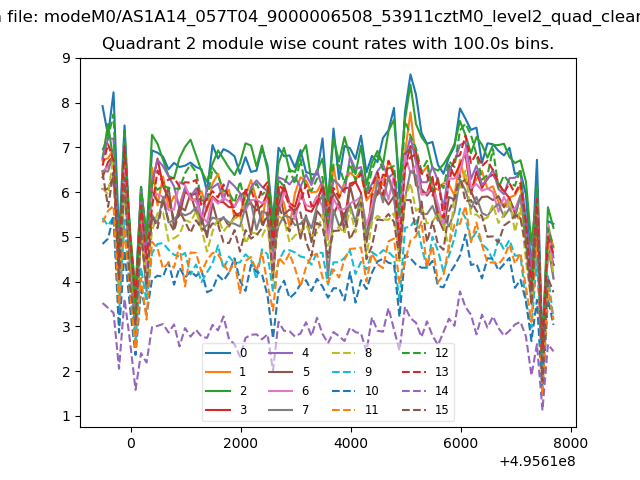
| Module-wise count rates for Quadrant B Data is divided into 100 sec bins |
 |
 |
| Module-wise count rates for Quadrant C Data is divided into 100 sec bins |
 |
 |
| Module-wise count rates for Quadrant D Data is divided into 100 sec bins |
 |
 |
| Parameter | Plot |
|---|---|
| CZT HV Monitor | 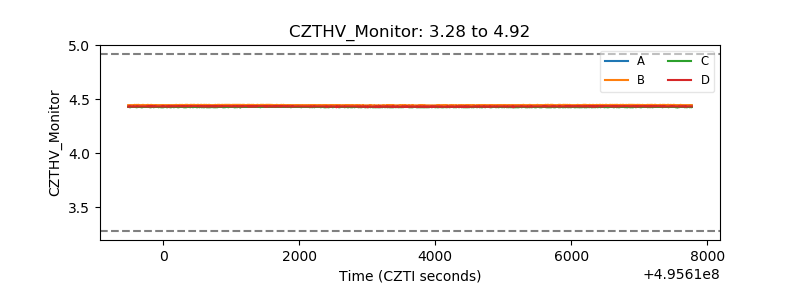 |
| D_VDD | 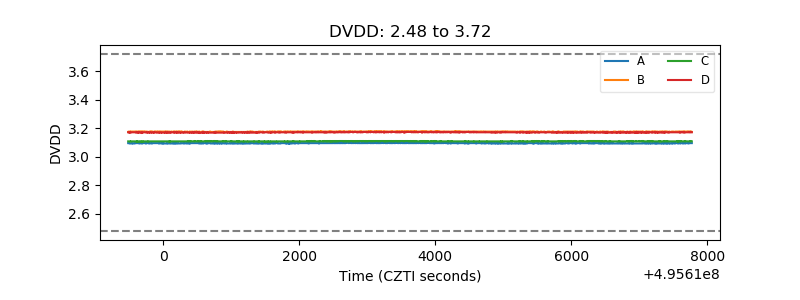 |
| Temperature 1 | 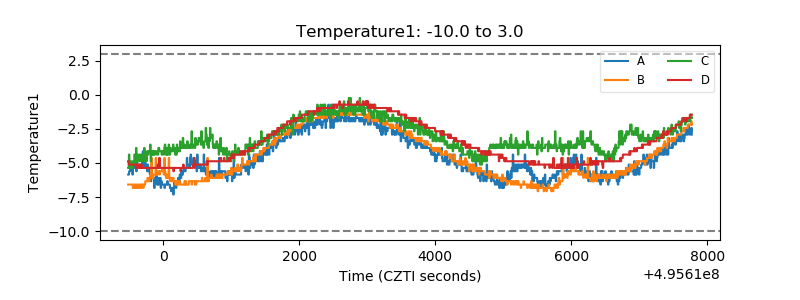 |
| Veto HV Monitor | 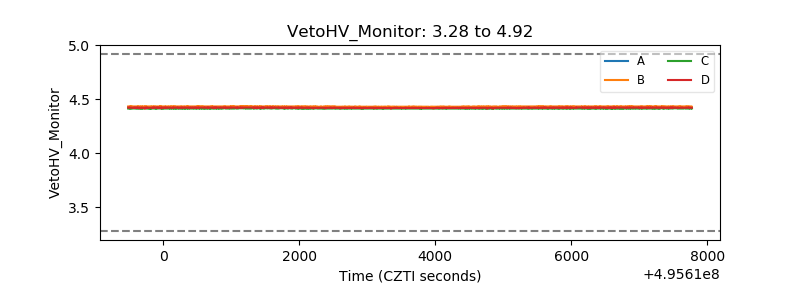 |
| Veto LLD | 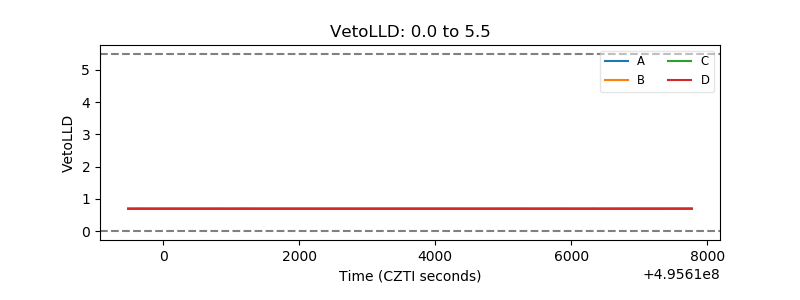 |
| Alpha Counter | 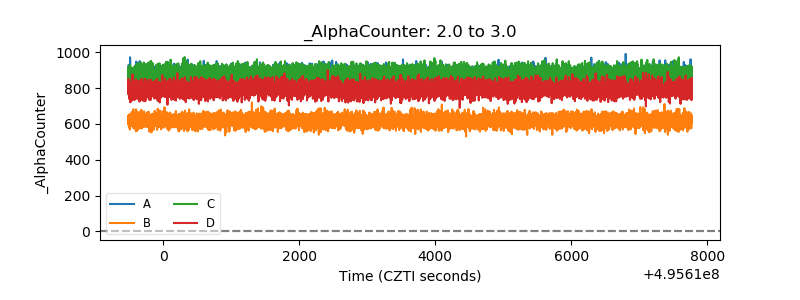 |
| _CPM_Rate | 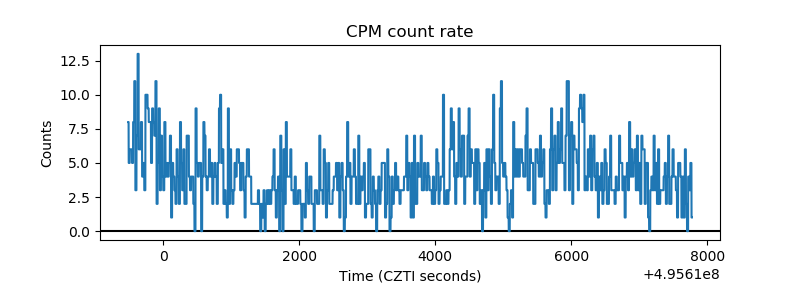 |
| CZT Counter | 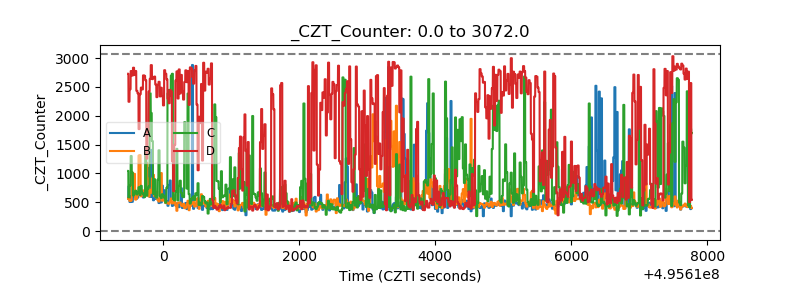 |
| +2.5 Volts monitor | 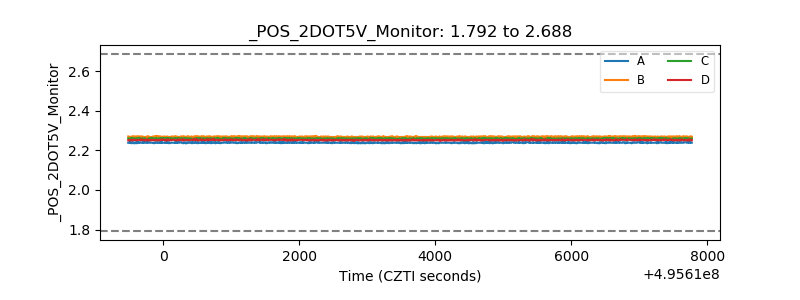 |
| +5 Volts monitor |  |
| _ROLL_ROT | 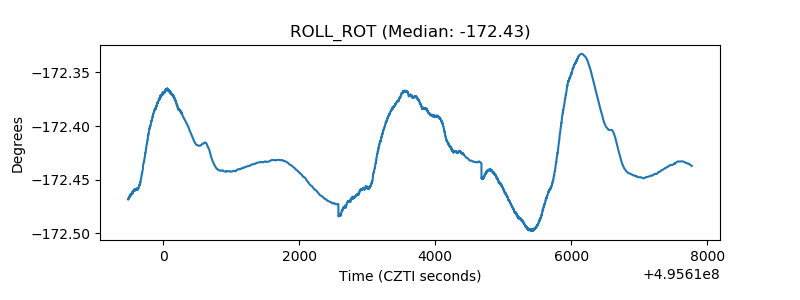 |
| _Roll_DEC | 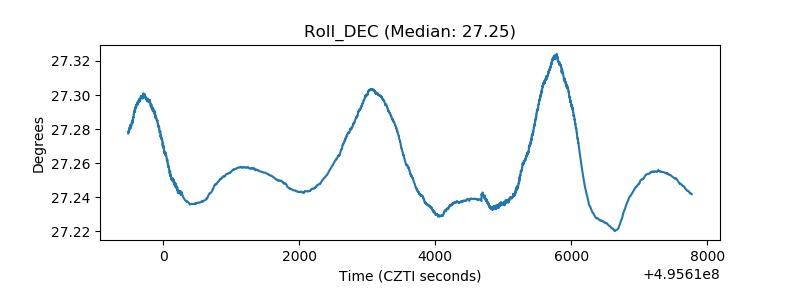 |
| _Roll_RA | 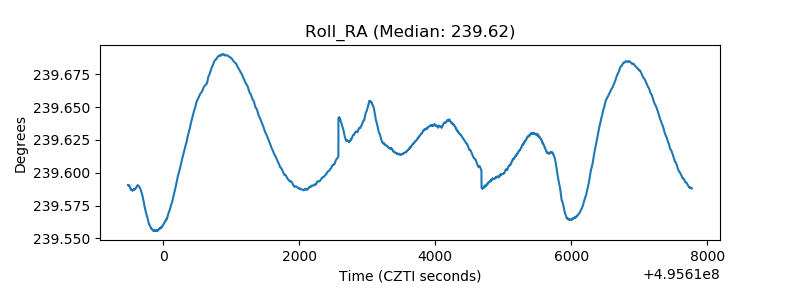 |
| Veto Counter | 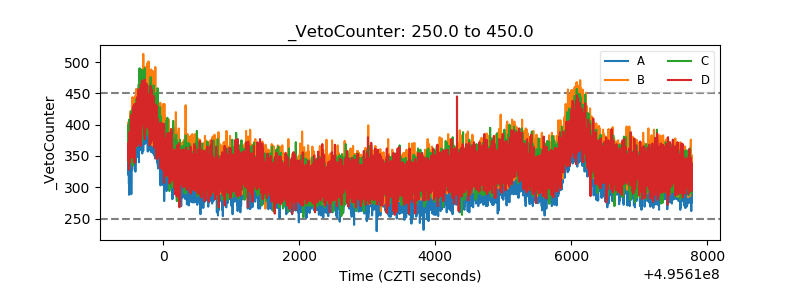 |