| Param | Original file | Final file |
|---|---|---|
| Filename | modeM0/AS1A14_057T04_9000006508_53912cztM0_level2.fits | modeM0/AS1A14_057T04_9000006508_53912cztM0_level2_quad_clean.evt |
| Size (bytes) | 908,746,560 | 96,050,880 |
| Size | 866.6 MB | 91.6 MB |
| Events in quadrant A | 4,304,268 | 748,715 |
| Events in quadrant B | 5,378,860 | 779,978 |
| Events in quadrant C | 7,981,681 | 605,840 |
| Events in quadrant D | 15,362,772 | 225,718 |
| Mode M0 | |||
|---|---|---|---|
| Quadrant | BADHDUFLAG | Total packets | Discarded packets |
| A | 0 | 18140 | 0 |
| B | 0 | 21483 | 0 |
| C | 0 | 29102 | 0 |
| D | 0 | 51072 | 0 |
| Mode SS | |||
|---|---|---|---|
| Quadrant | BADHDUFLAG | Total packets | Discarded packets |
| A | 0 | 156 | 0 |
| B | 0 | 156 | 0 |
| C | 0 | 156 | 0 |
| D | 0 | 156 | 0 |
| Quadrant | Total seconds | Saturated seconds | Saturation percentage |
|---|---|---|---|
| A | 7882 | 139 | 1.763512% |
| B | 7883 | 411 | 5.213751% |
| C | 7883 | 1398 | 17.734365% |
| D | 7883 | 5514 | 69.947989% |
Noise dominated data is calculated using 1-second bins in cleaned event files. If a bin has >2000 counts, and if more than 50% of those come from <1% of pixels, then it is considered to be noise-dominated and hence unusable.
| Quadrant | # 1 sec bins | Bins with >0 counts | Bins with >2000 counts | High rate bins dominated by noise | Noise dominated (total time) | Noise dominated (detector-on time) | Marked lightcurve |
|---|---|---|---|---|---|---|---|
| A | 7882 | 7882 | 86 | 86 | 1.09% | 1.09% | 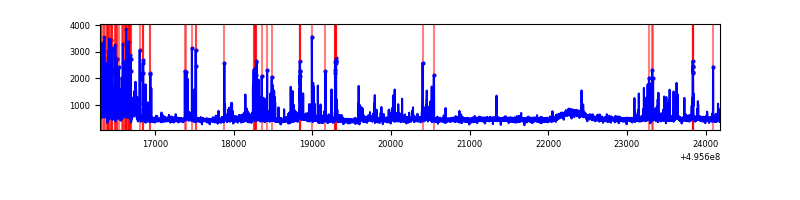 |
| B | 7882 | 7882 | 239 | 239 | 3.03% | 3.03% | 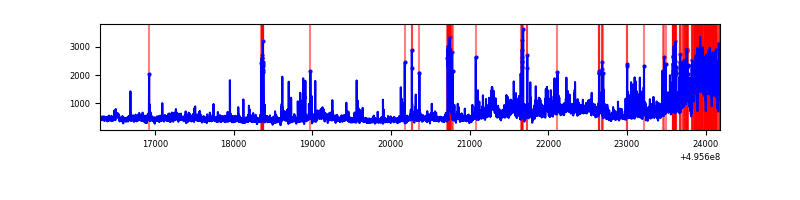 |
| C | 7883 | 7883 | 1042 | 1042 | 13.22% | 13.22% | 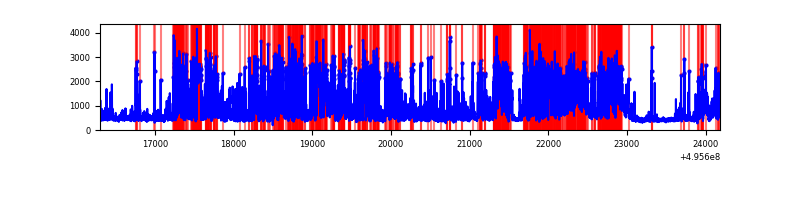 |
| D | 7882 | 7882 | 4341 | 4341 | 55.07% | 55.07% | 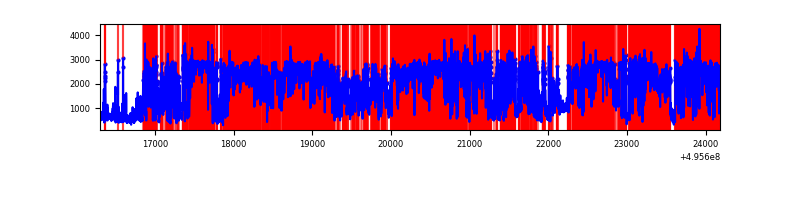 |
Top three noisy pixels from each quadrant. If the there are fewer than three noisy pixels in the level2.evt file, extra rows are filled as -1
| Pixel properties | Quadrant properties | ||||||
|---|---|---|---|---|---|---|---|
| Quadrant | DetID | PixID | Counts | Sigma | Mean | Median | Sigma |
| A | 10 | 253 | 592353 | 2731.82 | 871 | 848 | 216.5 |
| A | 15 | 174 | 90087 | 412.14 | 871 | 848 | 216.5 |
| A | 3 | 114 | 46304 | 209.93 | 871 | 848 | 216.5 |
| B | 5 | 236 | 770890 | 4197.32 | 852 | 824 | 183.5 |
| B | 5 | 250 | 656588 | 3574.31 | 852 | 824 | 183.5 |
| B | 0 | 213 | 146708 | 795.16 | 852 | 824 | 183.5 |
| C | 12 | 254 | 3436119 | 16142.9 | 774 | 768 | 212.8 |
| C | 15 | 174 | 378042 | 1772.83 | 774 | 768 | 212.8 |
| C | 15 | 158 | 365277 | 1712.85 | 774 | 768 | 212.8 |
| D | 8 | 176 | 13393805 | 111634.19 | 423 | 404 | 120.0 |
| D | 2 | 165 | 50296 | 415.85 | 423 | 404 | 120.0 |
| D | 10 | 172 | 49243 | 407.07 | 423 | 404 | 120.0 |
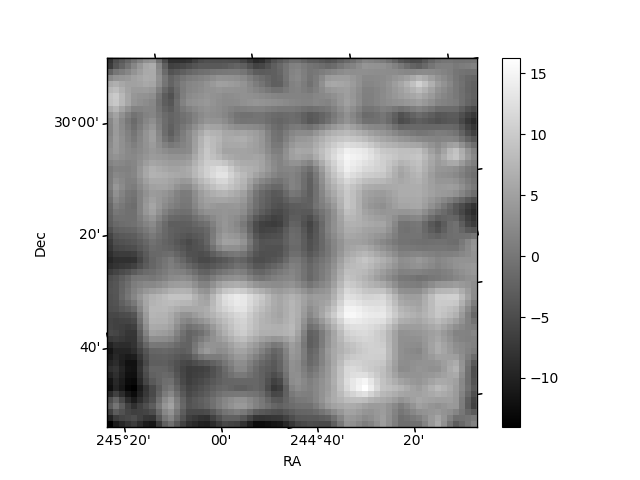
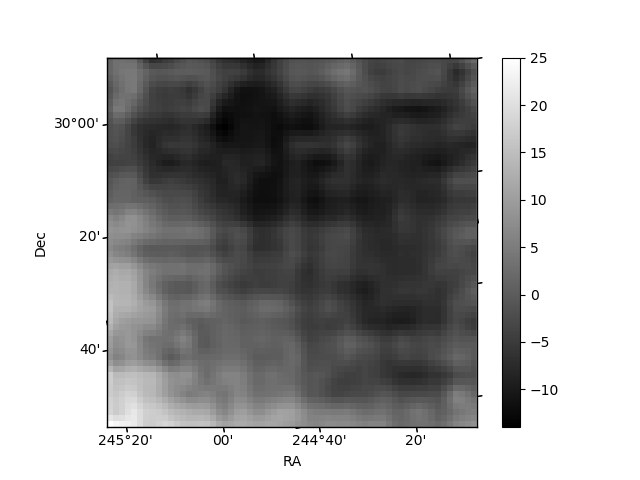
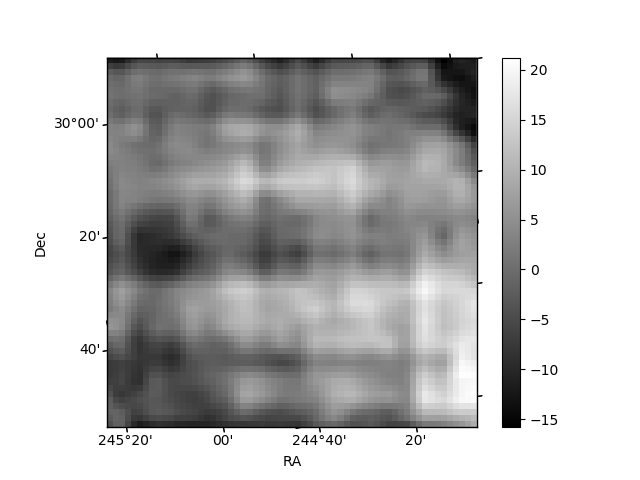
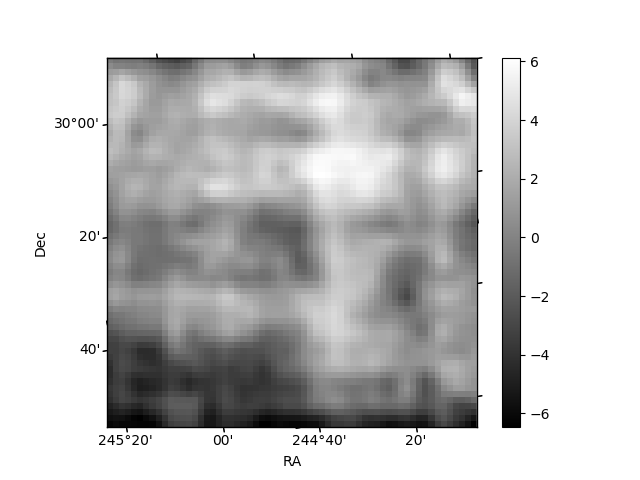
Histogram calculated using DETX and DETY for each event in the final _common_clean file
| Quadrant A | 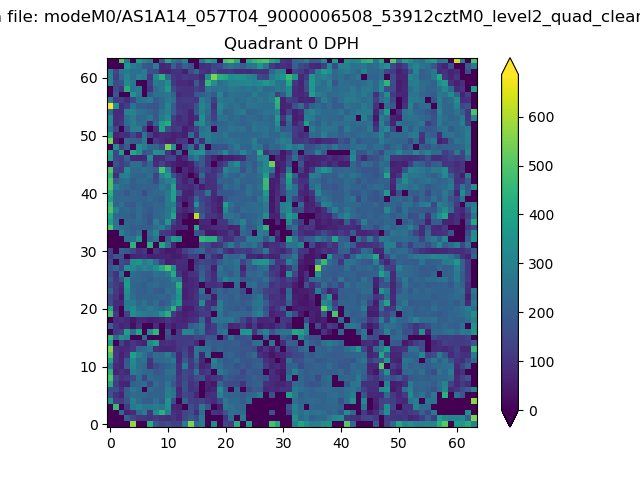 |
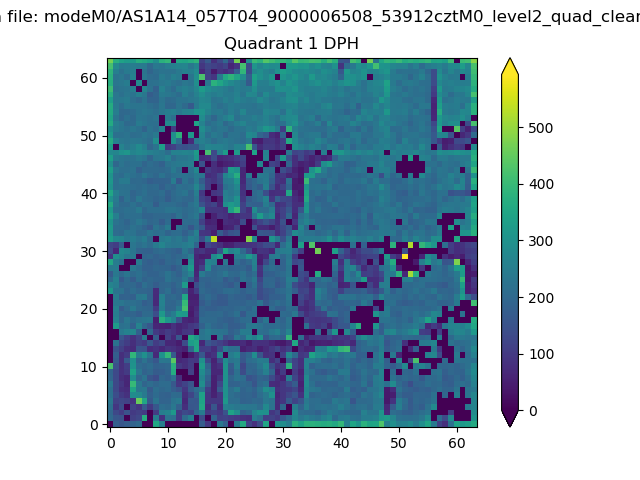 |
Quadrant B |
|---|---|---|---|
| Quadrant D | 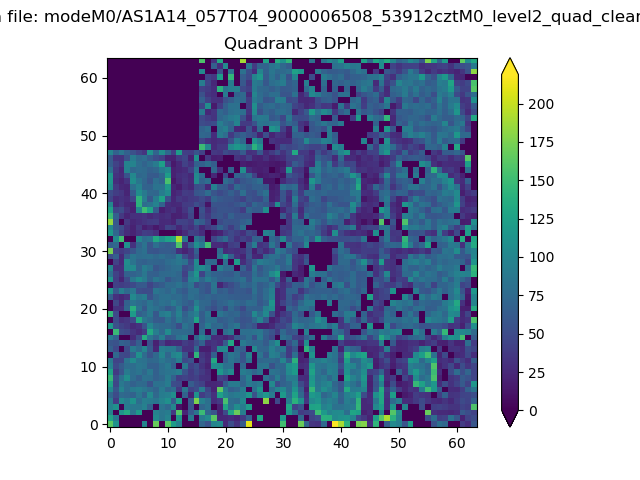 |
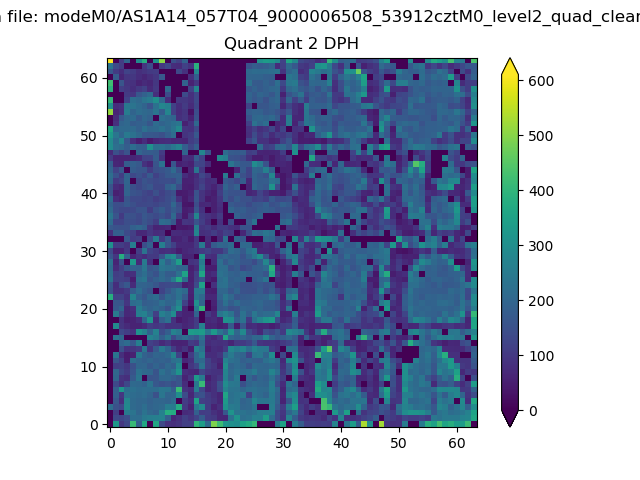 |
Quadrant C |
| Plot type | Count rate plots | Images |
|---|---|---|
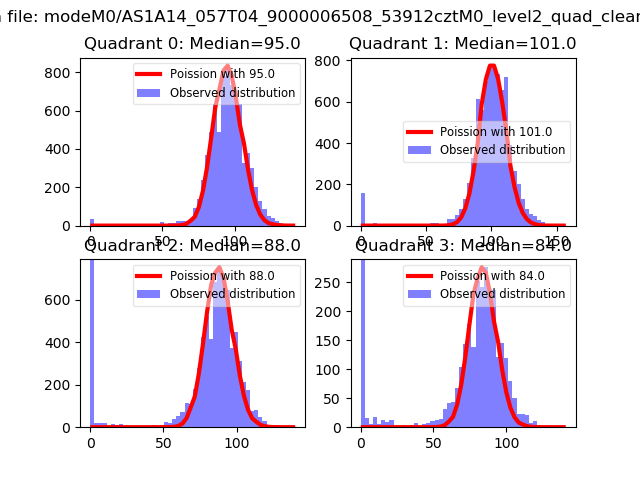
| Comparison with Poisson distribution Blue bars denote a histogram of data divided into 1 sec bins. Red curve is a Poisson curve with rate = median count rate of data. |
 |
 |
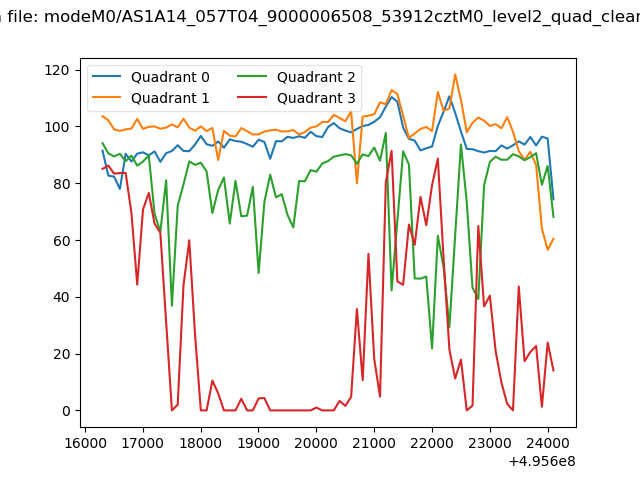
| Quadrant-wise count rates Data is divided into 100 sec bins |
 |
|
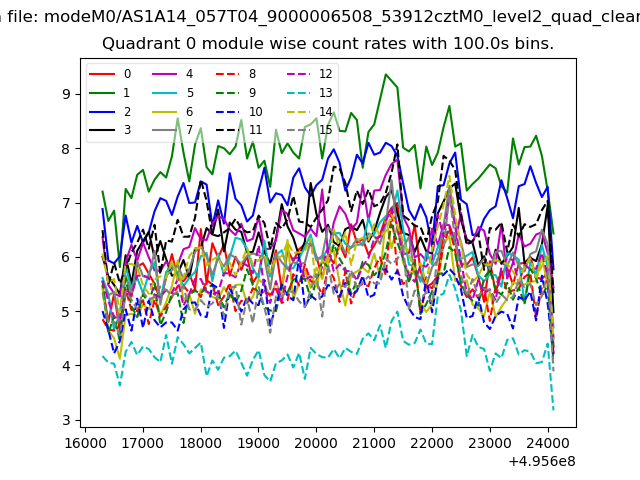
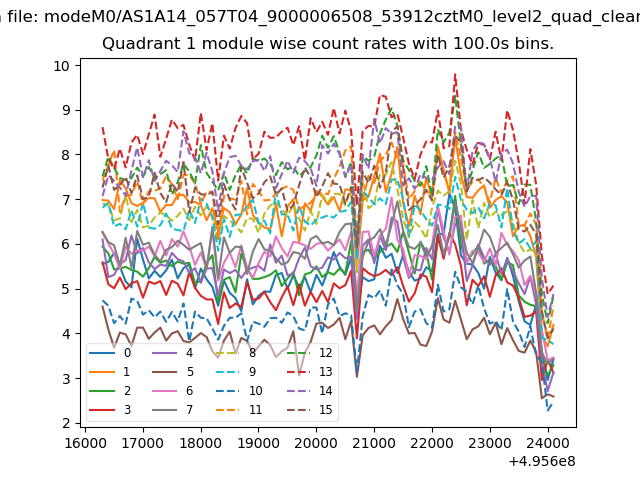
| Module-wise count rates for Quadrant A Data is divided into 100 sec bins |
 |
 |
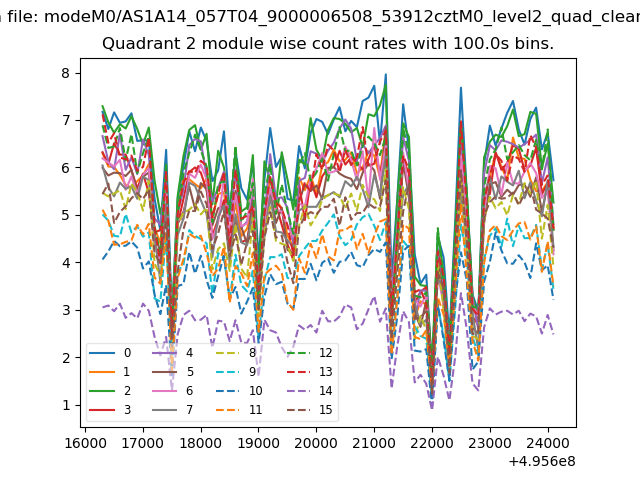
| Module-wise count rates for Quadrant B Data is divided into 100 sec bins |
 |
 |
| Module-wise count rates for Quadrant C Data is divided into 100 sec bins |
 |
 |
| Module-wise count rates for Quadrant D Data is divided into 100 sec bins |
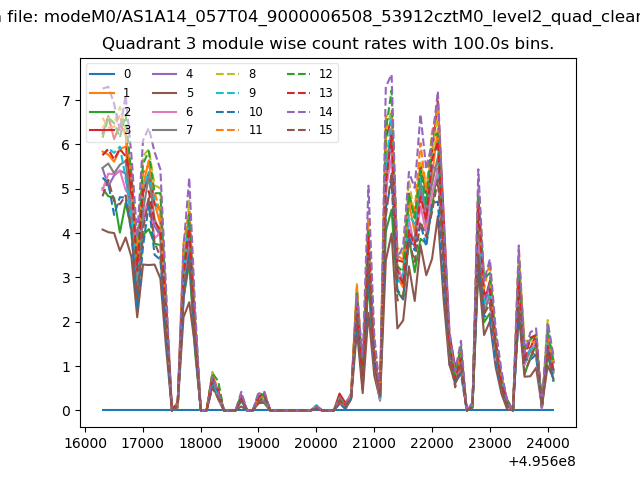 |
 |
| Parameter | Plot |
|---|---|
| CZT HV Monitor | 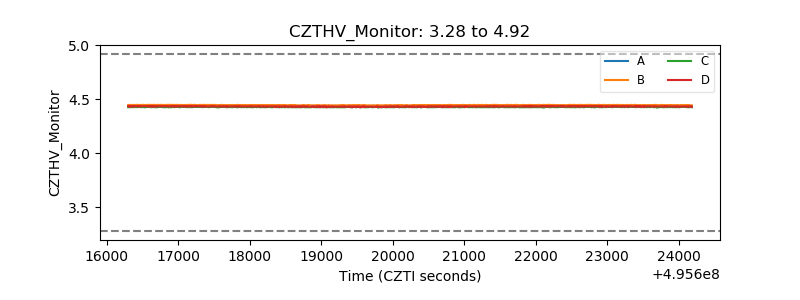 |
| D_VDD | 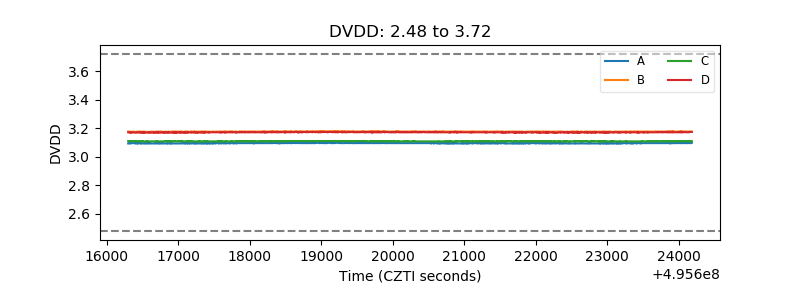 |
| Temperature 1 | 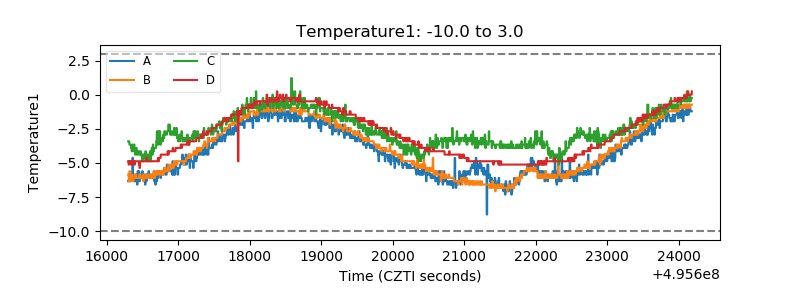 |
| Veto HV Monitor | 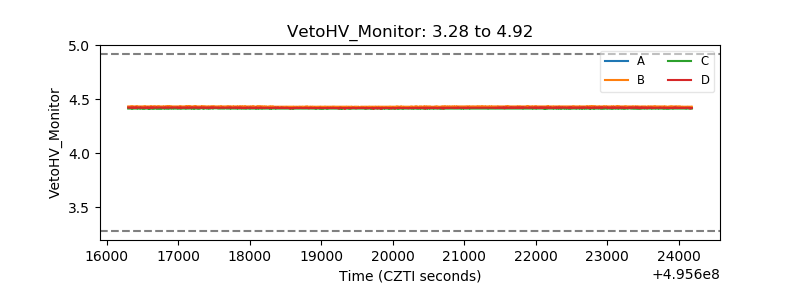 |
| Veto LLD | 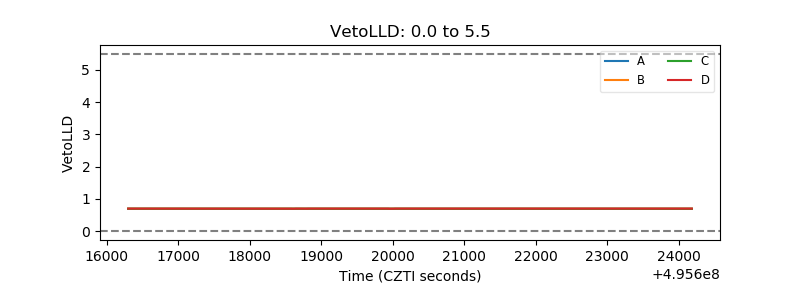 |
| Alpha Counter | 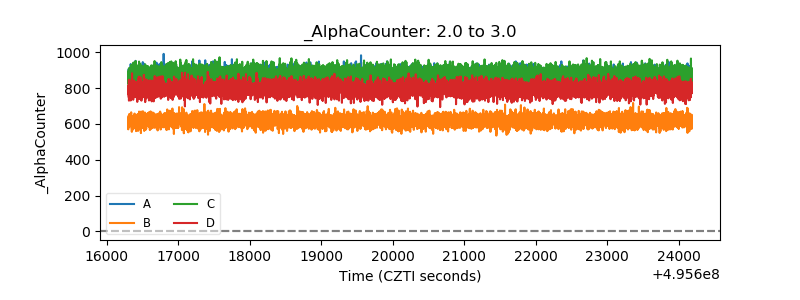 |
| _CPM_Rate | 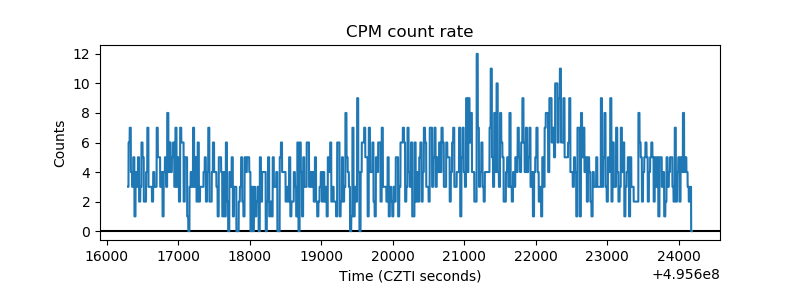 |
| CZT Counter | 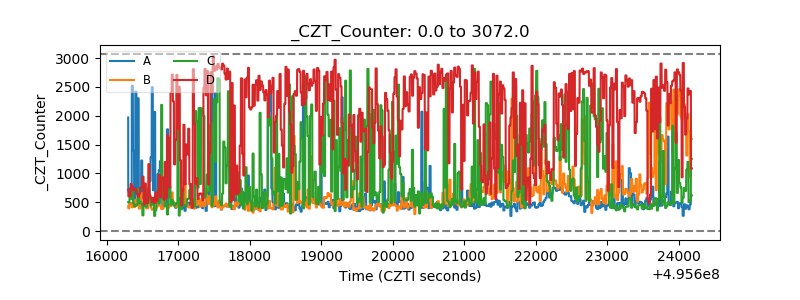 |
| +2.5 Volts monitor |  |
| +5 Volts monitor |  |
| _ROLL_ROT | 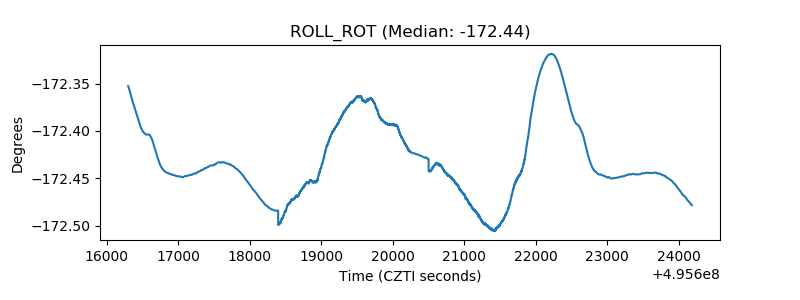 |
| _Roll_DEC | 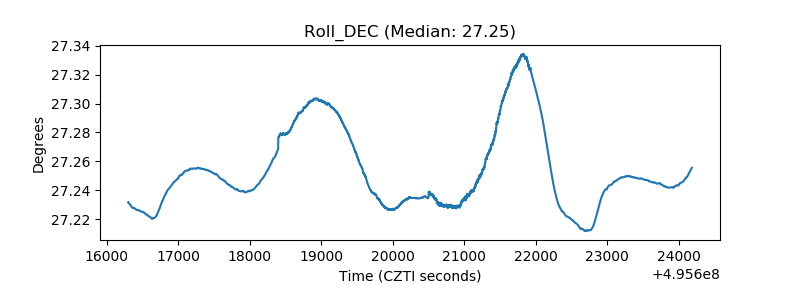 |
| _Roll_RA | 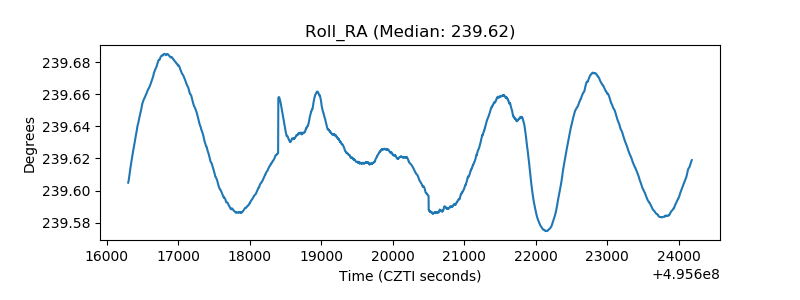 |
| Veto Counter | 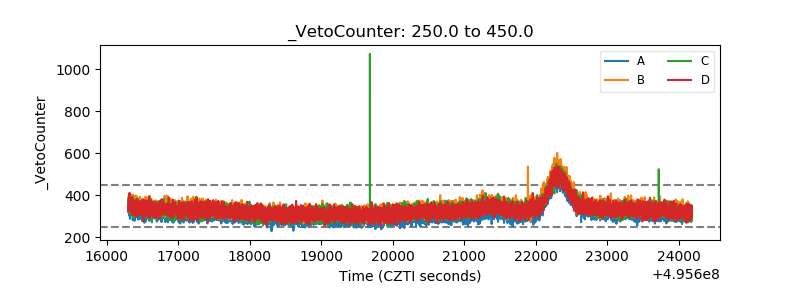 |