| Param | Original file | Final file |
|---|---|---|
| Filename | modeM0/AS1A14_057T04_9000006508_53915cztM0_level2.fits | modeM0/AS1A14_057T04_9000006508_53915cztM0_level2_quad_clean.evt |
| Size (bytes) | 2,216,350,080 | 221,866,560 |
| Size | 2.1 GB | 211.6 MB |
| Events in quadrant A | 10,953,799 | 1,741,529 |
| Events in quadrant B | 13,322,398 | 1,822,624 |
| Events in quadrant C | 16,726,981 | 1,446,024 |
| Events in quadrant D | 39,589,972 | 414,533 |
| Mode M0 | |||
|---|---|---|---|
| Quadrant | BADHDUFLAG | Total packets | Discarded packets |
| A | 0 | 45557 | 3 |
| B | 0 | 52775 | 3 |
| C | 0 | 63055 | 3 |
| D | 0 | 130488 | 3 |
| Mode SS | |||
|---|---|---|---|
| Quadrant | BADHDUFLAG | Total packets | Discarded packets |
| A | 0 | 380 | 0 |
| B | 0 | 380 | 0 |
| C | 0 | 380 | 0 |
| D | 0 | 380 | 0 |
| Mode M9 | |||
|---|---|---|---|
| Quadrant | BADHDUFLAG | Total packets | Discarded packets |
| A | 0 | 15 | 0 |
| B | 0 | 15 | 0 |
| C | 0 | 15 | 0 |
| D | 0 | 15 | 0 |
| Quadrant | Total seconds | Saturated seconds | Saturation percentage |
|---|---|---|---|
| A | 18754 | 677 | 3.609897% |
| B | 18755 | 966 | 5.150626% |
| C | 18754 | 2700 | 14.396929% |
| D | 18754 | 14501 | 77.322171% |
Noise dominated data is calculated using 1-second bins in cleaned event files. If a bin has >2000 counts, and if more than 50% of those come from <1% of pixels, then it is considered to be noise-dominated and hence unusable.
| Quadrant | # 1 sec bins | Bins with >0 counts | Bins with >2000 counts | High rate bins dominated by noise | Noise dominated (total time) | Noise dominated (detector-on time) | Marked lightcurve |
|---|---|---|---|---|---|---|---|
| A | 20059 | 18755 | 364 | 364 | 1.81% | 1.94% | 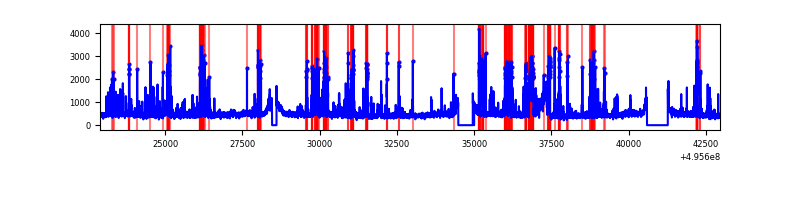 |
| B | 20060 | 18756 | 497 | 497 | 2.48% | 2.65% | 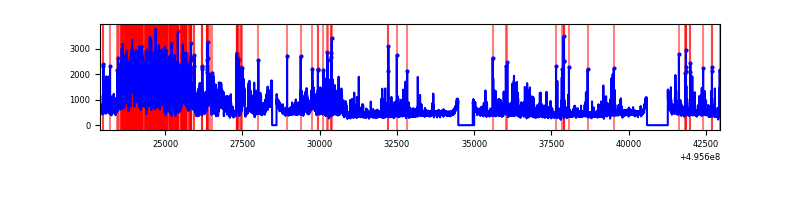 |
| C | 20058 | 18756 | 2016 | 2016 | 10.05% | 10.75% | 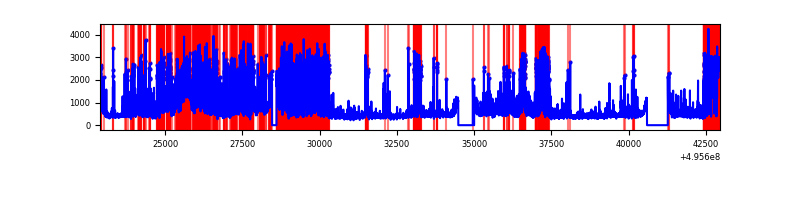 |
| D | 20058 | 18753 | 12422 | 12422 | 61.93% | 66.24% | 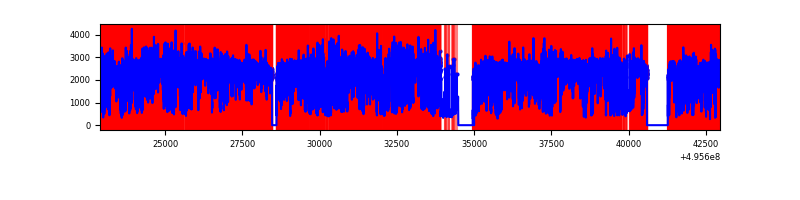 |
Top three noisy pixels from each quadrant. If the there are fewer than three noisy pixels in the level2.evt file, extra rows are filled as -1
| Pixel properties | Quadrant properties | ||||||
|---|---|---|---|---|---|---|---|
| Quadrant | DetID | PixID | Counts | Sigma | Mean | Median | Sigma |
| A | 4 | 249 | 1205835 | 2362.15 | 2067 | 2008 | 509.6 |
| A | 10 | 253 | 641976 | 1255.74 | 2067 | 2008 | 509.6 |
| A | 15 | 174 | 601520 | 1176.36 | 2067 | 2008 | 509.6 |
| B | 5 | 250 | 2580827 | 6007.67 | 2018 | 1946 | 429.3 |
| B | 5 | 236 | 1504913 | 3501.26 | 2018 | 1946 | 429.3 |
| B | 5 | 185 | 350500 | 811.98 | 2018 | 1946 | 429.3 |
| C | 12 | 254 | 3191038 | 6134.64 | 1883 | 1862 | 519.9 |
| C | 1 | 241 | 2134034 | 4101.41 | 1883 | 1862 | 519.9 |
| C | 15 | 158 | 1389277 | 2668.81 | 1883 | 1862 | 519.9 |
| D | 8 | 176 | 33066572 | 121751.47 | 929 | 884 | 271.6 |
| D | 10 | 172 | 708191 | 2604.38 | 929 | 884 | 271.6 |
| D | 3 | 12 | 676186 | 2486.54 | 929 | 884 | 271.6 |
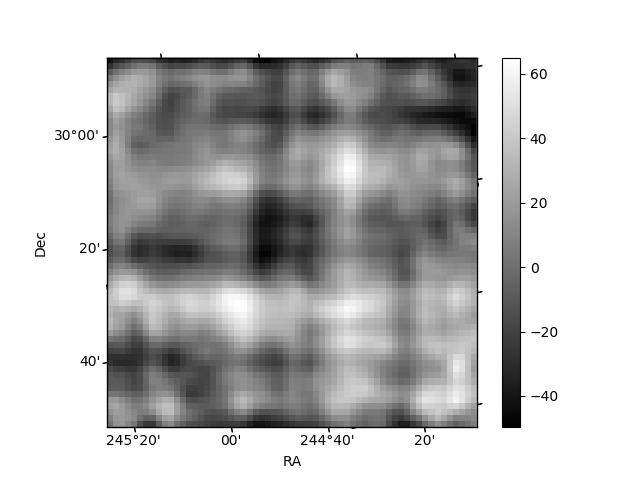
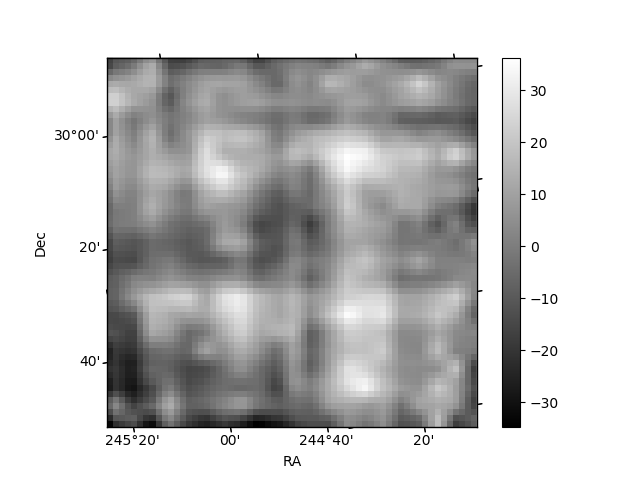
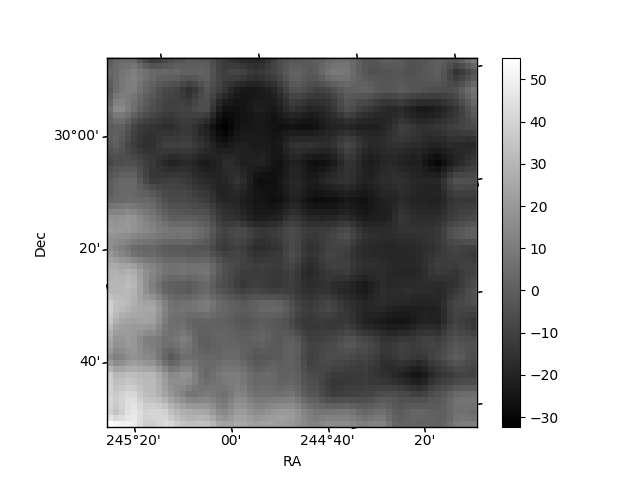
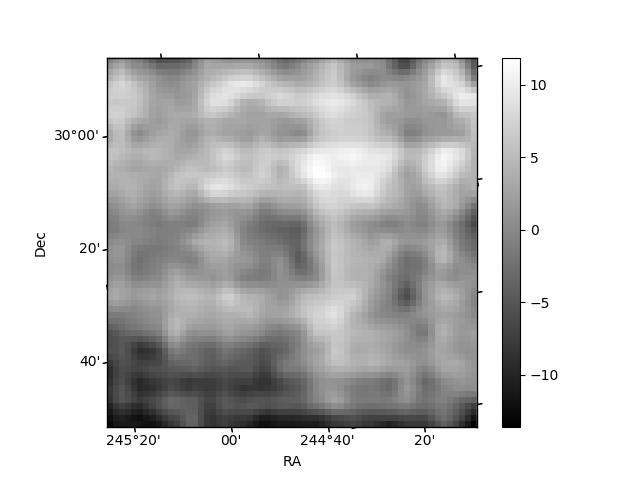
Histogram calculated using DETX and DETY for each event in the final _common_clean file
| Quadrant A | 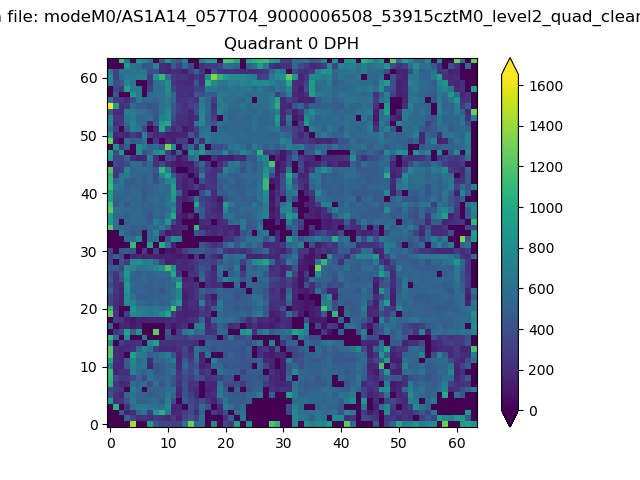 |
 |
Quadrant B |
|---|---|---|---|
| Quadrant D | 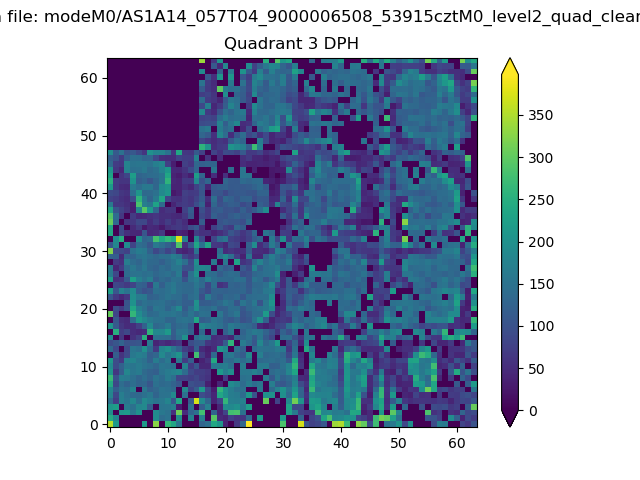 |
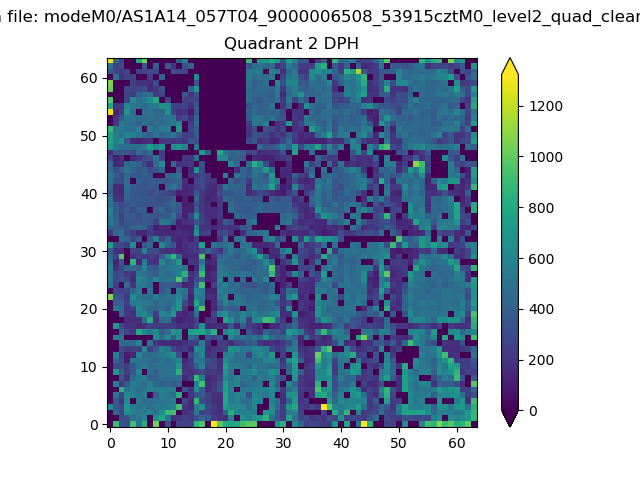 |
Quadrant C |
| Plot type | Count rate plots | Images |
|---|---|---|
| Comparison with Poisson distribution Blue bars denote a histogram of data divided into 1 sec bins. Red curve is a Poisson curve with rate = median count rate of data. |
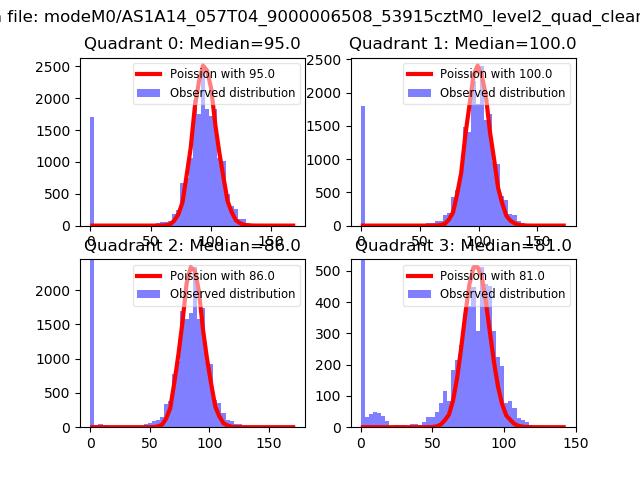 |
 |
| Quadrant-wise count rates Data is divided into 100 sec bins |
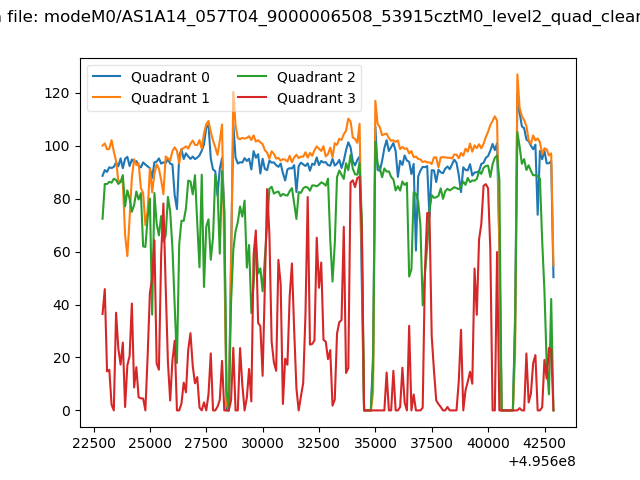 |
|
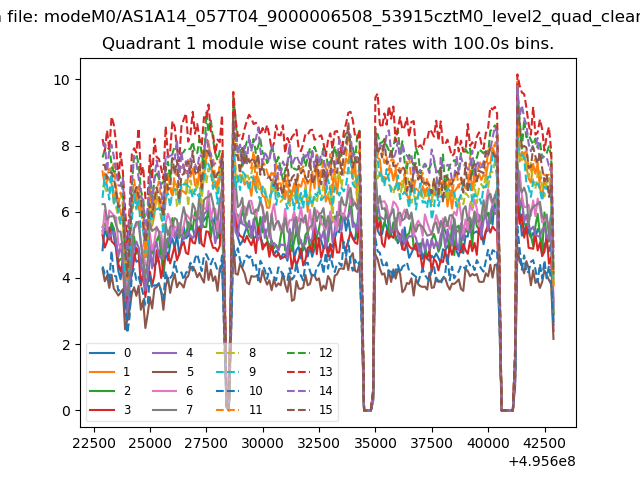
| Module-wise count rates for Quadrant A Data is divided into 100 sec bins |
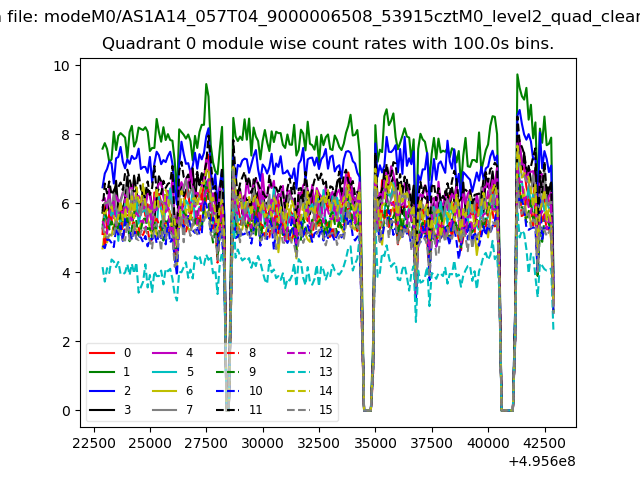 |
 |
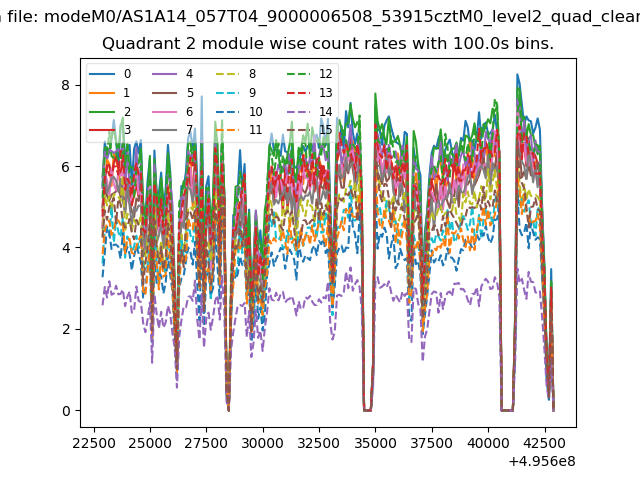
| Module-wise count rates for Quadrant B Data is divided into 100 sec bins |
 |
 |
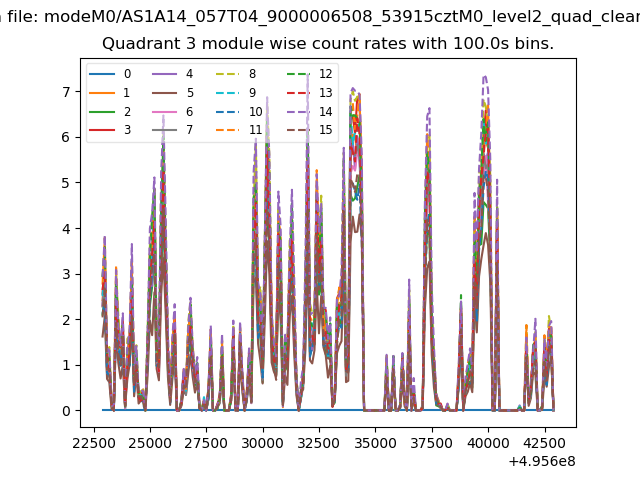
| Module-wise count rates for Quadrant C Data is divided into 100 sec bins |
 |
 |
| Module-wise count rates for Quadrant D Data is divided into 100 sec bins |
 |
 |
| Parameter | Plot |
|---|---|
| CZT HV Monitor | 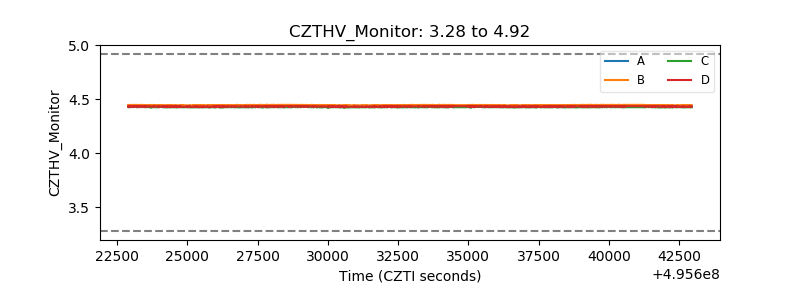 |
| D_VDD | 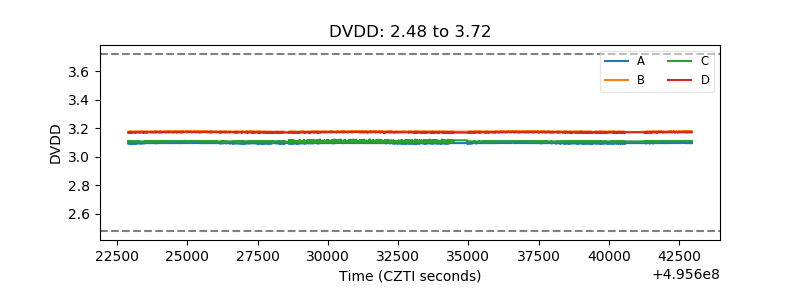 |
| Temperature 1 | 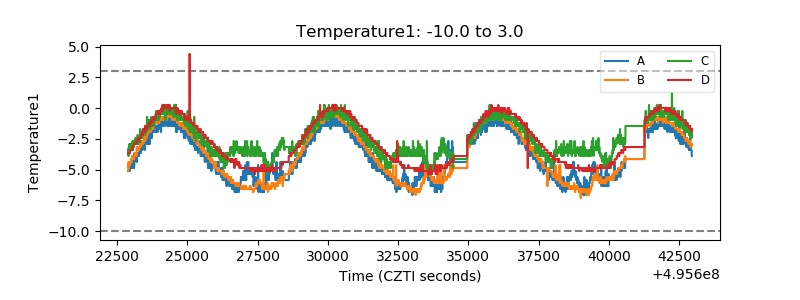 |
| Veto HV Monitor | 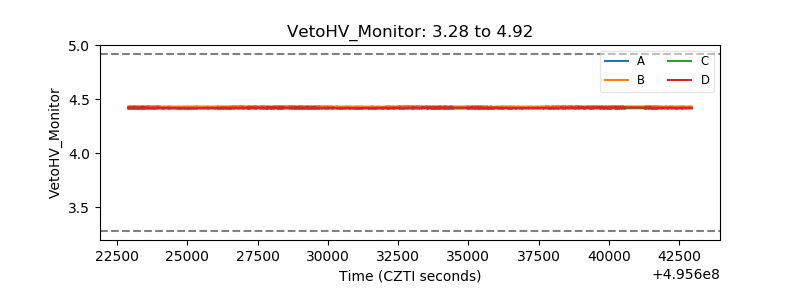 |
| Veto LLD | 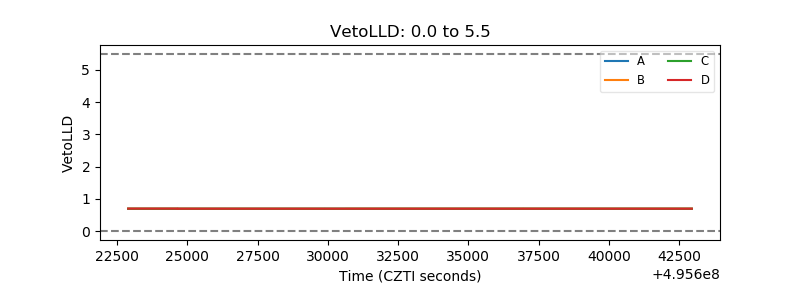 |
| Alpha Counter | 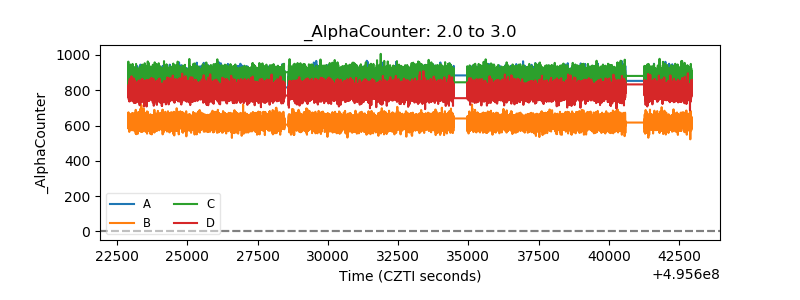 |
| _CPM_Rate | 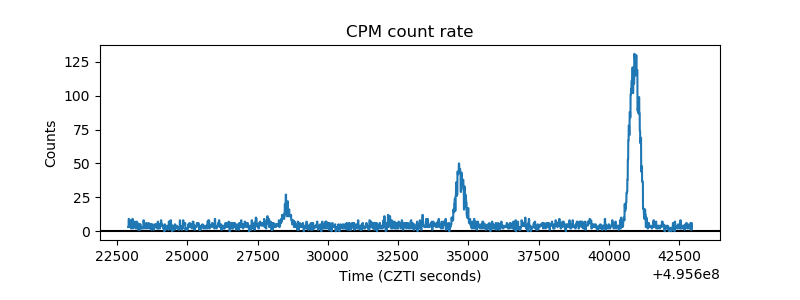 |
| CZT Counter | 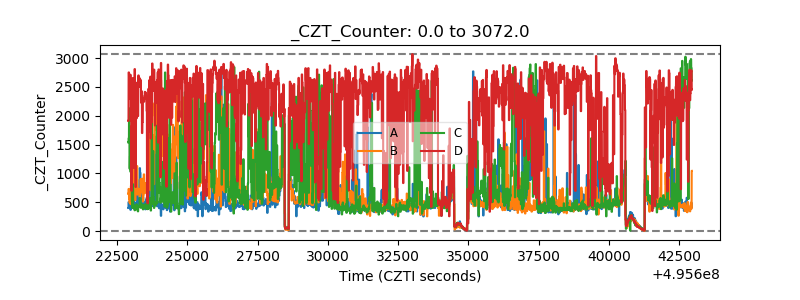 |
| +2.5 Volts monitor |  |
| +5 Volts monitor |  |
| _ROLL_ROT | 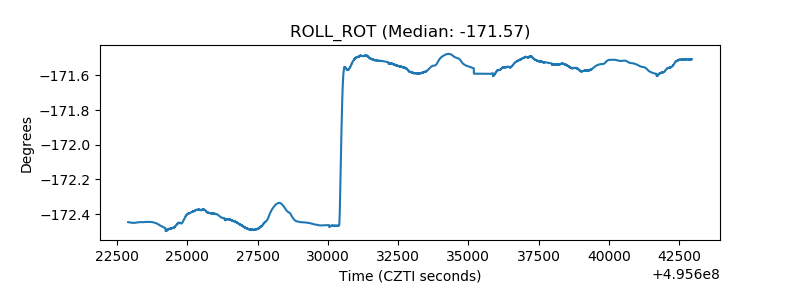 |
| _Roll_DEC | 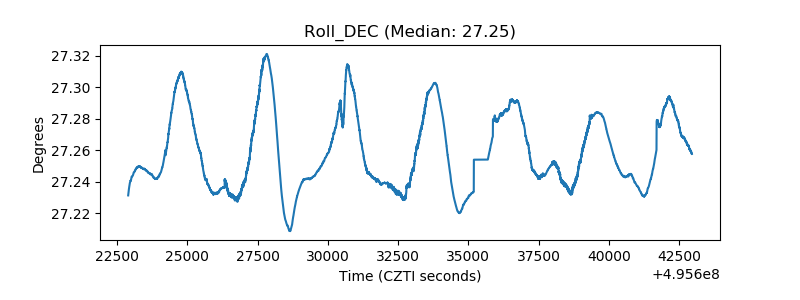 |
| _Roll_RA | 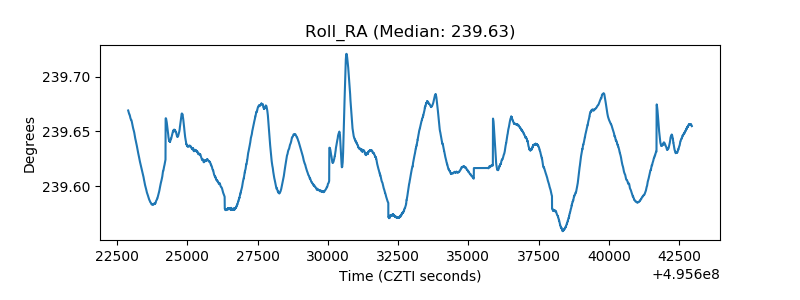 |
| Veto Counter | 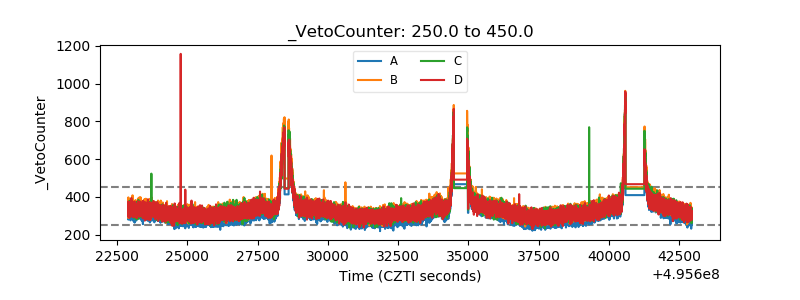 |