| Param | Original file | Final file |
|---|---|---|
| Filename | modeM0/AS1A14_057T04_9000006508_53916cztM0_level2.fits | modeM0/AS1A14_057T04_9000006508_53916cztM0_level2_quad_clean.evt |
| Size (bytes) | 692,948,160 | 71,628,480 |
| Size | 660.8 MB | 68.3 MB |
| Events in quadrant A | 2,899,278 | 591,581 |
| Events in quadrant B | 3,609,011 | 611,234 |
| Events in quadrant C | 6,069,142 | 448,342 |
| Events in quadrant D | 12,598,201 | 91,452 |
| Mode M0 | |||
|---|---|---|---|
| Quadrant | BADHDUFLAG | Total packets | Discarded packets |
| A | 0 | 13183 | 1 |
| B | 0 | 14965 | 1 |
| C | 0 | 22283 | 1 |
| D | 0 | 41607 | 1 |
| Mode SS | |||
|---|---|---|---|
| Quadrant | BADHDUFLAG | Total packets | Discarded packets |
| A | 0 | 124 | 0 |
| B | 0 | 124 | 0 |
| C | 0 | 124 | 0 |
| D | 0 | 124 | 0 |
| Mode M9 | |||
|---|---|---|---|
| Quadrant | BADHDUFLAG | Total packets | Discarded packets |
| A | 0 | 9 | 0 |
| B | 0 | 9 | 0 |
| C | 0 | 9 | 0 |
| D | 0 | 9 | 0 |
| Quadrant | Total seconds | Saturated seconds | Saturation percentage |
|---|---|---|---|
| A | 6101 | 99 | 1.622685% |
| B | 6101 | 198 | 3.245370% |
| C | 6102 | 1259 | 20.632579% |
| D | 6101 | 5192 | 85.100803% |
Noise dominated data is calculated using 1-second bins in cleaned event files. If a bin has >2000 counts, and if more than 50% of those come from <1% of pixels, then it is considered to be noise-dominated and hence unusable.
| Quadrant | # 1 sec bins | Bins with >0 counts | Bins with >2000 counts | High rate bins dominated by noise | Noise dominated (total time) | Noise dominated (detector-on time) | Marked lightcurve |
|---|---|---|---|---|---|---|---|
| A | 7001 | 6101 | 59 | 59 | 0.84% | 0.97% | 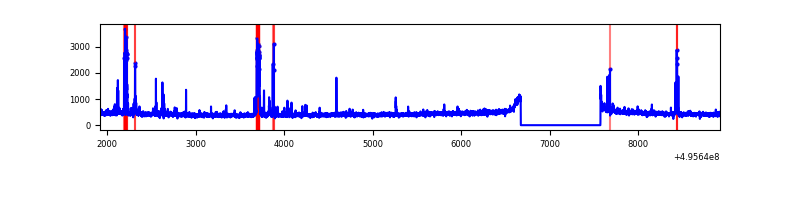 |
| B | 7001 | 6101 | 140 | 140 | 2.00% | 2.29% | 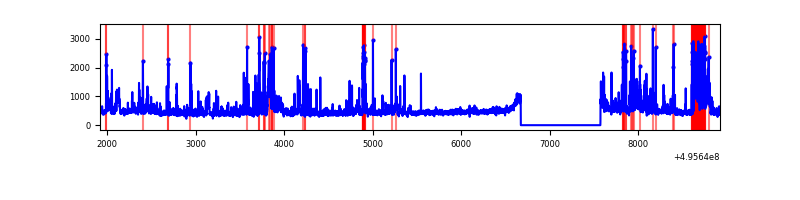 |
| C | 7002 | 6103 | 1243 | 1243 | 17.75% | 20.37% | 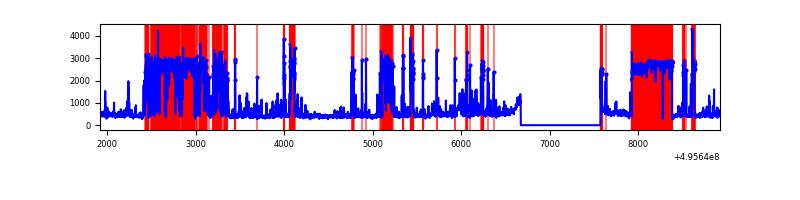 |
| D | 7000 | 6100 | 3893 | 3893 | 55.61% | 63.82% | 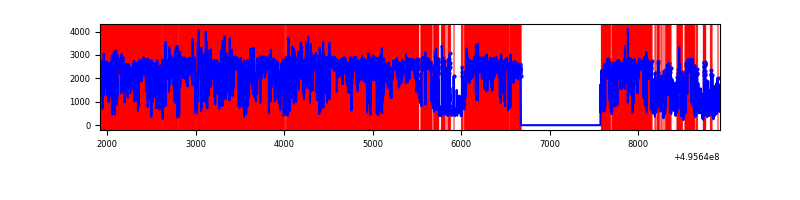 |
Top three noisy pixels from each quadrant. If the there are fewer than three noisy pixels in the level2.evt file, extra rows are filled as -1
| Pixel properties | Quadrant properties | ||||||
|---|---|---|---|---|---|---|---|
| Quadrant | DetID | PixID | Counts | Sigma | Mean | Median | Sigma |
| A | 15 | 174 | 199427 | 1222.19 | 656 | 639 | 162.6 |
| A | 0 | 8 | 54073 | 328.52 | 656 | 639 | 162.6 |
| A | 4 | 249 | 30464 | 183.37 | 656 | 639 | 162.6 |
| B | 0 | 213 | 439668 | 3192.84 | 643 | 621 | 137.5 |
| B | 5 | 236 | 144108 | 1043.47 | 643 | 621 | 137.5 |
| B | 5 | 185 | 141503 | 1024.52 | 643 | 621 | 137.5 |
| C | 1 | 241 | 2276070 | 14694.44 | 555 | 549 | 154.9 |
| C | 13 | 3 | 1298319 | 8380.5 | 555 | 549 | 154.9 |
| C | 12 | 2 | 52303 | 334.21 | 555 | 549 | 154.9 |
| D | 8 | 176 | 11190916 | 166488.42 | 228 | 218 | 67.2 |
| D | 3 | 12 | 188310 | 2798.32 | 228 | 218 | 67.2 |
| D | 8 | 160 | 59086 | 875.8 | 228 | 218 | 67.2 |
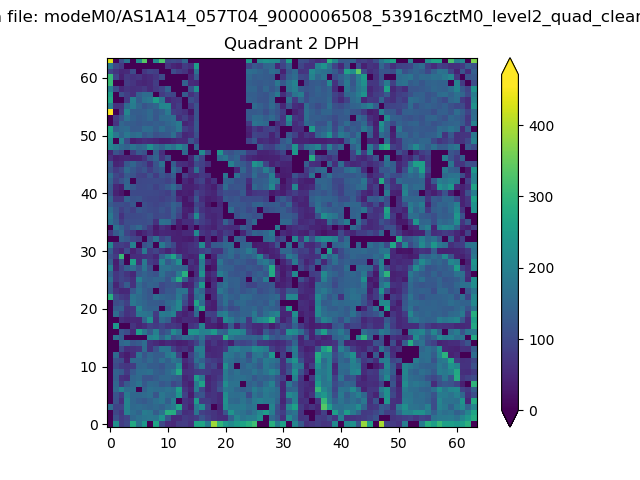
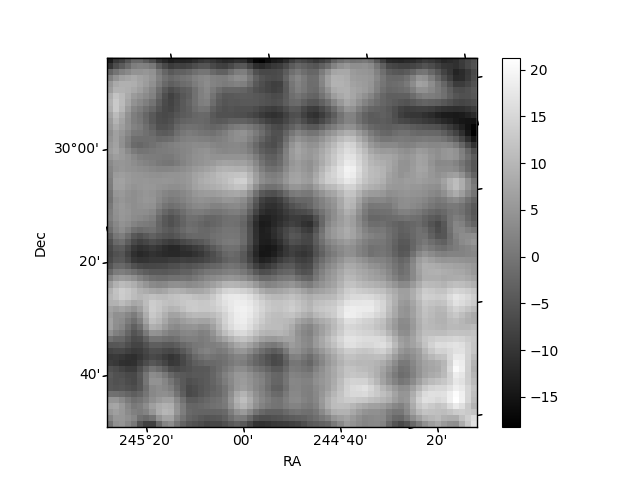
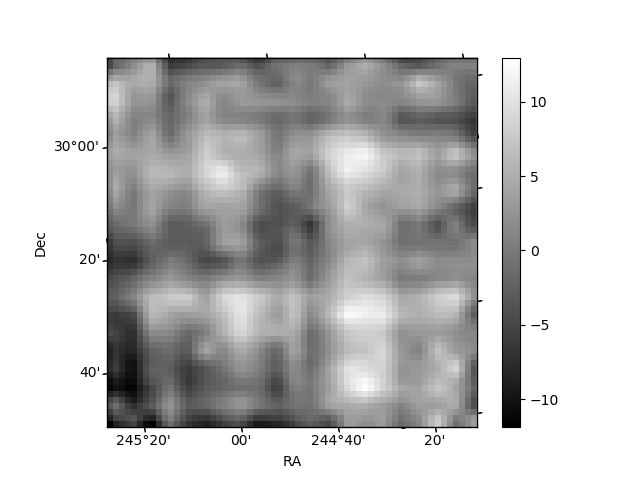
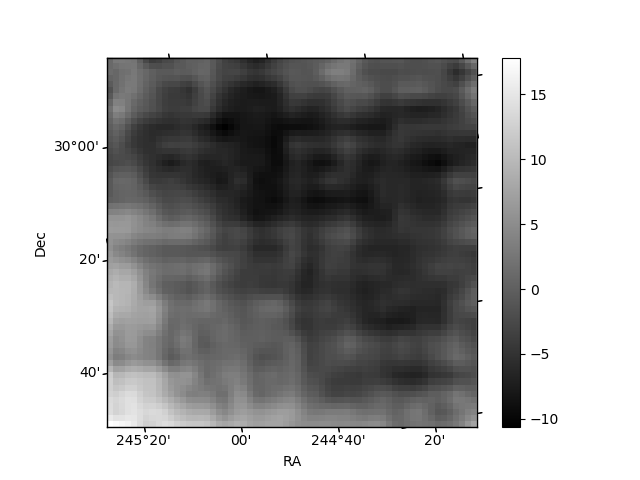
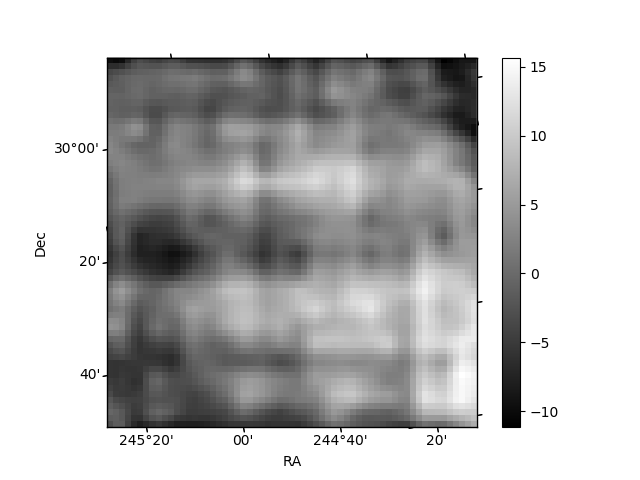
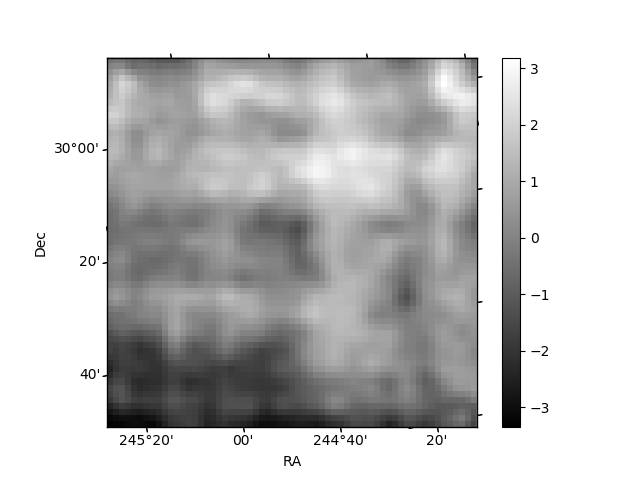
Histogram calculated using DETX and DETY for each event in the final _common_clean file
| Quadrant A | 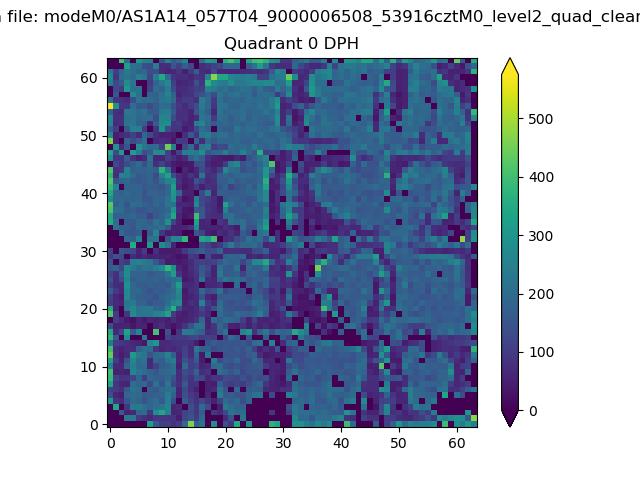 |
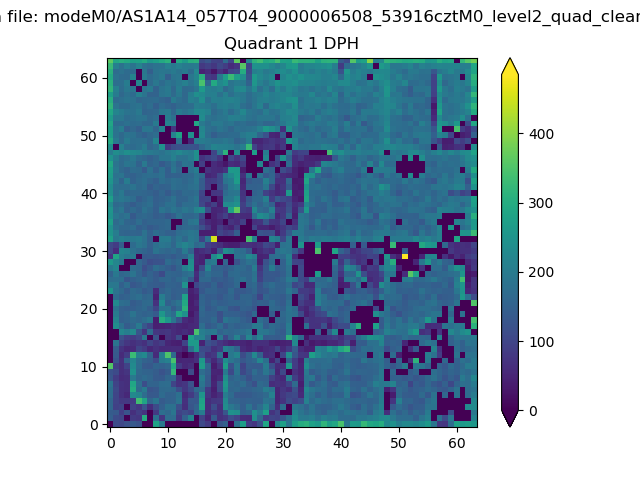 |
Quadrant B |
|---|---|---|---|
| Quadrant D | 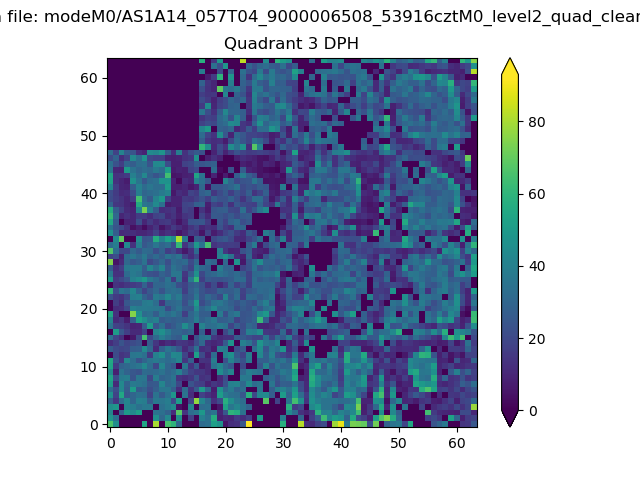 |
 |
Quadrant C |
| Plot type | Count rate plots | Images |
|---|---|---|
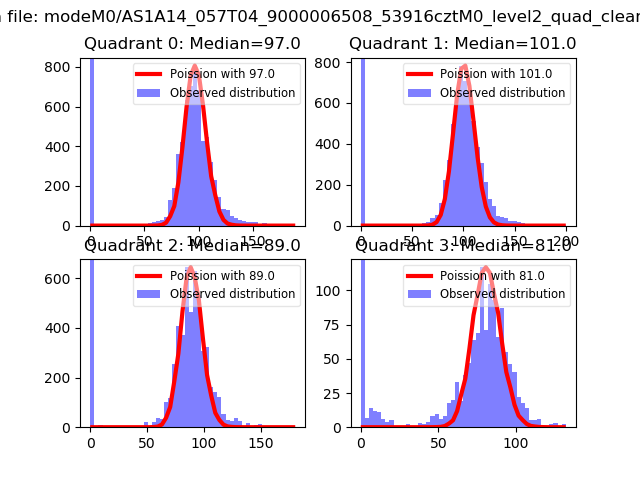
| Comparison with Poisson distribution Blue bars denote a histogram of data divided into 1 sec bins. Red curve is a Poisson curve with rate = median count rate of data. |
 |
 |
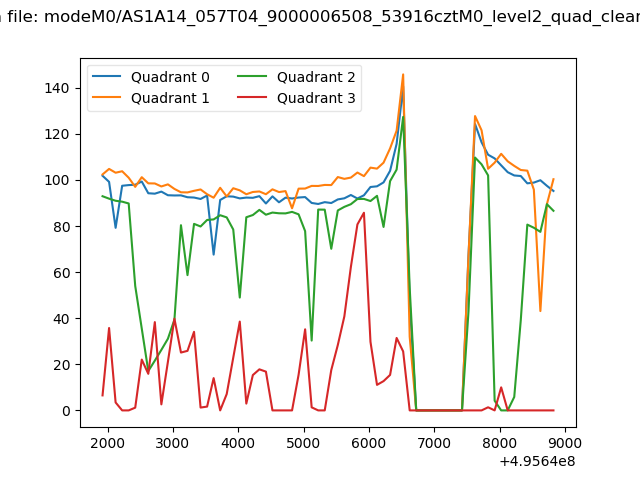
| Quadrant-wise count rates Data is divided into 100 sec bins |
 |
|
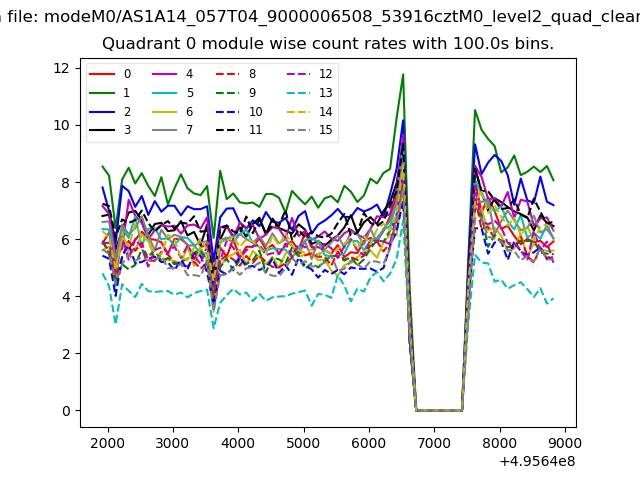
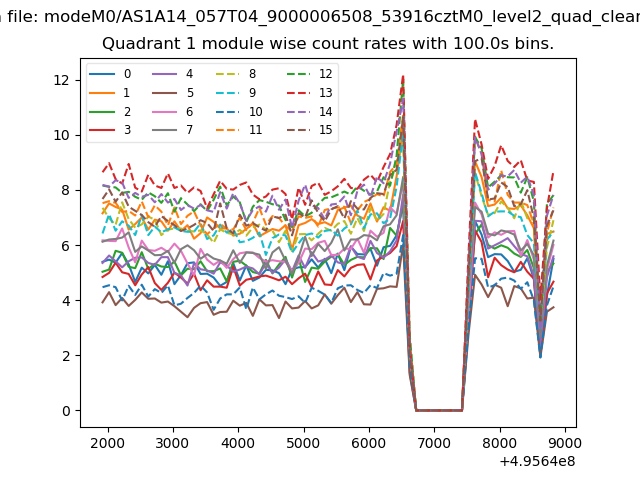
| Module-wise count rates for Quadrant A Data is divided into 100 sec bins |
 |
 |
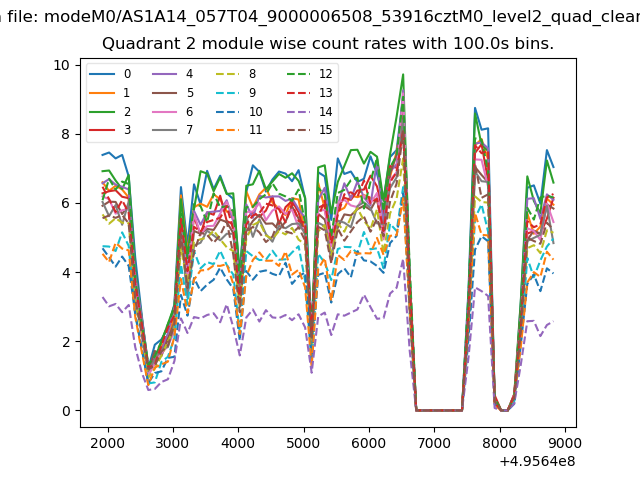
| Module-wise count rates for Quadrant B Data is divided into 100 sec bins |
 |
 |
| Module-wise count rates for Quadrant C Data is divided into 100 sec bins |
 |
 |
| Module-wise count rates for Quadrant D Data is divided into 100 sec bins |
 |
 |
| Parameter | Plot |
|---|---|
| CZT HV Monitor | 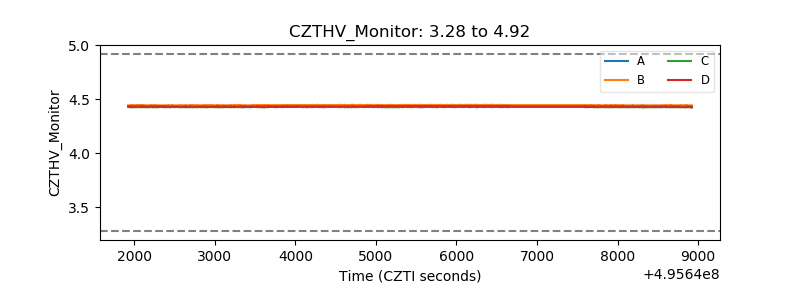 |
| D_VDD | 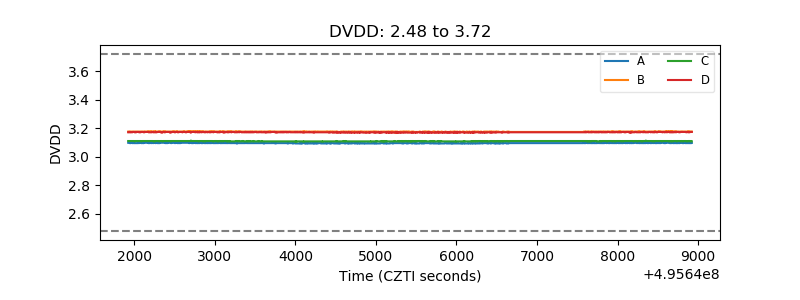 |
| Temperature 1 | 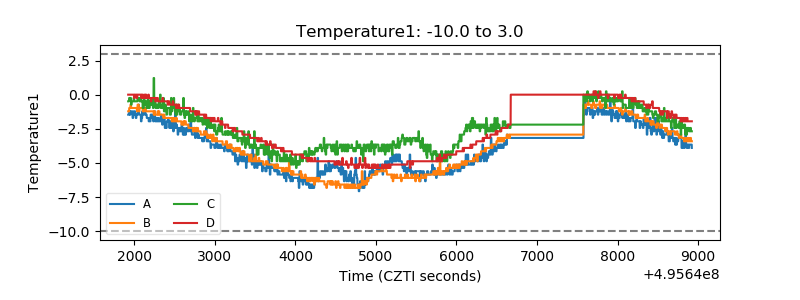 |
| Veto HV Monitor | 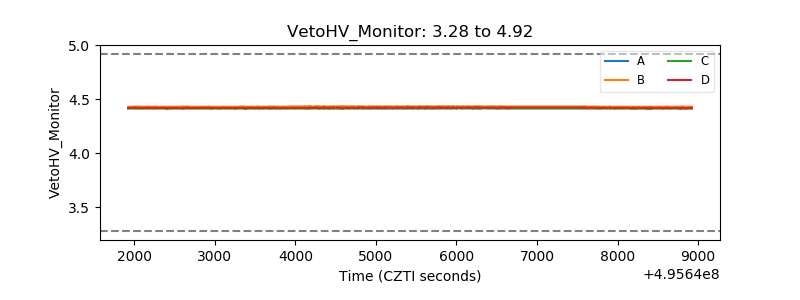 |
| Veto LLD | 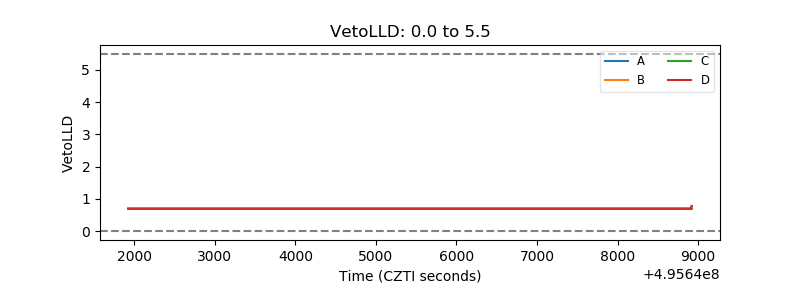 |
| Alpha Counter | 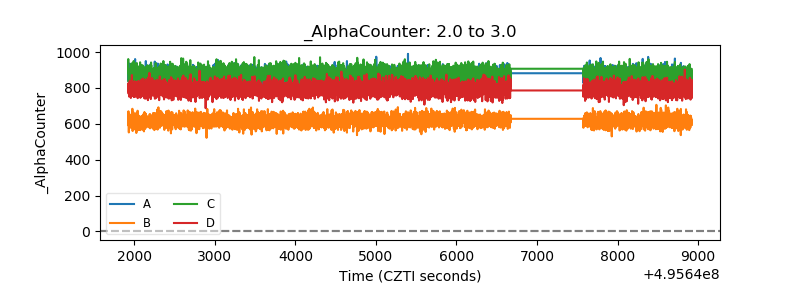 |
| _CPM_Rate | 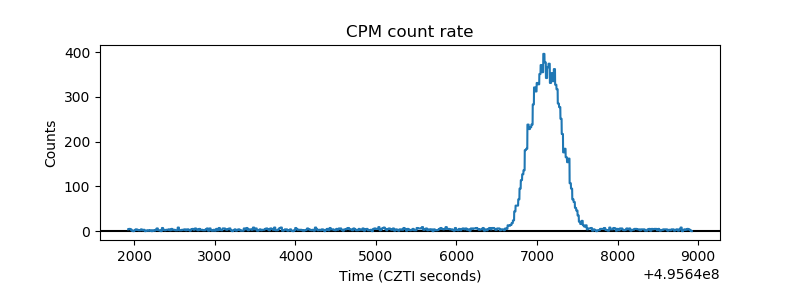 |
| CZT Counter | 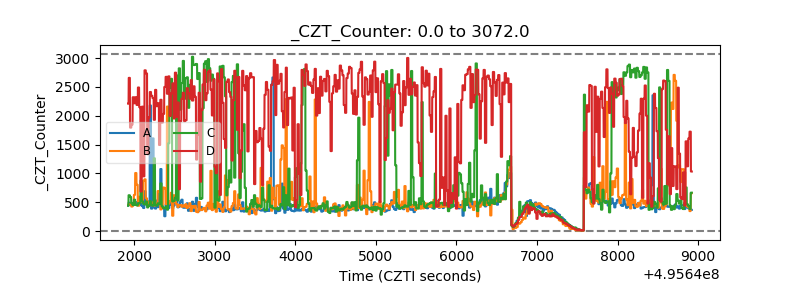 |
| +2.5 Volts monitor |  |
| +5 Volts monitor |  |
| _ROLL_ROT | 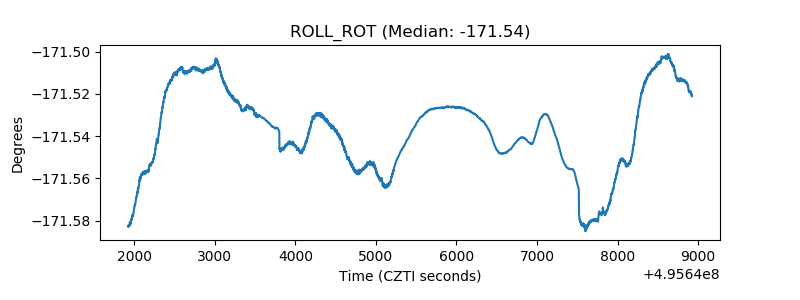 |
| _Roll_DEC | 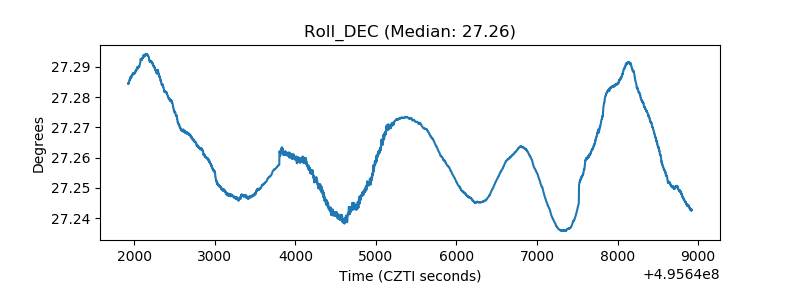 |
| _Roll_RA | 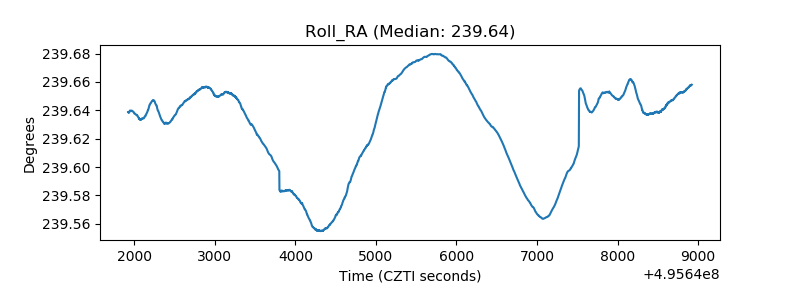 |
| Veto Counter | 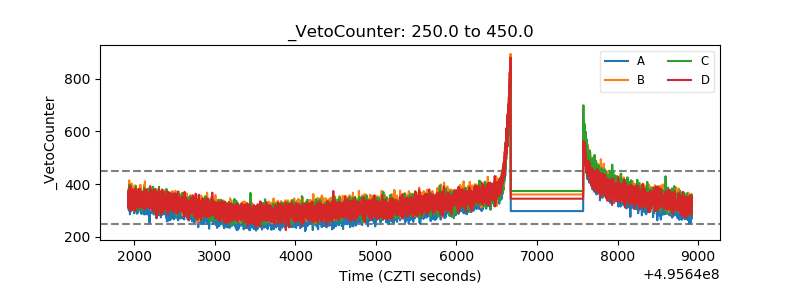 |