| Param | Original file | Final file |
|---|---|---|
| Filename | modeM0/AS1A14_057T04_9000006508_53918cztM0_level2.fits | modeM0/AS1A14_057T04_9000006508_53918cztM0_level2_quad_clean.evt |
| Size (bytes) | 531,054,720 | 82,442,880 |
| Size | 506.5 MB | 78.6 MB |
| Events in quadrant A | 2,827,187 | 618,990 |
| Events in quadrant B | 3,711,180 | 635,553 |
| Events in quadrant C | 4,400,531 | 533,493 |
| Events in quadrant D | 8,229,079 | 270,002 |
| Mode M0 | |||
|---|---|---|---|
| Quadrant | BADHDUFLAG | Total packets | Discarded packets |
| A | 0 | 13007 | 1 |
| B | 0 | 15415 | 1 |
| C | 0 | 17596 | 1 |
| D | 0 | 28785 | 1 |
| Mode SS | |||
|---|---|---|---|
| Quadrant | BADHDUFLAG | Total packets | Discarded packets |
| A | 0 | 126 | 0 |
| B | 0 | 126 | 0 |
| C | 0 | 126 | 0 |
| D | 0 | 126 | 0 |
| Mode M9 | |||
|---|---|---|---|
| Quadrant | BADHDUFLAG | Total packets | Discarded packets |
| A | 0 | 11 | 0 |
| B | 0 | 11 | 0 |
| C | 0 | 11 | 0 |
| D | 0 | 11 | 0 |
| Quadrant | Total seconds | Saturated seconds | Saturation percentage |
|---|---|---|---|
| A | 6283 | 25 | 0.397899% |
| B | 6284 | 238 | 3.787397% |
| C | 6283 | 573 | 9.119847% |
| D | 6283 | 3351 | 53.334394% |
Noise dominated data is calculated using 1-second bins in cleaned event files. If a bin has >2000 counts, and if more than 50% of those come from <1% of pixels, then it is considered to be noise-dominated and hence unusable.
| Quadrant | # 1 sec bins | Bins with >0 counts | Bins with >2000 counts | High rate bins dominated by noise | Noise dominated (total time) | Noise dominated (detector-on time) | Marked lightcurve |
|---|---|---|---|---|---|---|---|
| A | 7338 | 6283 | 7 | 7 | 0.10% | 0.11% | 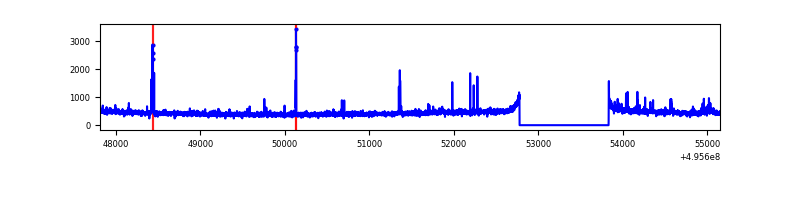 |
| B | 7339 | 6285 | 171 | 171 | 2.33% | 2.72% | 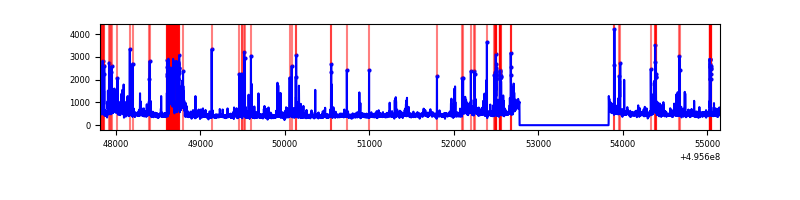 |
| C | 7338 | 6284 | 554 | 554 | 7.55% | 8.82% | 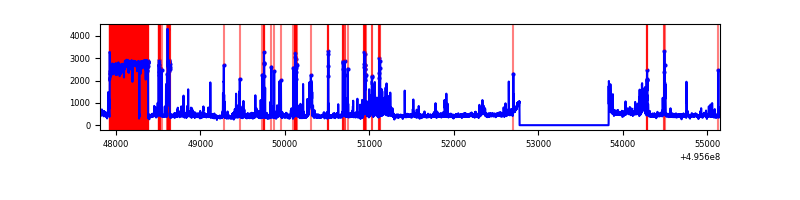 |
| D | 7338 | 6284 | 1576 | 1576 | 21.48% | 25.08% | 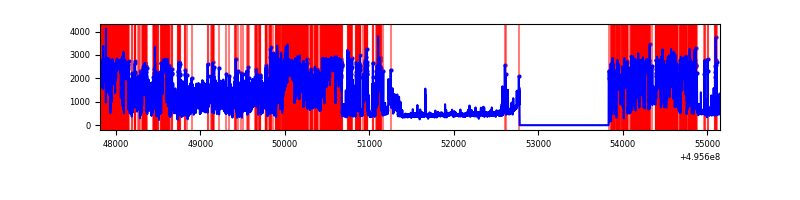 |
Top three noisy pixels from each quadrant. If the there are fewer than three noisy pixels in the level2.evt file, extra rows are filled as -1
| Pixel properties | Quadrant properties | ||||||
|---|---|---|---|---|---|---|---|
| Quadrant | DetID | PixID | Counts | Sigma | Mean | Median | Sigma |
| A | 0 | 8 | 44694 | 264.09 | 677 | 663 | 166.7 |
| A | 4 | 3 | 29058 | 170.31 | 677 | 663 | 166.7 |
| A | 15 | 174 | 25305 | 147.8 | 677 | 663 | 166.7 |
| B | 0 | 213 | 381457 | 2673.11 | 664 | 639 | 142.5 |
| B | 5 | 236 | 269453 | 1886.91 | 664 | 639 | 142.5 |
| B | 5 | 185 | 174842 | 1222.8 | 664 | 639 | 142.5 |
| C | 13 | 3 | 1310935 | 7629.44 | 613 | 608 | 171.7 |
| C | 1 | 241 | 358251 | 2082.39 | 613 | 608 | 171.7 |
| C | 15 | 164 | 76711 | 443.11 | 613 | 608 | 171.7 |
| D | 8 | 176 | 5894773 | 52284.44 | 392 | 374 | 112.7 |
| D | 3 | 12 | 295877 | 2621.17 | 392 | 374 | 112.7 |
| D | 3 | 224 | 127716 | 1129.55 | 392 | 374 | 112.7 |
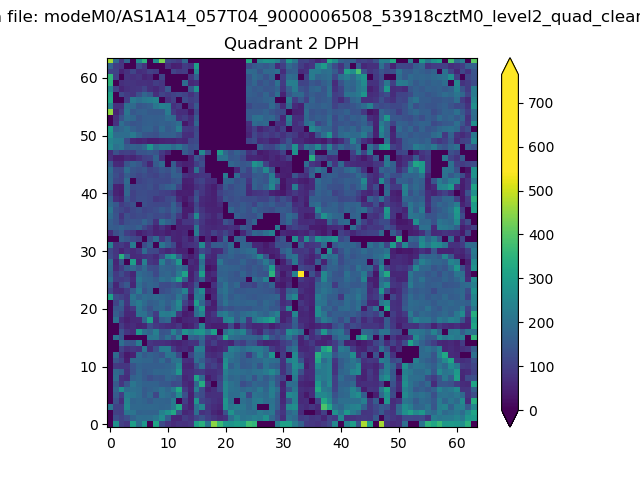
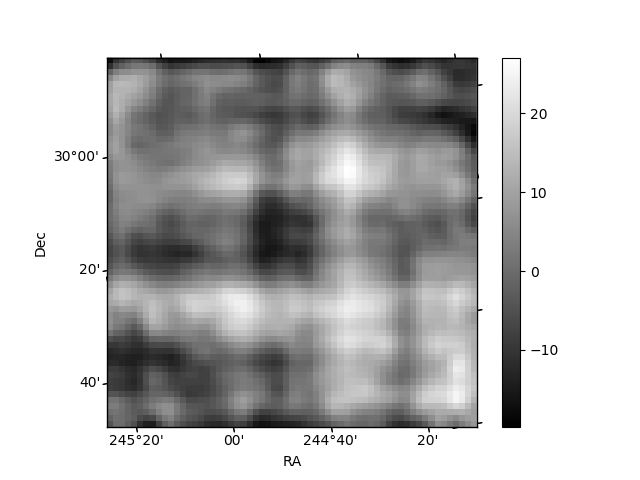
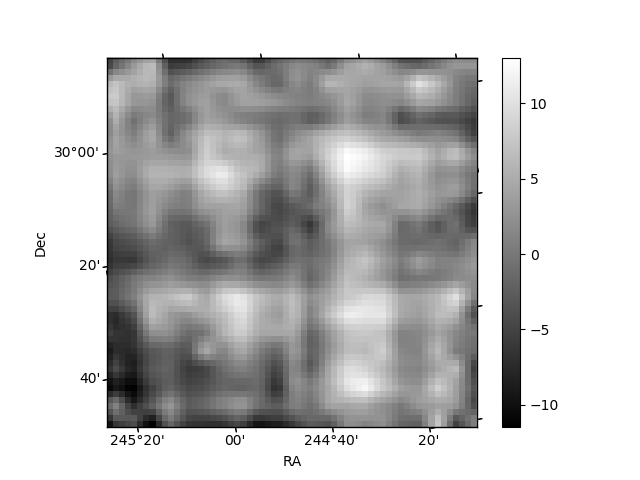
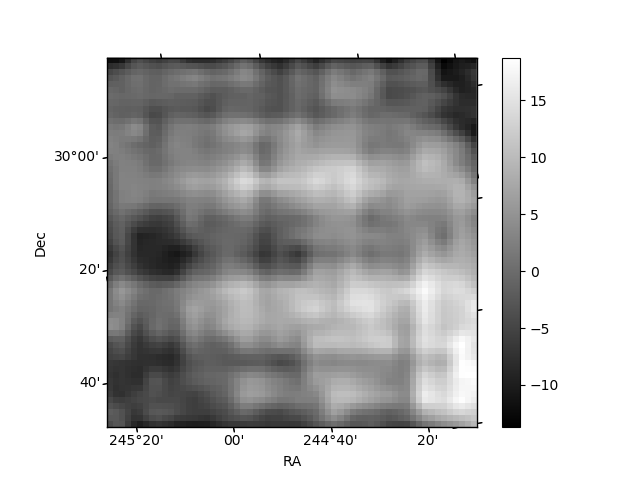
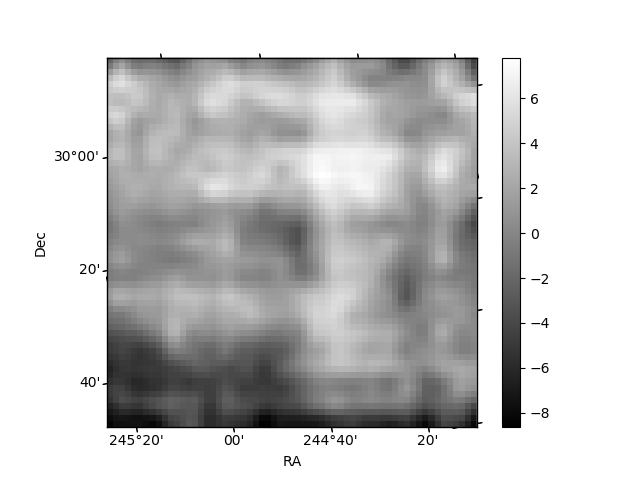
Histogram calculated using DETX and DETY for each event in the final _common_clean file
| Quadrant A | 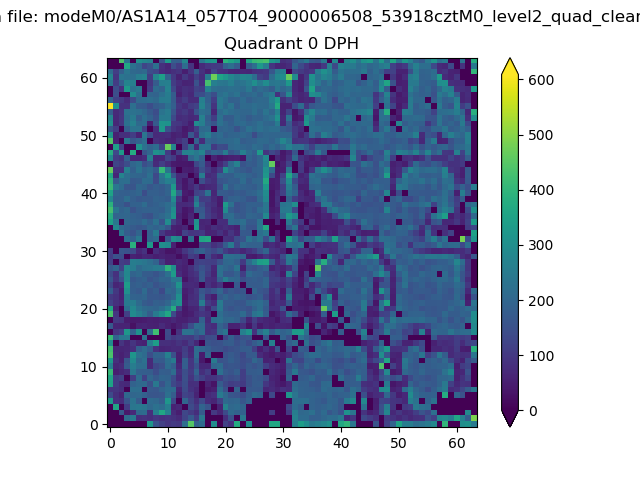 |
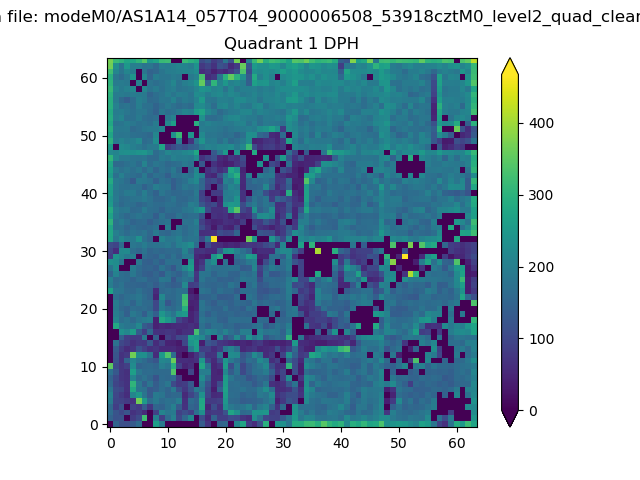 |
Quadrant B |
|---|---|---|---|
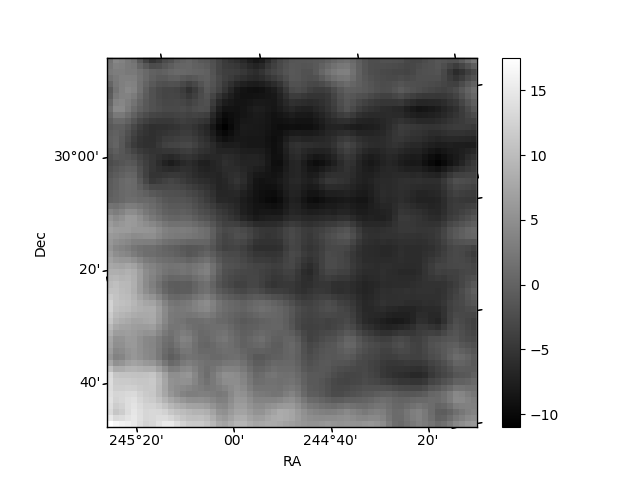
| Quadrant D | 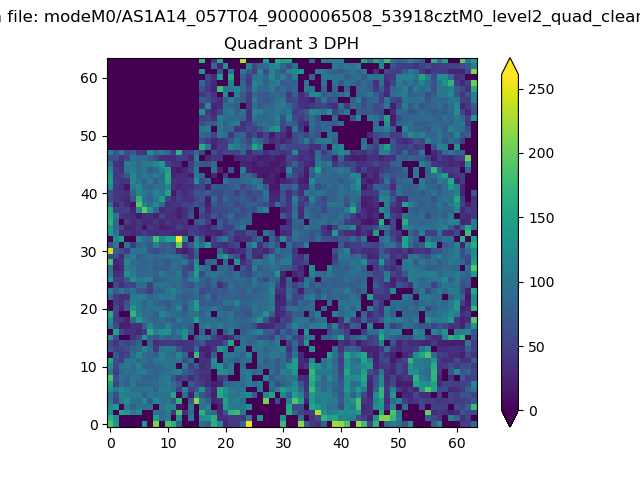 |
 |
Quadrant C |
| Plot type | Count rate plots | Images |
|---|---|---|
| Comparison with Poisson distribution Blue bars denote a histogram of data divided into 1 sec bins. Red curve is a Poisson curve with rate = median count rate of data. |
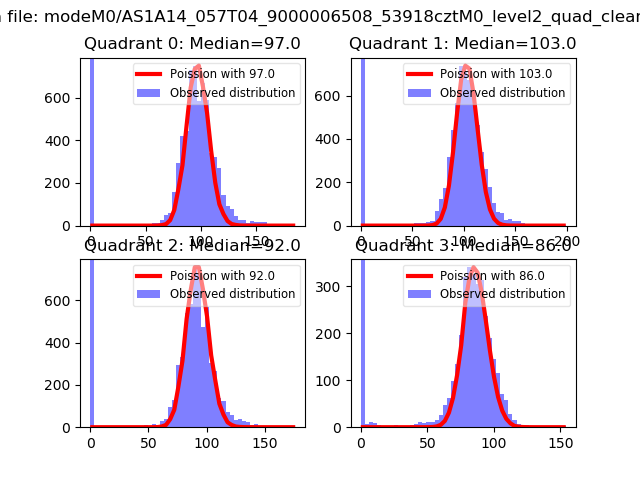 |
 |
| Quadrant-wise count rates Data is divided into 100 sec bins |
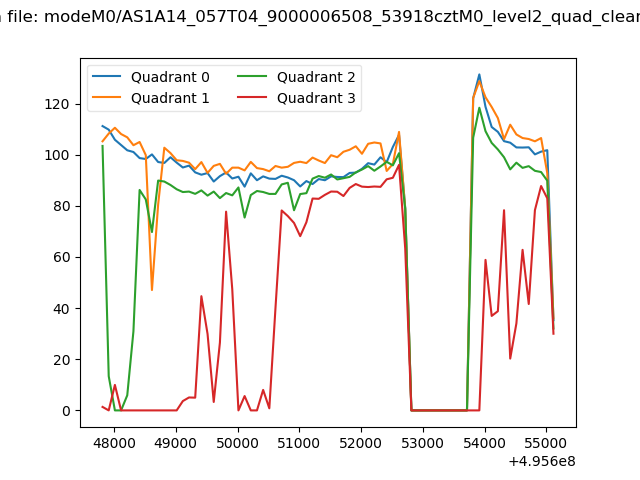 |
|
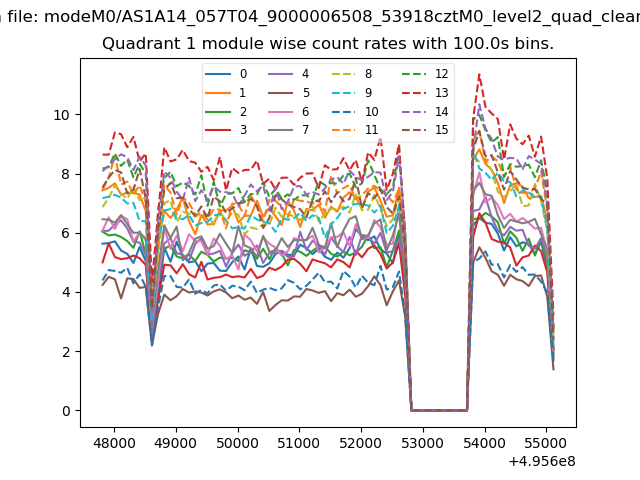
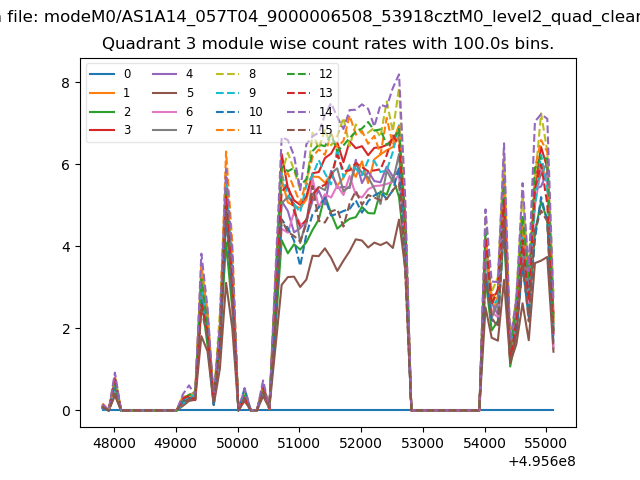
| Module-wise count rates for Quadrant A Data is divided into 100 sec bins |
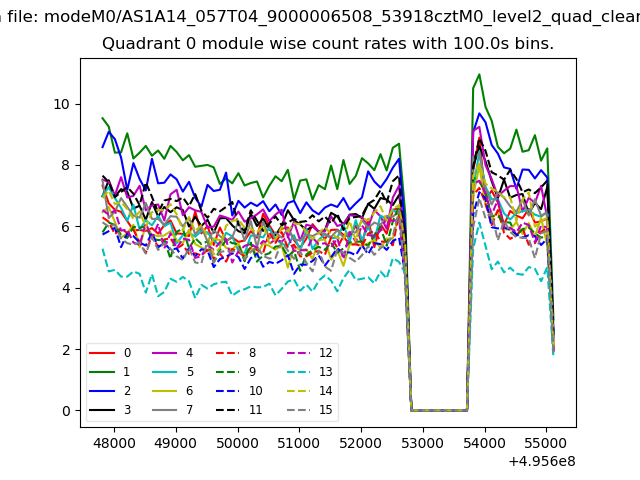 |
 |
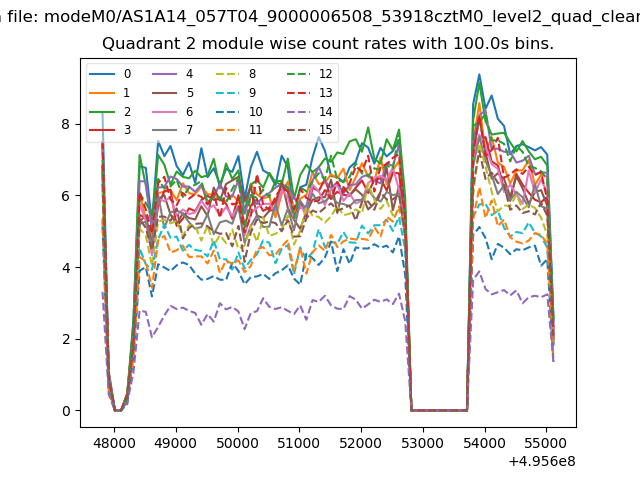
| Module-wise count rates for Quadrant B Data is divided into 100 sec bins |
 |
 |
| Module-wise count rates for Quadrant C Data is divided into 100 sec bins |
 |
 |
| Module-wise count rates for Quadrant D Data is divided into 100 sec bins |
 |
 |
| Parameter | Plot |
|---|---|
| CZT HV Monitor |  |
| D_VDD |  |
| Temperature 1 | 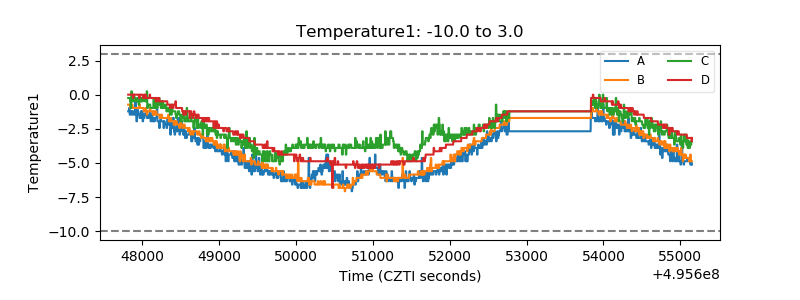 |
| Veto HV Monitor | 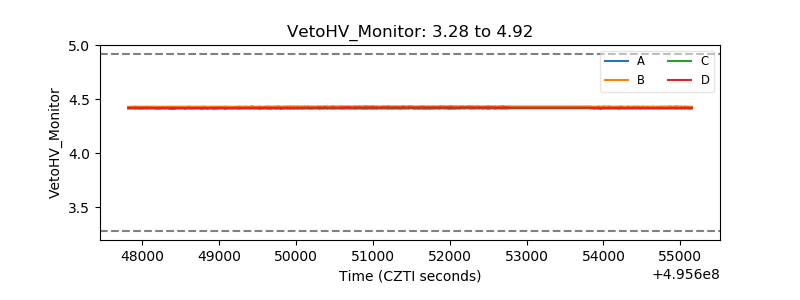 |
| Veto LLD | 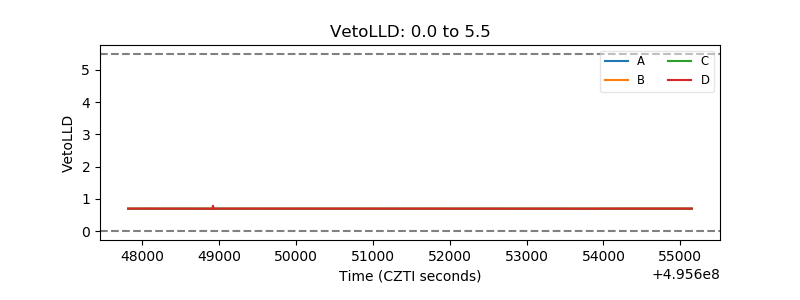 |
| Alpha Counter | 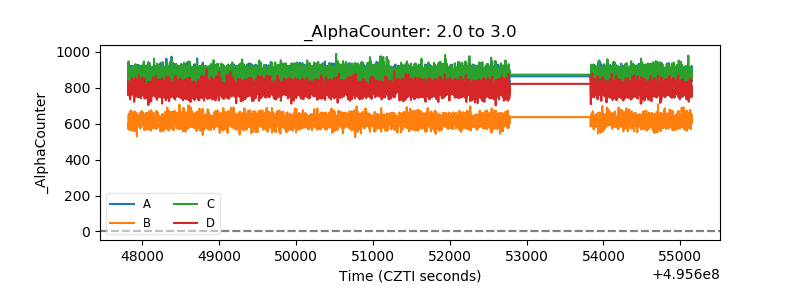 |
| _CPM_Rate | 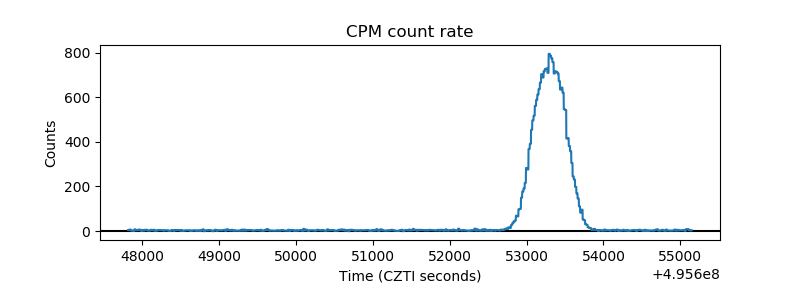 |
| CZT Counter | 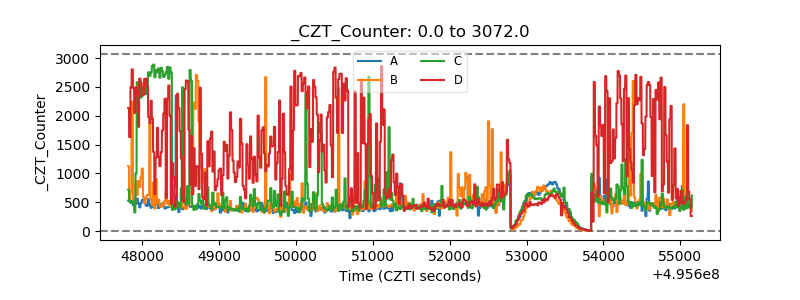 |
| +2.5 Volts monitor |  |
| +5 Volts monitor |  |
| _ROLL_ROT | 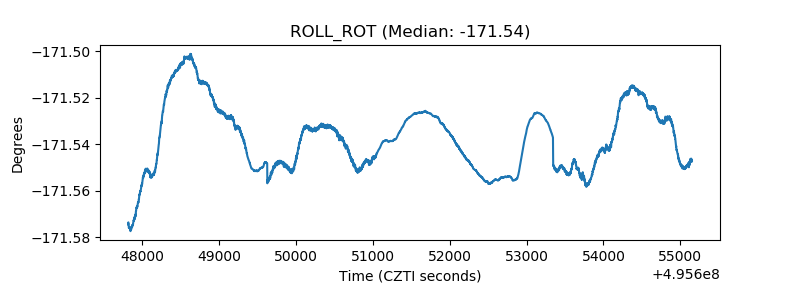 |
| _Roll_DEC | 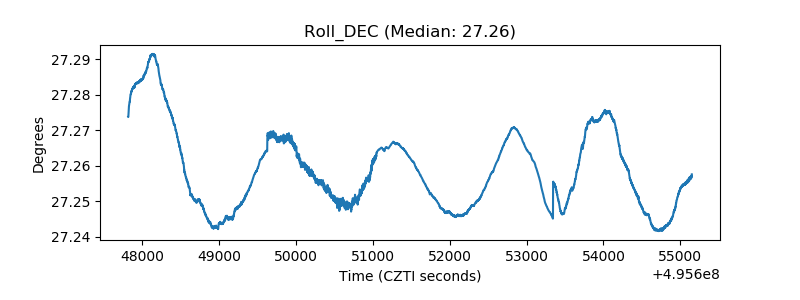 |
| _Roll_RA | 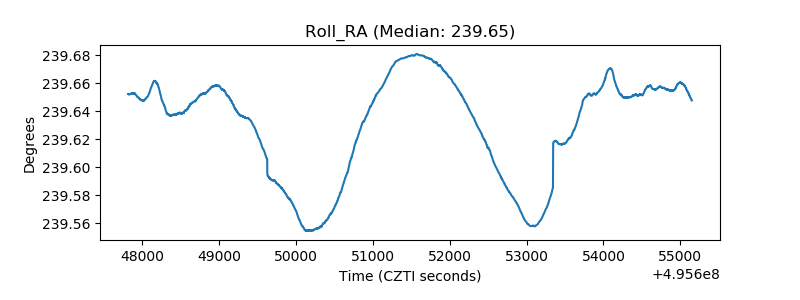 |
| Veto Counter | 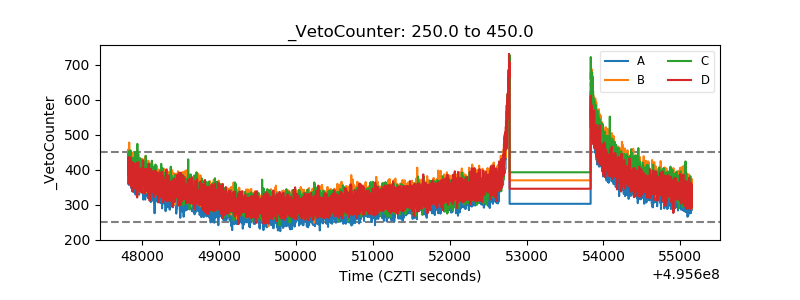 |