| Param | Original file | Final file |
|---|---|---|
| Filename | modeM0/AS1A14_057T04_9000006508_53923cztM0_level2.fits | modeM0/AS1A14_057T04_9000006508_53923cztM0_level2_quad_clean.evt |
| Size (bytes) | 642,015,360 | 94,674,240 |
| Size | 612.3 MB | 90.3 MB |
| Events in quadrant A | 3,617,366 | 665,817 |
| Events in quadrant B | 4,027,766 | 696,243 |
| Events in quadrant C | 4,543,921 | 626,824 |
| Events in quadrant D | 11,029,827 | 387,387 |
| Mode M0 | |||
|---|---|---|---|
| Quadrant | BADHDUFLAG | Total packets | Discarded packets |
| A | 0 | 15825 | 2 |
| B | 0 | 17005 | 4 |
| C | 0 | 18513 | 2 |
| D | 0 | 37642 | 2 |
| Mode SS | |||
|---|---|---|---|
| Quadrant | BADHDUFLAG | Total packets | Discarded packets |
| A | 0 | 146 | 0 |
| B | 0 | 146 | 0 |
| C | 0 | 146 | 0 |
| D | 0 | 146 | 0 |
| Mode M9 | |||
|---|---|---|---|
| Quadrant | BADHDUFLAG | Total packets | Discarded packets |
| A | 0 | 18 | 0 |
| B | 0 | 19 | 0 |
| C | 0 | 19 | 0 |
| D | 0 | 19 | 0 |
| Quadrant | Total seconds | Saturated seconds | Saturation percentage |
|---|---|---|---|
| A | 7036 | 175 | 2.487209% |
| B | 7035 | 353 | 5.017768% |
| C | 7035 | 354 | 5.031983% |
| D | 7035 | 2870 | 40.796020% |
Noise dominated data is calculated using 1-second bins in cleaned event files. If a bin has >2000 counts, and if more than 50% of those come from <1% of pixels, then it is considered to be noise-dominated and hence unusable.
| Quadrant | # 1 sec bins | Bins with >0 counts | Bins with >2000 counts | High rate bins dominated by noise | Noise dominated (total time) | Noise dominated (detector-on time) | Marked lightcurve |
|---|---|---|---|---|---|---|---|
| A | 7861 | 7036 | 91 | 91 | 1.16% | 1.29% | 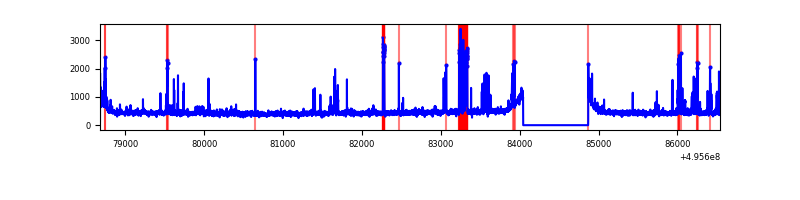 |
| B | 7859 | 7034 | 159 | 159 | 2.02% | 2.26% | 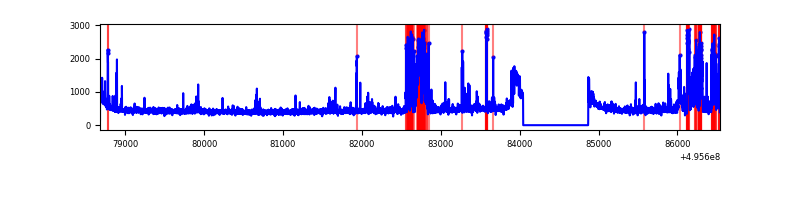 |
| C | 7860 | 7035 | 325 | 325 | 4.13% | 4.62% | 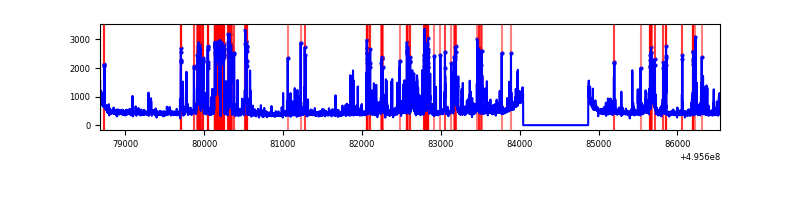 |
| D | 7860 | 7036 | 2650 | 2650 | 33.72% | 37.66% | 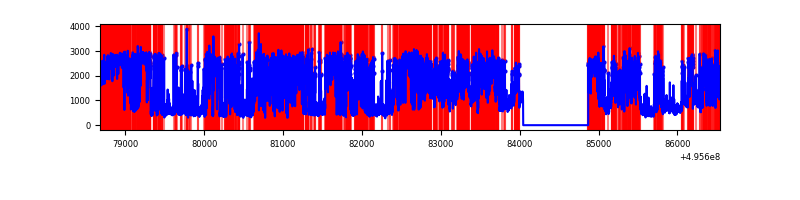 |
Top three noisy pixels from each quadrant. If the there are fewer than three noisy pixels in the level2.evt file, extra rows are filled as -1
| Pixel properties | Quadrant properties | ||||||
|---|---|---|---|---|---|---|---|
| Quadrant | DetID | PixID | Counts | Sigma | Mean | Median | Sigma |
| A | 0 | 8 | 311004 | 1627.31 | 775 | 757 | 190.7 |
| A | 15 | 174 | 117293 | 611.26 | 775 | 757 | 190.7 |
| A | 4 | 207 | 45688 | 235.67 | 775 | 757 | 190.7 |
| B | 5 | 236 | 478932 | 2894.1 | 764 | 735 | 165.2 |
| B | 5 | 185 | 281555 | 1699.55 | 764 | 735 | 165.2 |
| B | 0 | 213 | 157414 | 948.24 | 764 | 735 | 165.2 |
| C | 1 | 241 | 966912 | 4699.46 | 745 | 736 | 205.6 |
| C | 13 | 3 | 224981 | 1090.72 | 745 | 736 | 205.6 |
| C | 12 | 2 | 134233 | 649.33 | 745 | 736 | 205.6 |
| D | 8 | 176 | 7036208 | 42624.75 | 569 | 543 | 165.1 |
| D | 2 | 165 | 1076195 | 6516.71 | 569 | 543 | 165.1 |
| D | 2 | 172 | 308522 | 1865.85 | 569 | 543 | 165.1 |
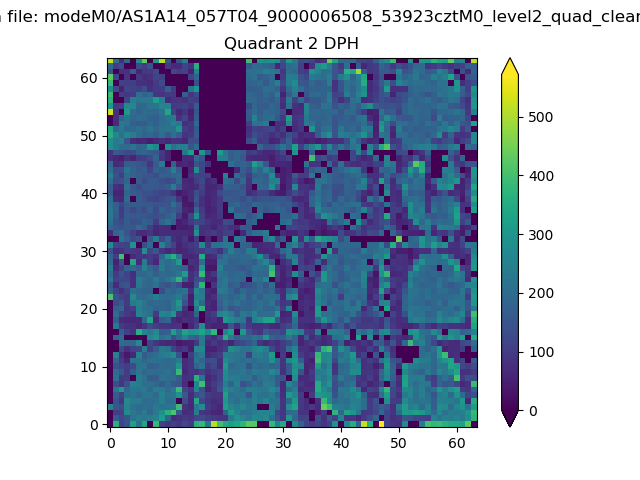
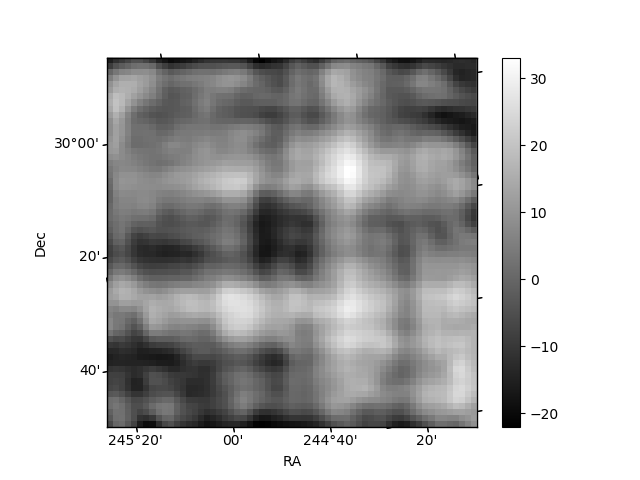
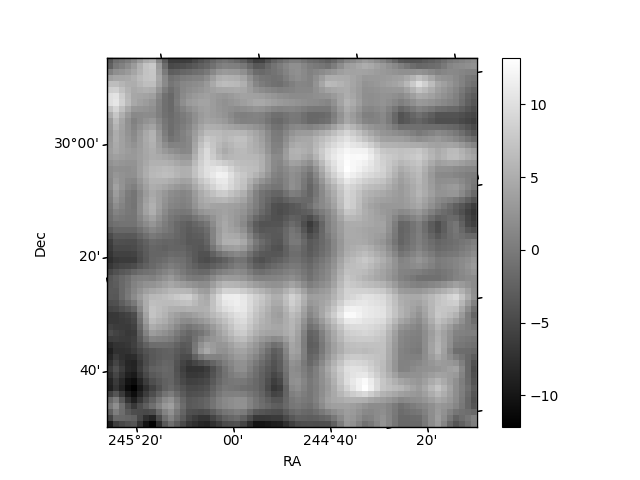
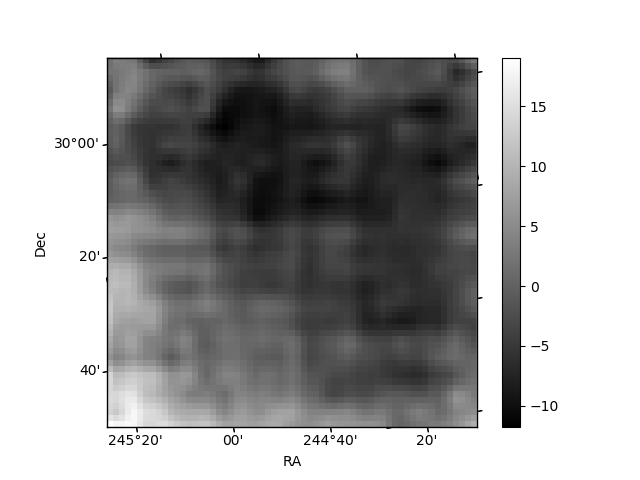
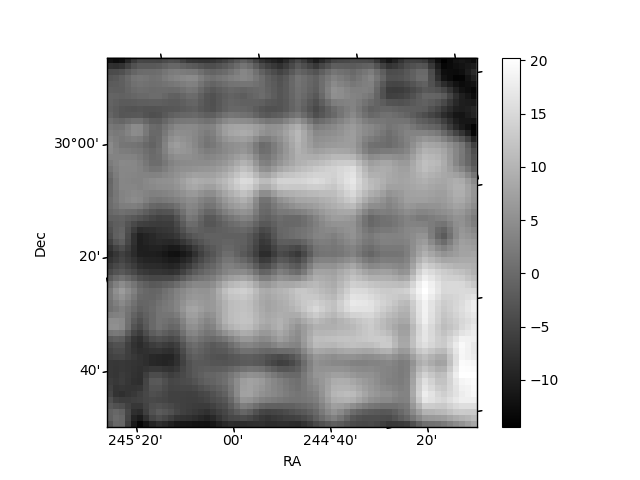
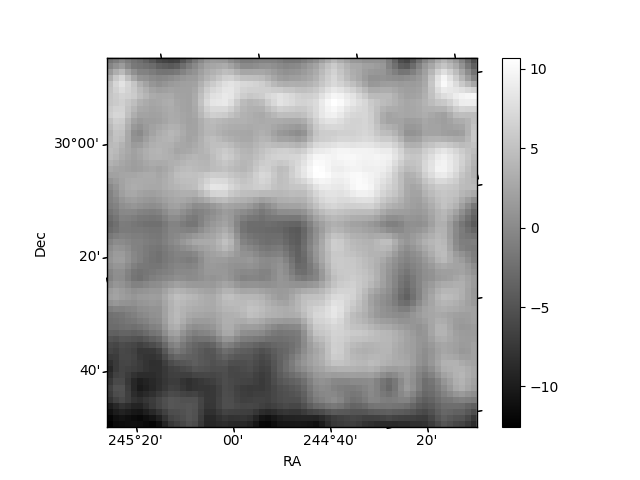
Histogram calculated using DETX and DETY for each event in the final _common_clean file
| Quadrant A | 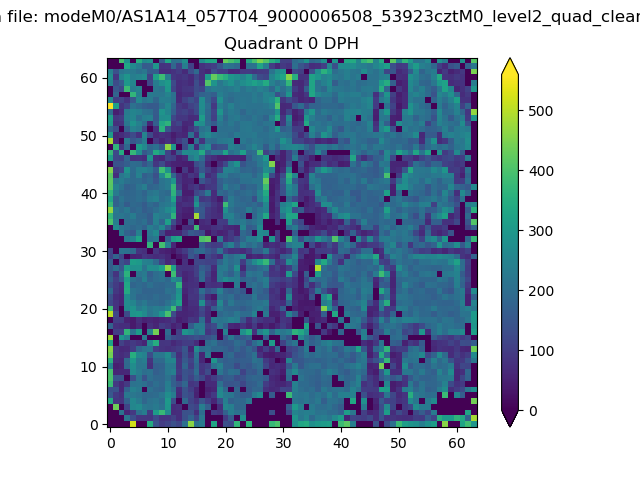 |
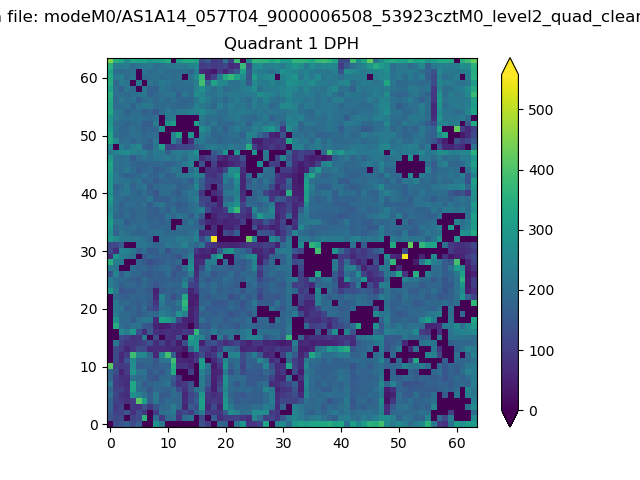 |
Quadrant B |
|---|---|---|---|
| Quadrant D | 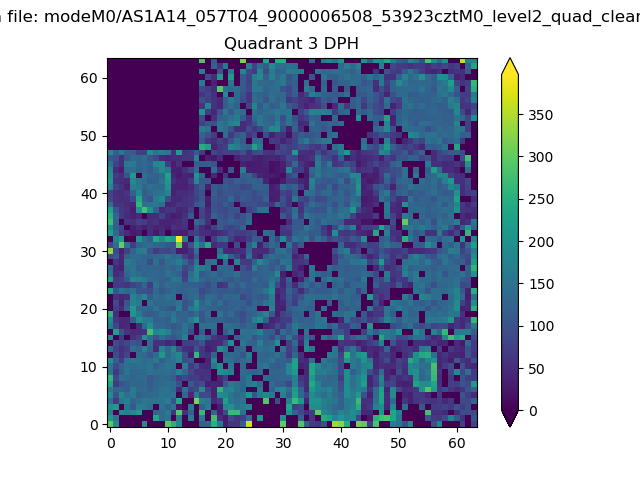 |
 |
Quadrant C |
| Plot type | Count rate plots | Images |
|---|---|---|
| Comparison with Poisson distribution Blue bars denote a histogram of data divided into 1 sec bins. Red curve is a Poisson curve with rate = median count rate of data. |
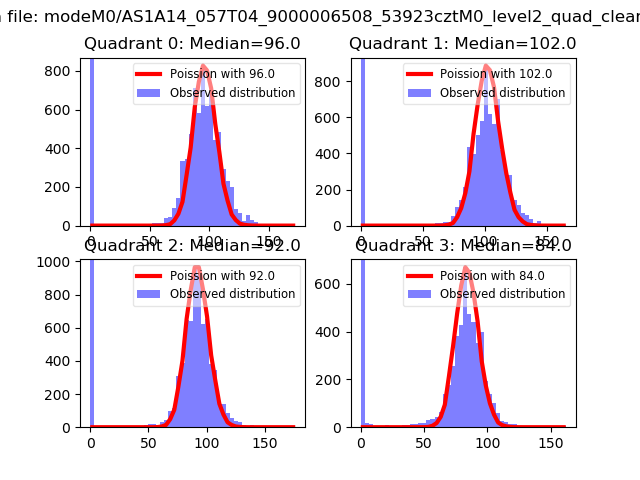 |
 |
| Quadrant-wise count rates Data is divided into 100 sec bins |
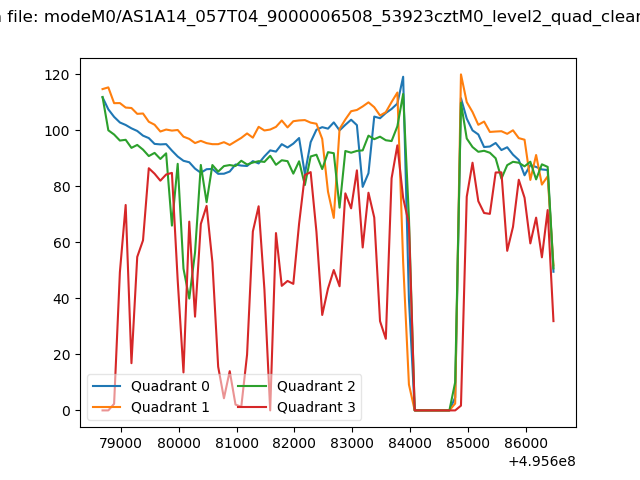 |
|
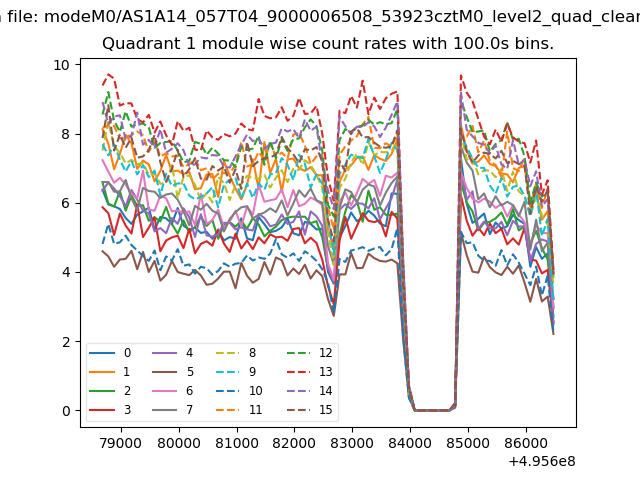
| Module-wise count rates for Quadrant A Data is divided into 100 sec bins |
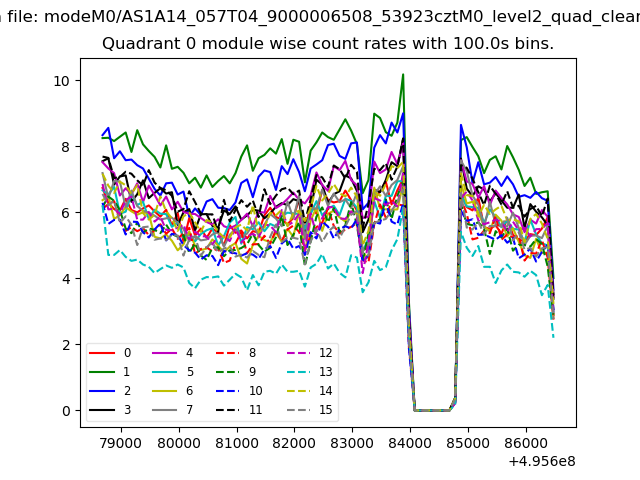 |
 |
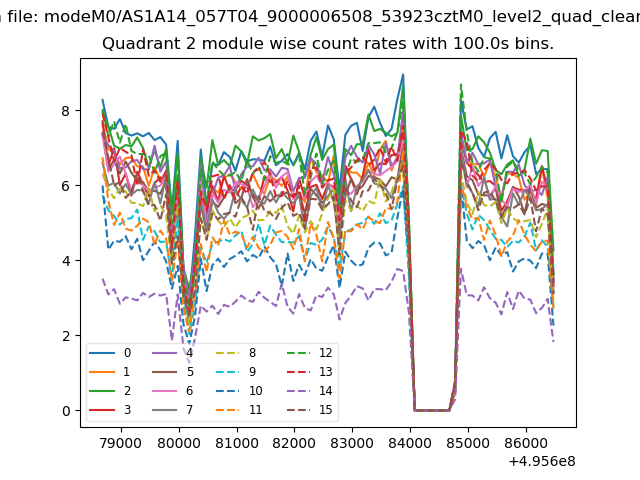
| Module-wise count rates for Quadrant B Data is divided into 100 sec bins |
 |
 |
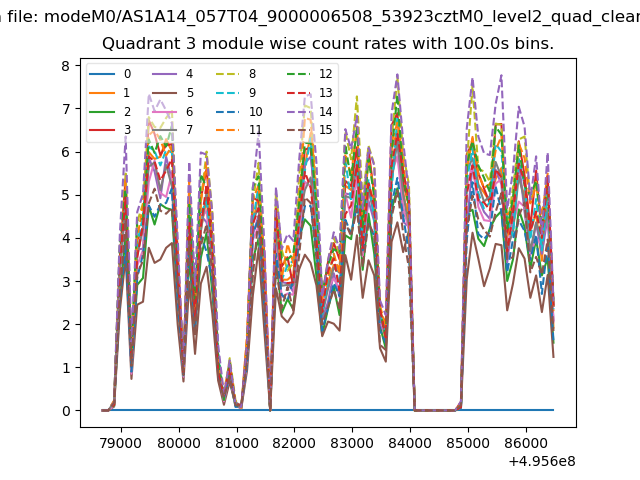
| Module-wise count rates for Quadrant C Data is divided into 100 sec bins |
 |
 |
| Module-wise count rates for Quadrant D Data is divided into 100 sec bins |
 |
 |
| Parameter | Plot |
|---|---|
| CZT HV Monitor | 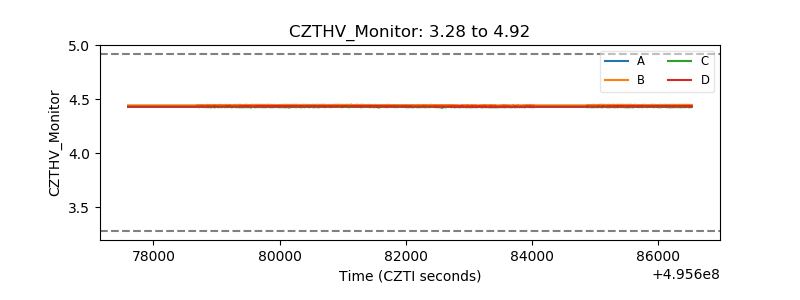 |
| D_VDD | 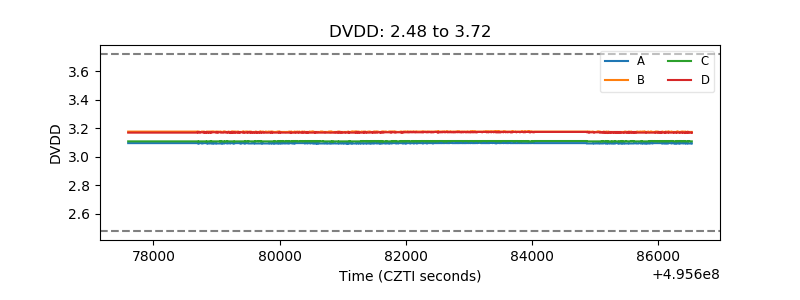 |
| Temperature 1 | 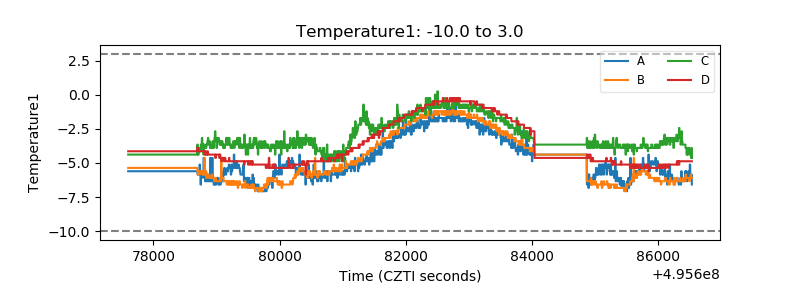 |
| Veto HV Monitor |  |
| Veto LLD | 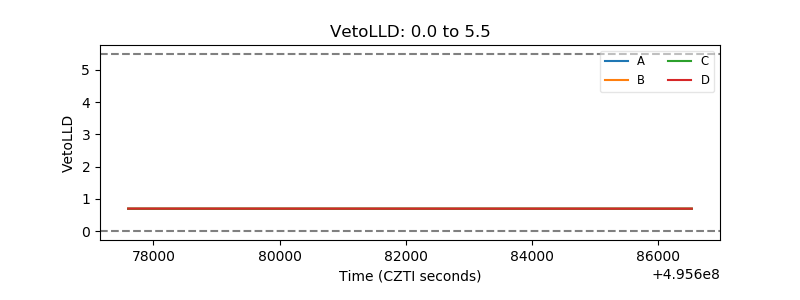 |
| Alpha Counter | 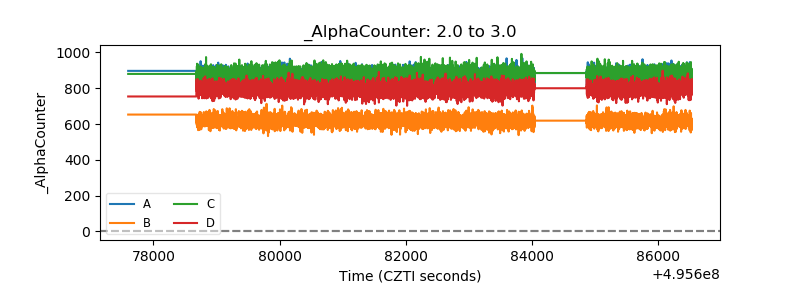 |
| _CPM_Rate | 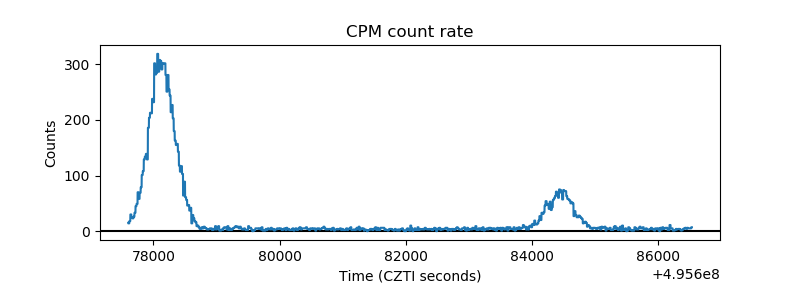 |
| CZT Counter | 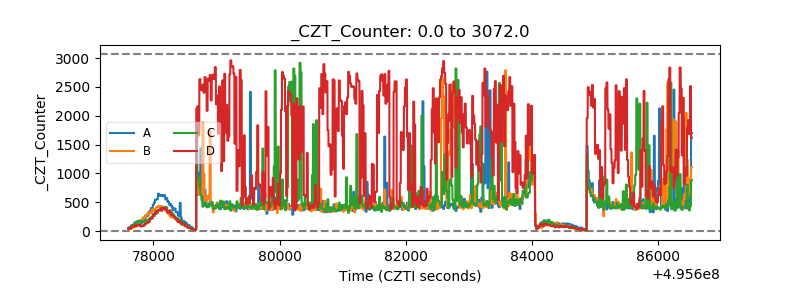 |
| +2.5 Volts monitor |  |
| +5 Volts monitor |  |
| _ROLL_ROT | 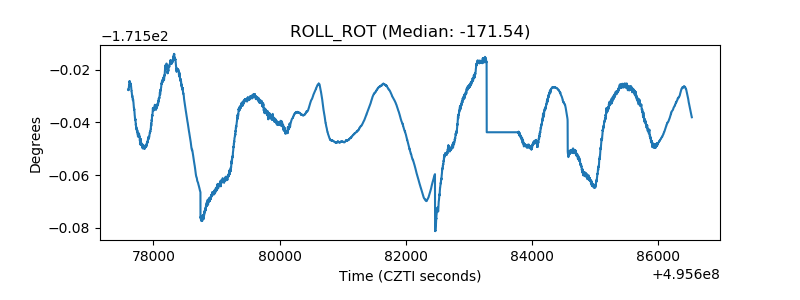 |
| _Roll_DEC | 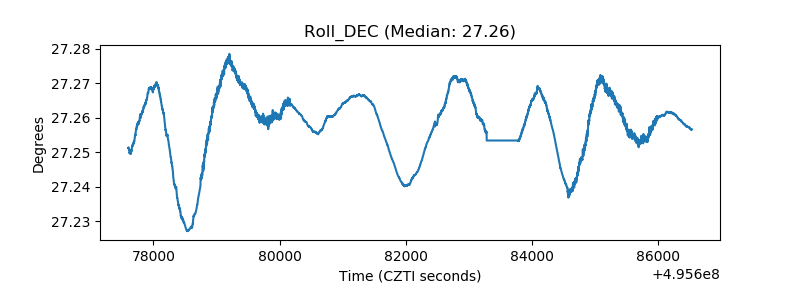 |
| _Roll_RA | 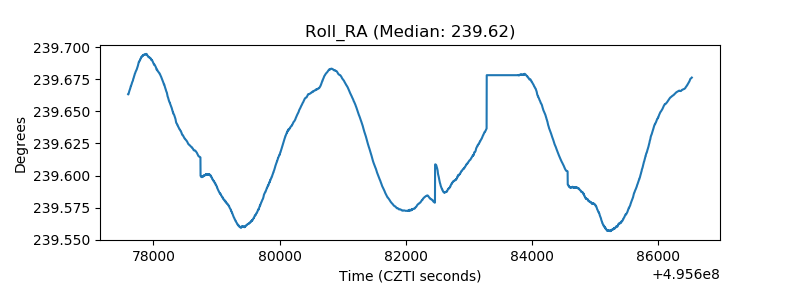 |
| Veto Counter | 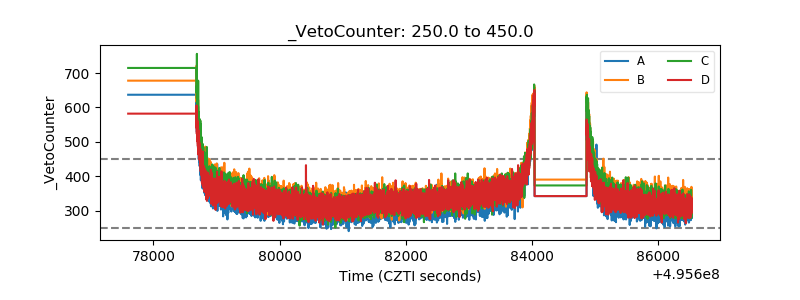 |