| Param | Original file | Final file |
|---|---|---|
| Filename | modeM0/AS1A14_057T04_9000006508_53924cztM0_level2.fits | modeM0/AS1A14_057T04_9000006508_53924cztM0_level2_quad_clean.evt |
| Size (bytes) | 715,714,560 | 104,656,320 |
| Size | 682.6 MB | 99.8 MB |
| Events in quadrant A | 3,987,174 | 732,313 |
| Events in quadrant B | 4,548,169 | 755,745 |
| Events in quadrant C | 6,390,076 | 638,736 |
| Events in quadrant D | 10,959,234 | 496,042 |
| Mode M0 | |||
|---|---|---|---|
| Quadrant | BADHDUFLAG | Total packets | Discarded packets |
| A | 0 | 17460 | 2 |
| B | 0 | 18956 | 2 |
| C | 0 | 24554 | 2 |
| D | 0 | 38018 | 2 |
| Mode SS | |||
|---|---|---|---|
| Quadrant | BADHDUFLAG | Total packets | Discarded packets |
| A | 0 | 162 | 0 |
| B | 0 | 162 | 0 |
| C | 0 | 162 | 0 |
| D | 0 | 162 | 0 |
| Mode M9 | |||
|---|---|---|---|
| Quadrant | BADHDUFLAG | Total packets | Discarded packets |
| A | 0 | 9 | 0 |
| B | 0 | 9 | 0 |
| C | 0 | 9 | 0 |
| D | 0 | 9 | 0 |
| Quadrant | Total seconds | Saturated seconds | Saturation percentage |
|---|---|---|---|
| A | 7846 | 321 | 4.091257% |
| B | 7847 | 579 | 7.378616% |
| C | 7847 | 1118 | 14.247483% |
| D | 7846 | 2340 | 29.824114% |
Noise dominated data is calculated using 1-second bins in cleaned event files. If a bin has >2000 counts, and if more than 50% of those come from <1% of pixels, then it is considered to be noise-dominated and hence unusable.
| Quadrant | # 1 sec bins | Bins with >0 counts | Bins with >2000 counts | High rate bins dominated by noise | Noise dominated (total time) | Noise dominated (detector-on time) | Marked lightcurve |
|---|---|---|---|---|---|---|---|
| A | 8786 | 7846 | 25 | 25 | 0.28% | 0.32% | 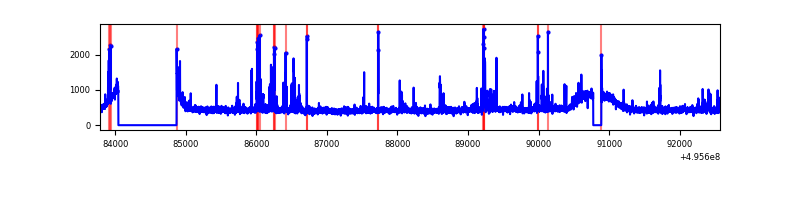 |
| B | 8787 | 7847 | 98 | 98 | 1.12% | 1.25% | 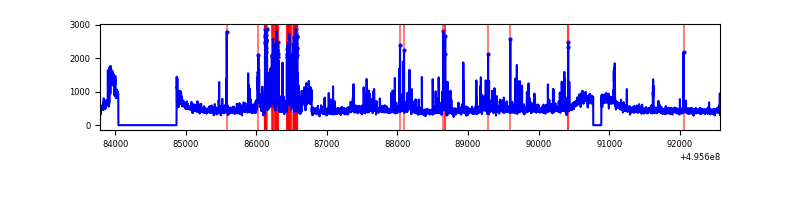 |
| C | 8787 | 7847 | 823 | 823 | 9.37% | 10.49% | 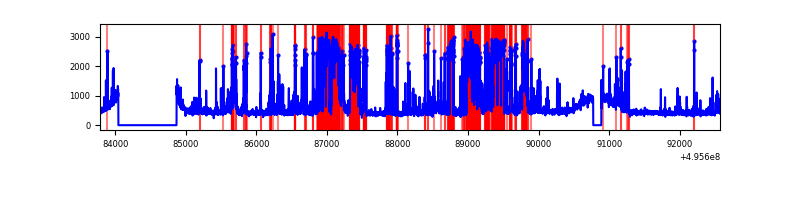 |
| D | 8786 | 7847 | 2150 | 2150 | 24.47% | 27.40% | 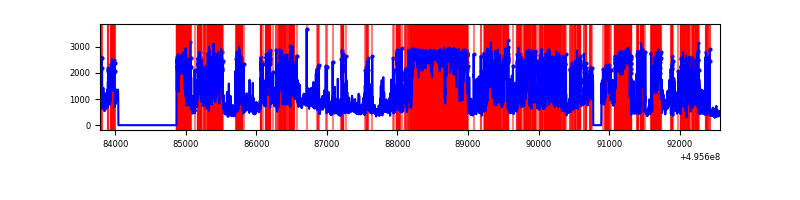 |
Top three noisy pixels from each quadrant. If the there are fewer than three noisy pixels in the level2.evt file, extra rows are filled as -1
| Pixel properties | Quadrant properties | ||||||
|---|---|---|---|---|---|---|---|
| Quadrant | DetID | PixID | Counts | Sigma | Mean | Median | Sigma |
| A | 0 | 8 | 205519 | 925.64 | 907 | 884 | 221.1 |
| A | 15 | 174 | 52015 | 231.28 | 907 | 884 | 221.1 |
| A | 8 | 246 | 41696 | 184.61 | 907 | 884 | 221.1 |
| B | 5 | 236 | 649714 | 3374.16 | 886 | 854 | 192.3 |
| B | 0 | 213 | 217998 | 1129.18 | 886 | 854 | 192.3 |
| B | 5 | 185 | 48726 | 248.94 | 886 | 854 | 192.3 |
| C | 13 | 3 | 2092517 | 9160.89 | 828 | 821 | 228.3 |
| C | 1 | 241 | 606030 | 2650.6 | 828 | 821 | 228.3 |
| C | 12 | 252 | 193160 | 842.38 | 828 | 821 | 228.3 |
| D | 8 | 176 | 6149520 | 29366.17 | 745 | 712 | 209.4 |
| D | 2 | 172 | 702425 | 3351.32 | 745 | 712 | 209.4 |
| D | 3 | 12 | 693803 | 3310.14 | 745 | 712 | 209.4 |
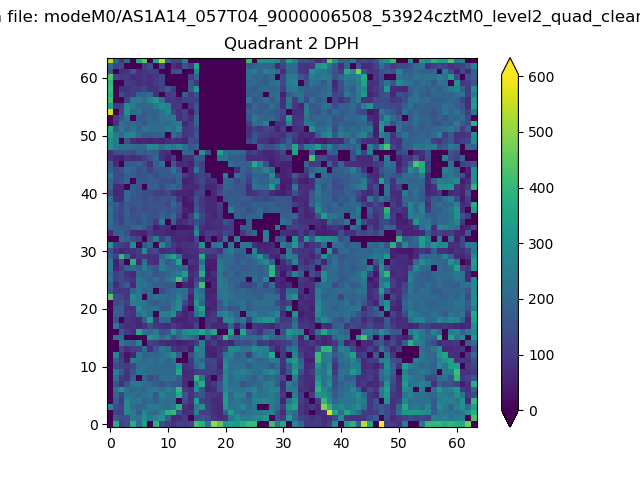
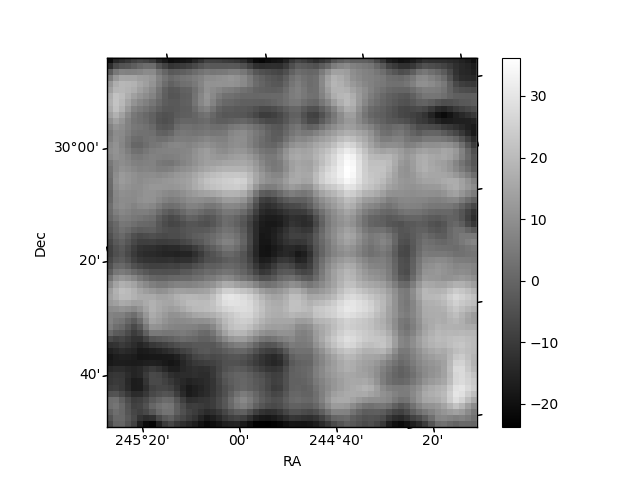
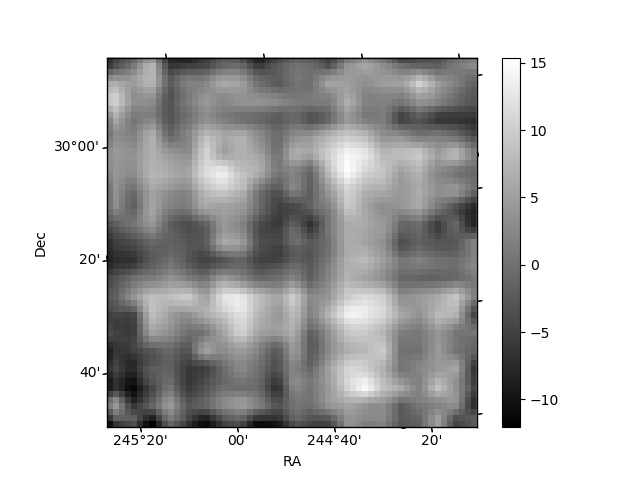
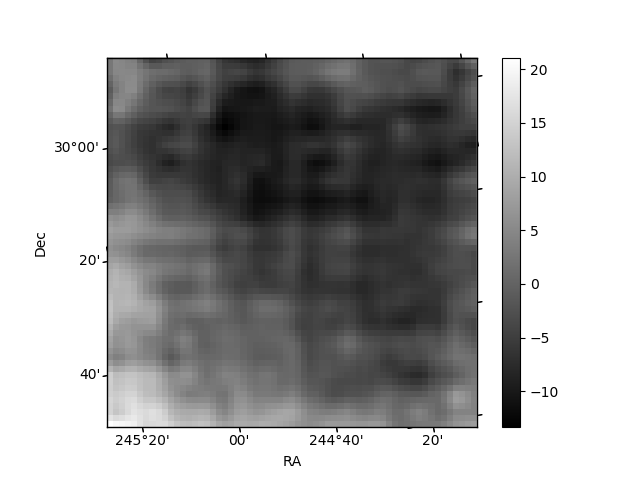
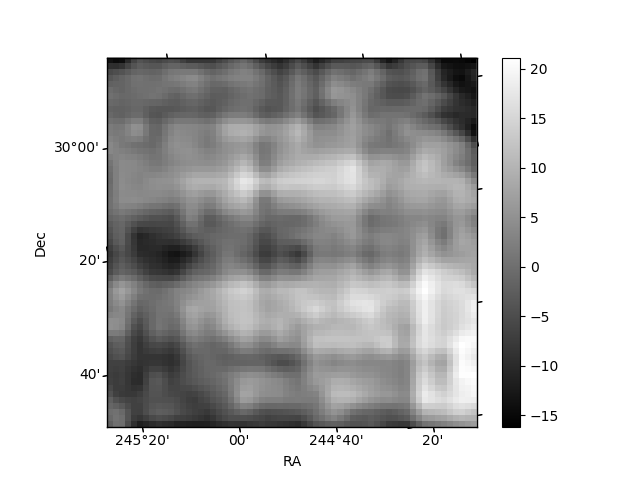
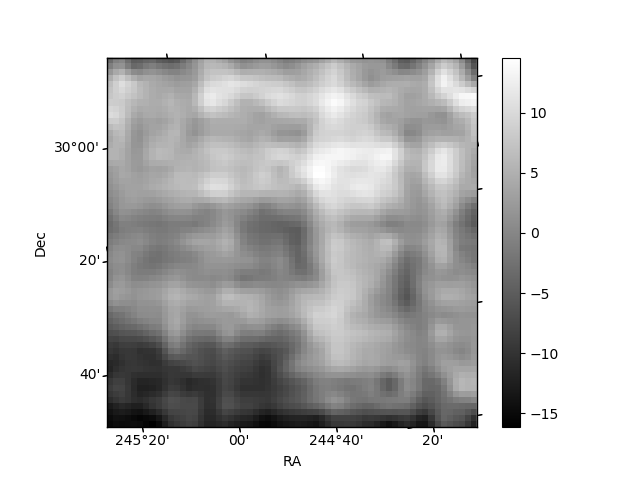
Histogram calculated using DETX and DETY for each event in the final _common_clean file
| Quadrant A | 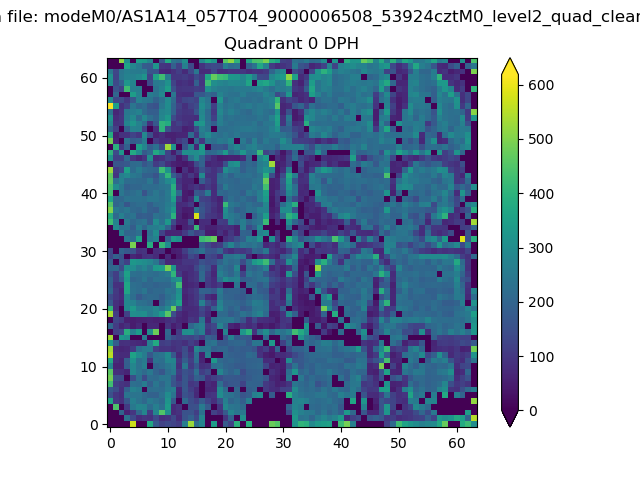 |
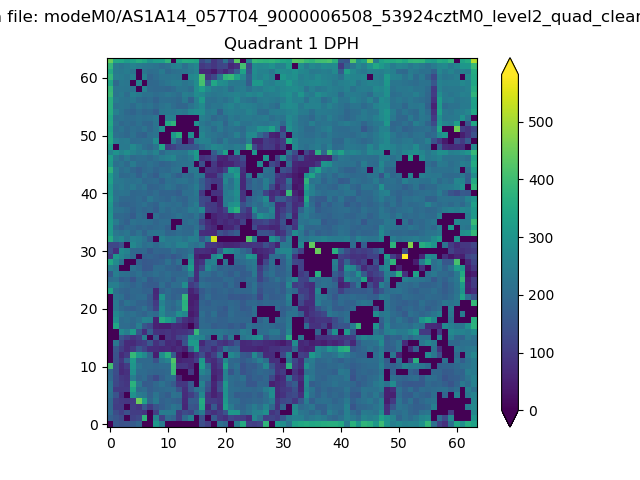 |
Quadrant B |
|---|---|---|---|
| Quadrant D | 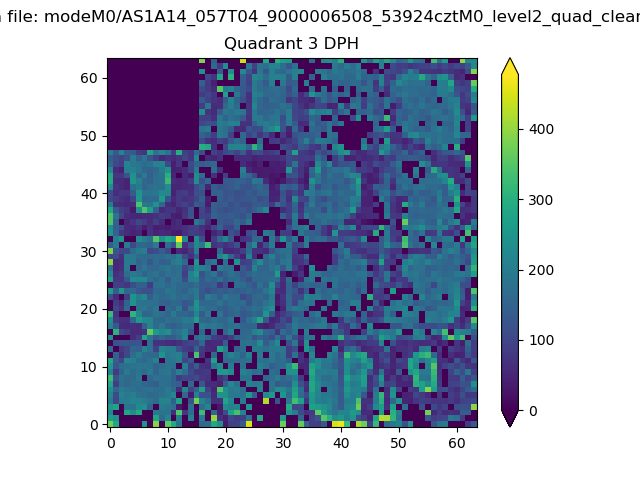 |
 |
Quadrant C |
| Plot type | Count rate plots | Images |
|---|---|---|
| Comparison with Poisson distribution Blue bars denote a histogram of data divided into 1 sec bins. Red curve is a Poisson curve with rate = median count rate of data. |
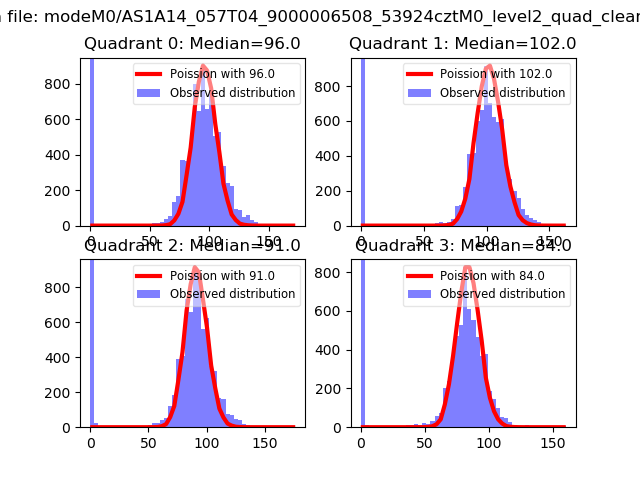 |
 |
| Quadrant-wise count rates Data is divided into 100 sec bins |
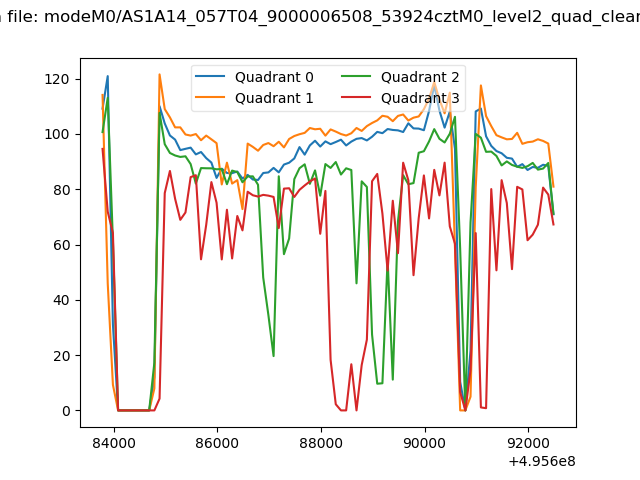 |
|
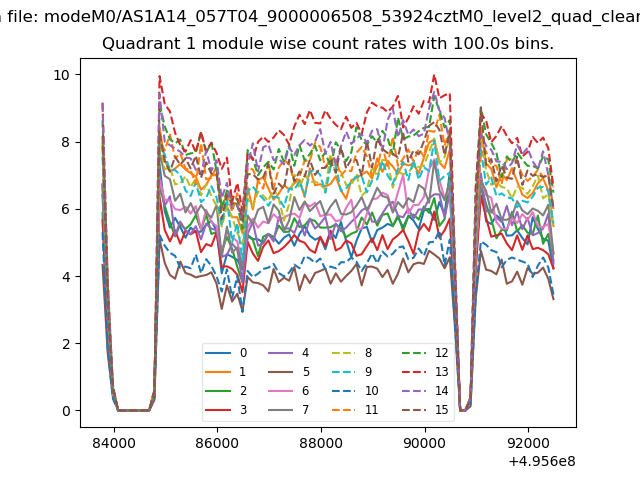
| Module-wise count rates for Quadrant A Data is divided into 100 sec bins |
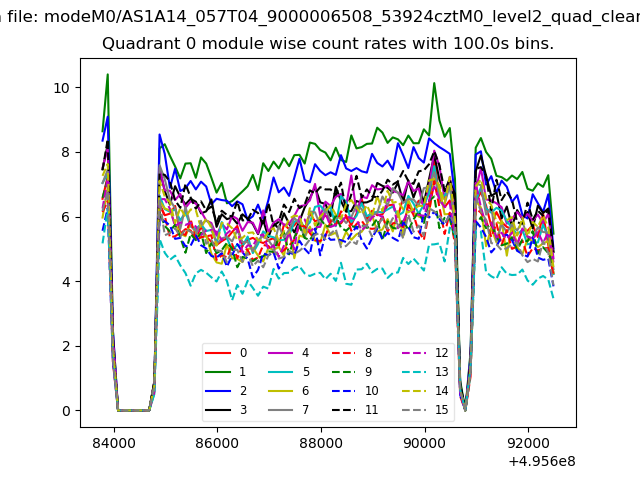 |
 |
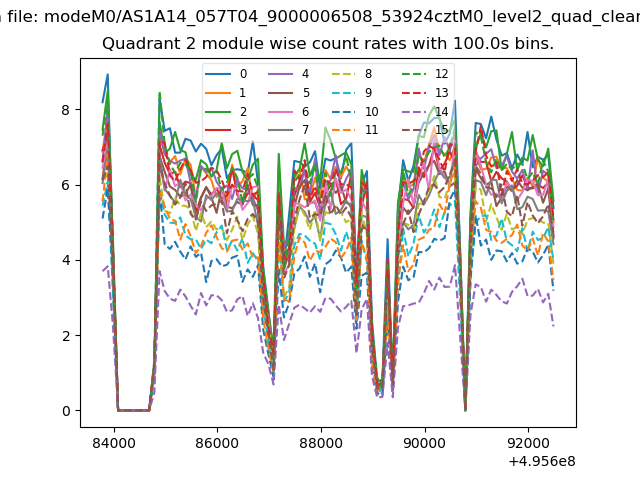
| Module-wise count rates for Quadrant B Data is divided into 100 sec bins |
 |
 |
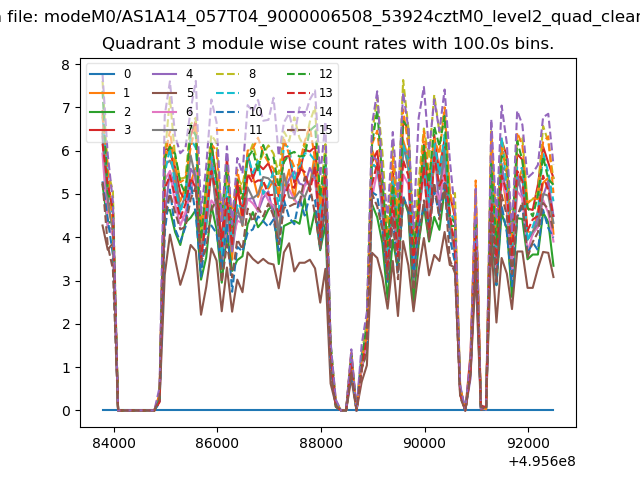
| Module-wise count rates for Quadrant C Data is divided into 100 sec bins |
 |
 |
| Module-wise count rates for Quadrant D Data is divided into 100 sec bins |
 |
 |
| Parameter | Plot |
|---|---|
| CZT HV Monitor | 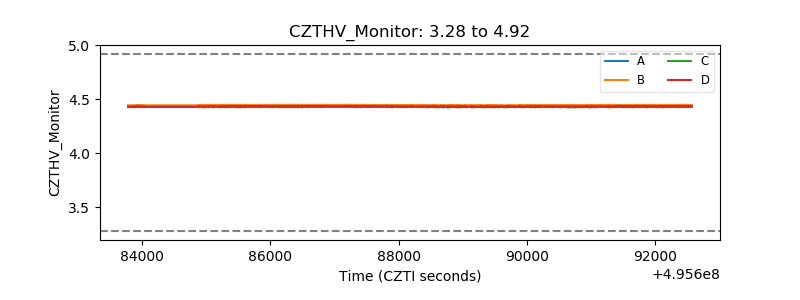 |
| D_VDD | 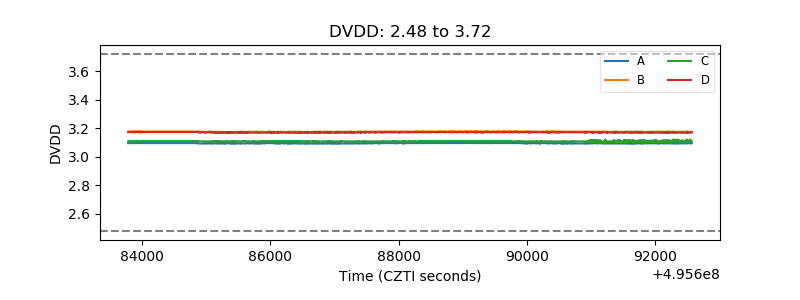 |
| Temperature 1 | 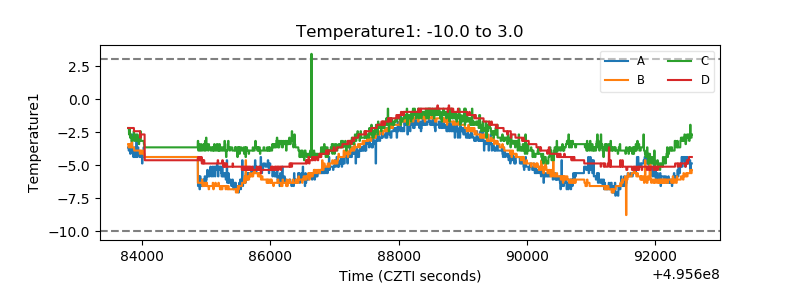 |
| Veto HV Monitor | 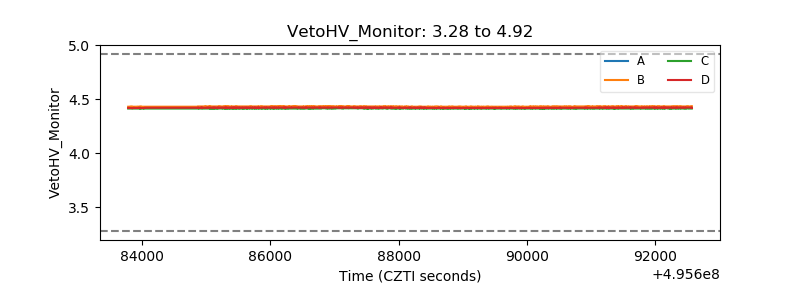 |
| Veto LLD | 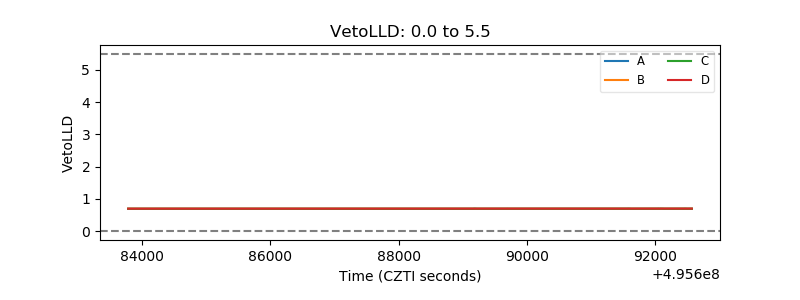 |
| Alpha Counter | 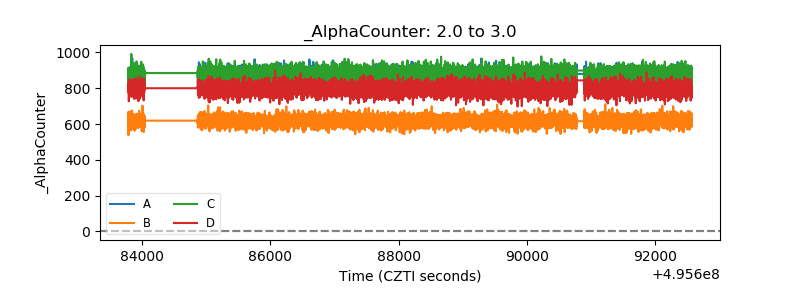 |
| _CPM_Rate | 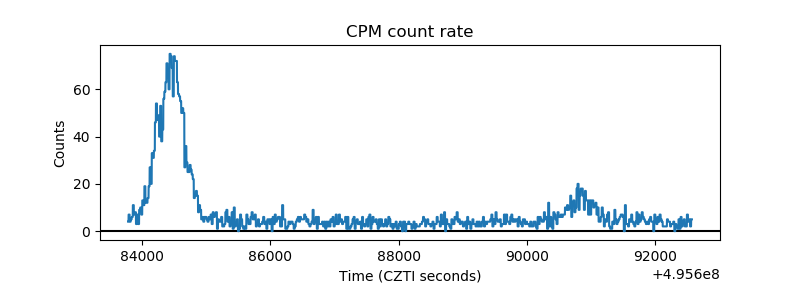 |
| CZT Counter | 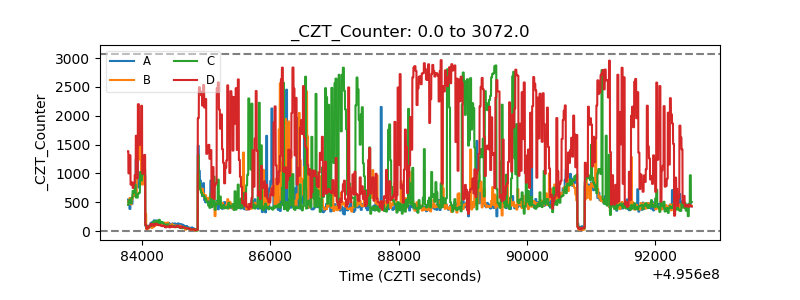 |
| +2.5 Volts monitor | 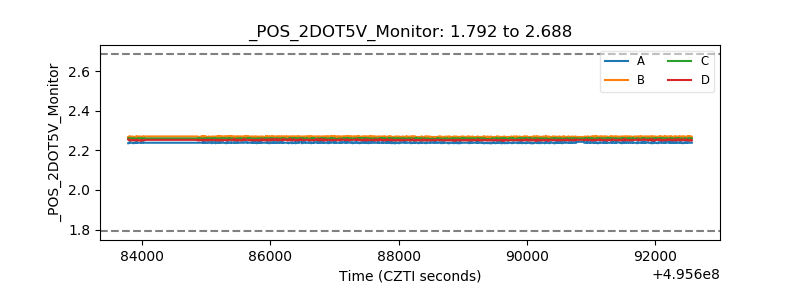 |
| +5 Volts monitor |  |
| _ROLL_ROT | 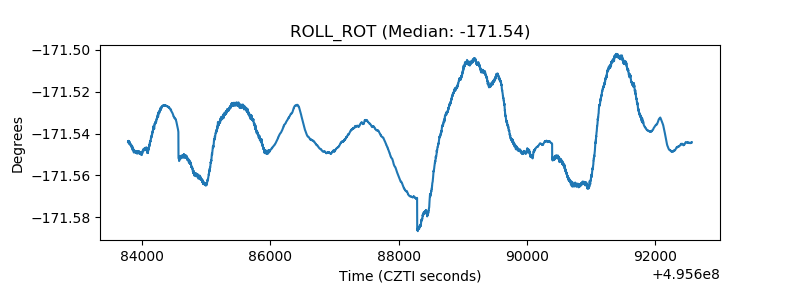 |
| _Roll_DEC | 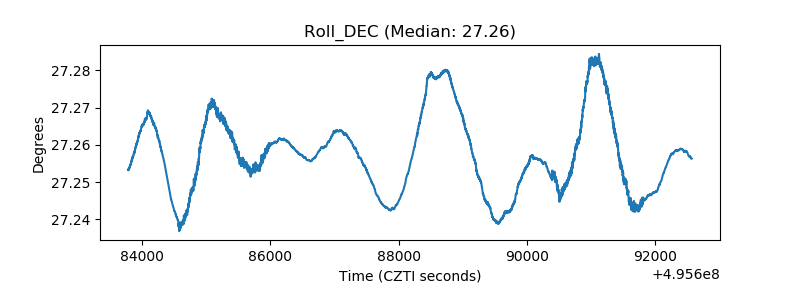 |
| _Roll_RA | 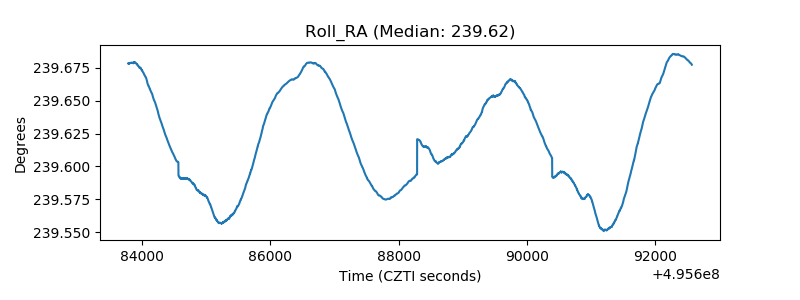 |
| Veto Counter | 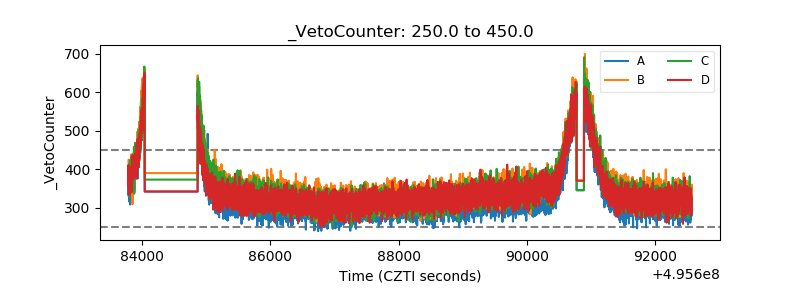 |