| Param | Original file | Final file |
|---|---|---|
| Filename | modeM0/AS1A14_057T04_9000006508_53925cztM0_level2.fits | modeM0/AS1A14_057T04_9000006508_53925cztM0_level2_quad_clean.evt |
| Size (bytes) | 730,134,720 | 118,117,440 |
| Size | 696.3 MB | 112.6 MB |
| Events in quadrant A | 4,586,095 | 812,912 |
| Events in quadrant B | 4,642,606 | 841,263 |
| Events in quadrant C | 5,941,045 | 747,249 |
| Events in quadrant D | 11,177,636 | 566,784 |
| Mode M0 | |||
|---|---|---|---|
| Quadrant | BADHDUFLAG | Total packets | Discarded packets |
| A | 0 | 19692 | 1 |
| B | 0 | 20004 | 1 |
| C | 0 | 23999 | 1 |
| D | 0 | 39321 | 1 |
| Mode SS | |||
|---|---|---|---|
| Quadrant | BADHDUFLAG | Total packets | Discarded packets |
| A | 0 | 176 | 0 |
| B | 0 | 176 | 0 |
| C | 0 | 176 | 0 |
| D | 0 | 176 | 0 |
| Mode M9 | |||
|---|---|---|---|
| Quadrant | BADHDUFLAG | Total packets | Discarded packets |
| A | 0 | 1 | 0 |
| B | 0 | 1 | 0 |
| C | 0 | 1 | 0 |
| D | 0 | 1 | 0 |
| Quadrant | Total seconds | Saturated seconds | Saturation percentage |
|---|---|---|---|
| A | 8760 | 318 | 3.630137% |
| B | 8761 | 550 | 6.277822% |
| C | 8761 | 724 | 8.263897% |
| D | 8760 | 2399 | 27.385845% |
Noise dominated data is calculated using 1-second bins in cleaned event files. If a bin has >2000 counts, and if more than 50% of those come from <1% of pixels, then it is considered to be noise-dominated and hence unusable.
| Quadrant | # 1 sec bins | Bins with >0 counts | Bins with >2000 counts | High rate bins dominated by noise | Noise dominated (total time) | Noise dominated (detector-on time) | Marked lightcurve |
|---|---|---|---|---|---|---|---|
| A | 8875 | 8760 | 85 | 85 | 0.96% | 0.97% | 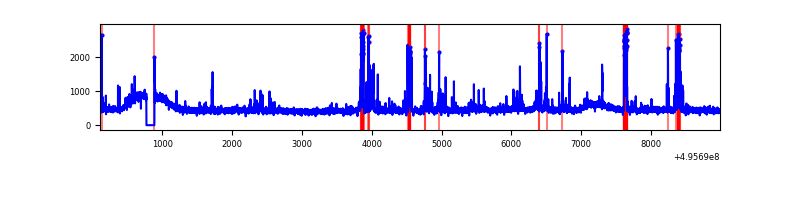 |
| B | 8876 | 8761 | 155 | 155 | 1.75% | 1.77% | 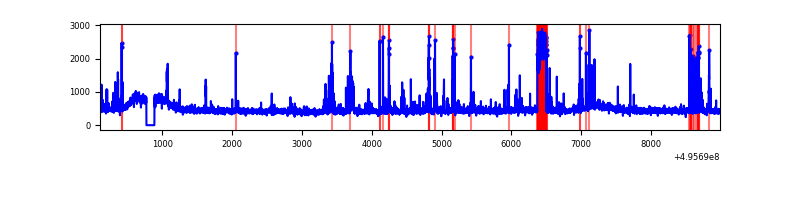 |
| C | 8876 | 8761 | 583 | 583 | 6.57% | 6.65% | 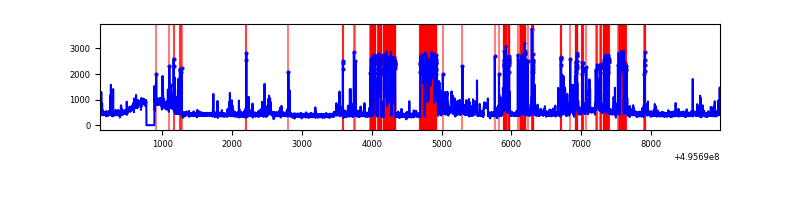 |
| D | 8875 | 8760 | 2251 | 2251 | 25.36% | 25.70% | 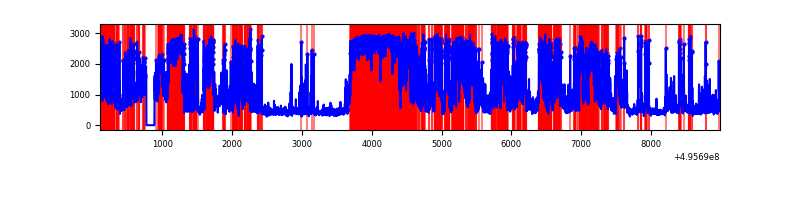 |
Top three noisy pixels from each quadrant. If the there are fewer than three noisy pixels in the level2.evt file, extra rows are filled as -1
| Pixel properties | Quadrant properties | ||||||
|---|---|---|---|---|---|---|---|
| Quadrant | DetID | PixID | Counts | Sigma | Mean | Median | Sigma |
| A | 0 | 8 | 273077 | 1138.15 | 992 | 966 | 239.1 |
| A | 15 | 174 | 196263 | 816.86 | 992 | 966 | 239.1 |
| A | 7 | 14 | 39031 | 159.21 | 992 | 966 | 239.1 |
| B | 5 | 236 | 437715 | 2133.05 | 967 | 933 | 204.8 |
| B | 0 | 213 | 88733 | 428.78 | 967 | 933 | 204.8 |
| B | 0 | 153 | 57045 | 274.03 | 967 | 933 | 204.8 |
| C | 9 | 53 | 1047374 | 4013.47 | 950 | 942 | 260.7 |
| C | 1 | 241 | 692375 | 2651.91 | 950 | 942 | 260.7 |
| C | 13 | 3 | 221633 | 846.44 | 950 | 942 | 260.7 |
| D | 8 | 176 | 6034490 | 25764.68 | 840 | 804 | 234.2 |
| D | 3 | 12 | 1080559 | 4610.7 | 840 | 804 | 234.2 |
| D | 6 | 239 | 320642 | 1365.75 | 840 | 804 | 234.2 |
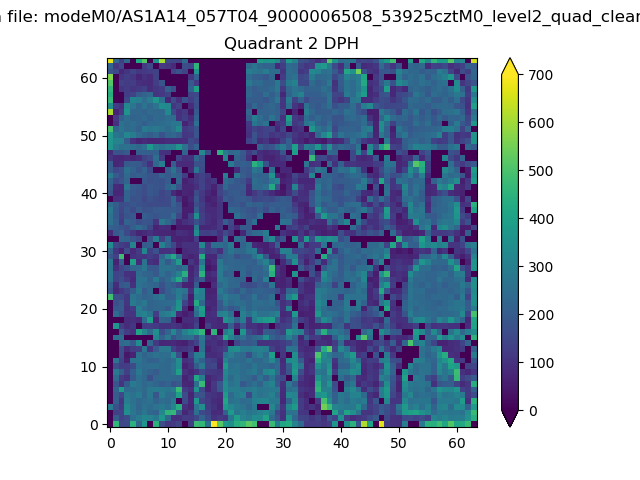
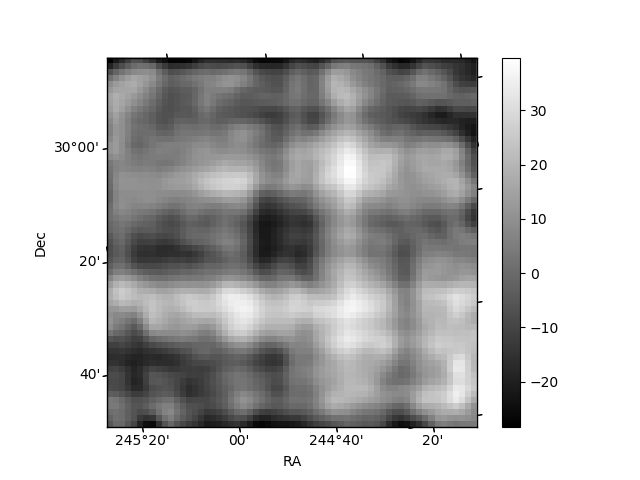
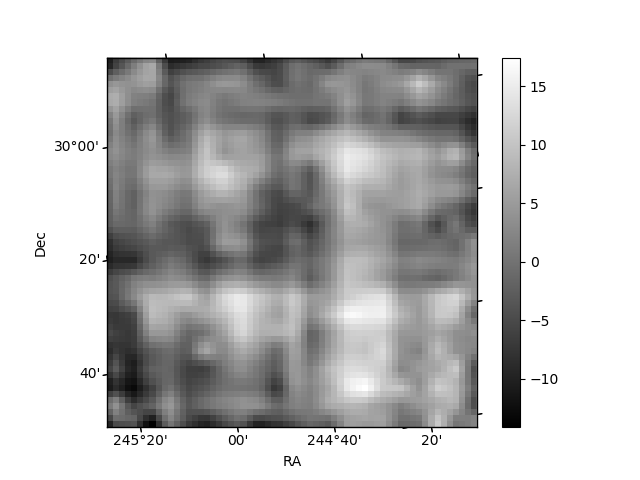
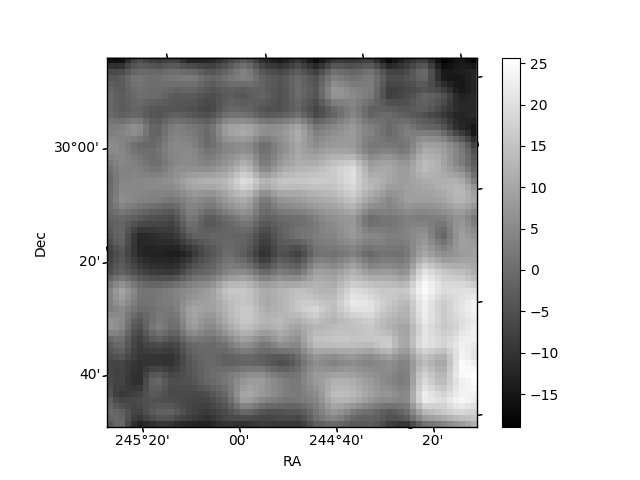
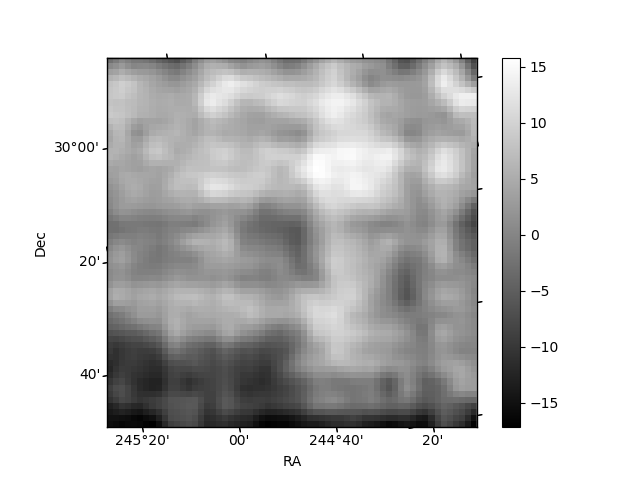
Histogram calculated using DETX and DETY for each event in the final _common_clean file
| Quadrant A | 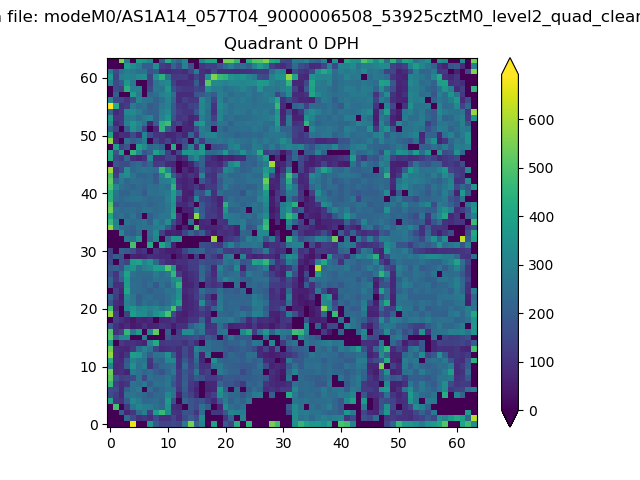 |
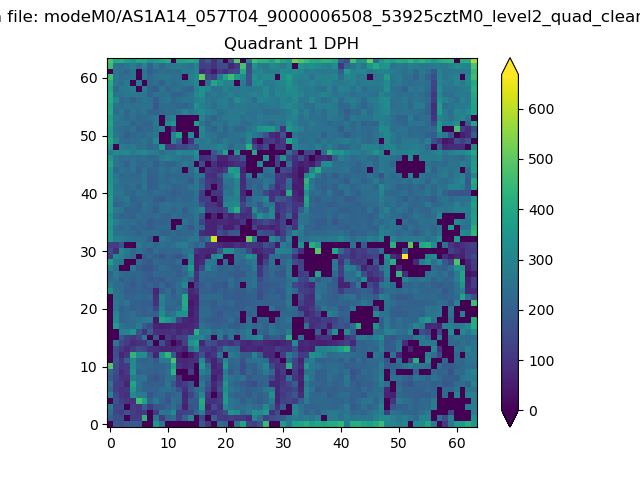 |
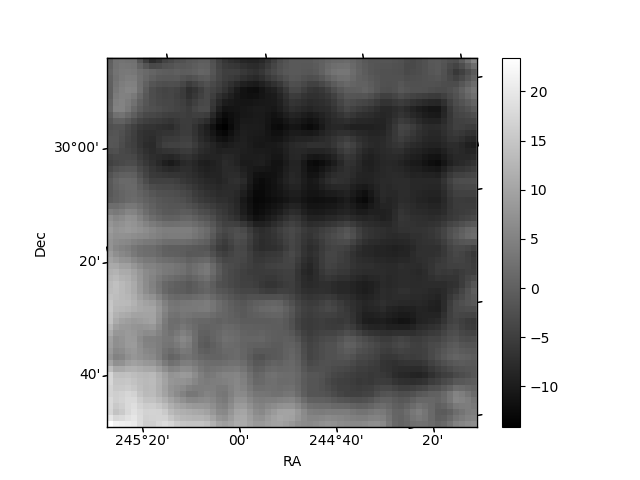
Quadrant B |
|---|---|---|---|
| Quadrant D | 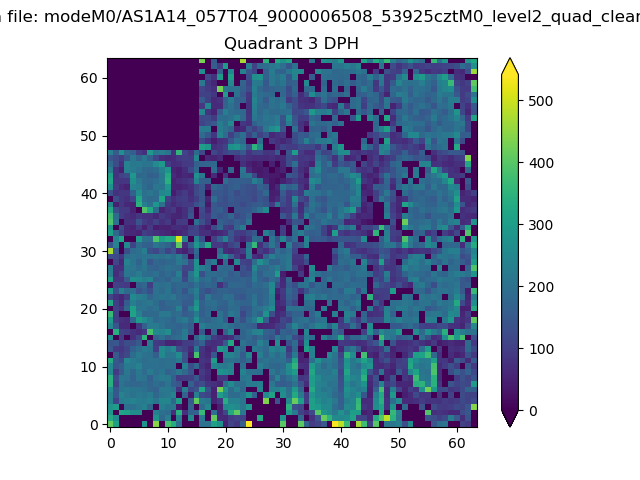 |
 |
Quadrant C |
| Plot type | Count rate plots | Images |
|---|---|---|
| Comparison with Poisson distribution Blue bars denote a histogram of data divided into 1 sec bins. Red curve is a Poisson curve with rate = median count rate of data. |
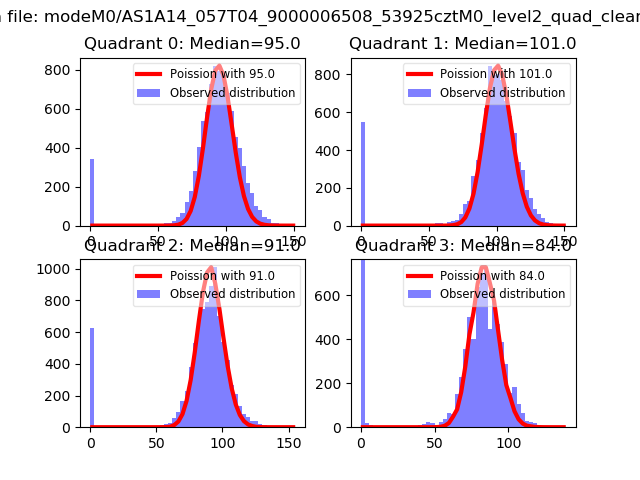 |
 |
| Quadrant-wise count rates Data is divided into 100 sec bins |
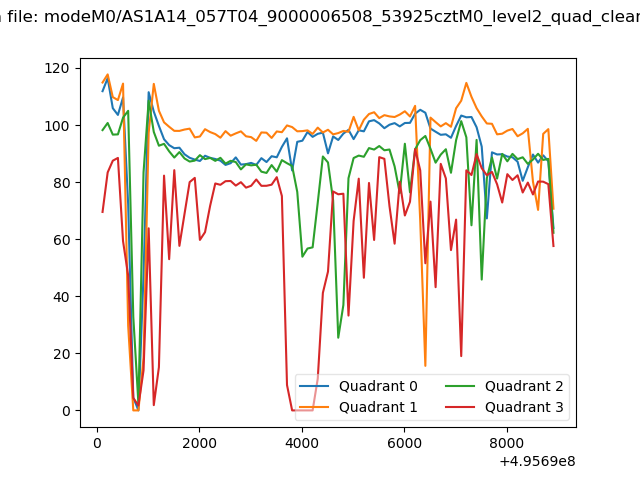 |
|
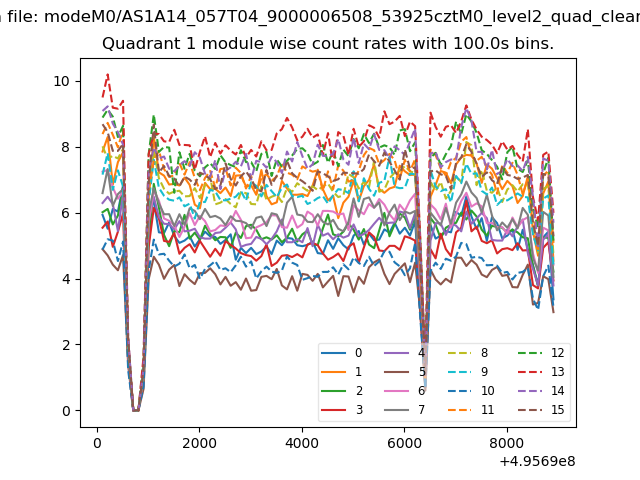
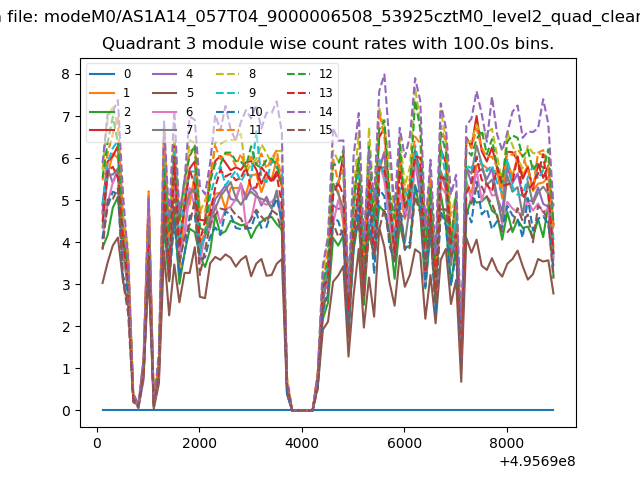
| Module-wise count rates for Quadrant A Data is divided into 100 sec bins |
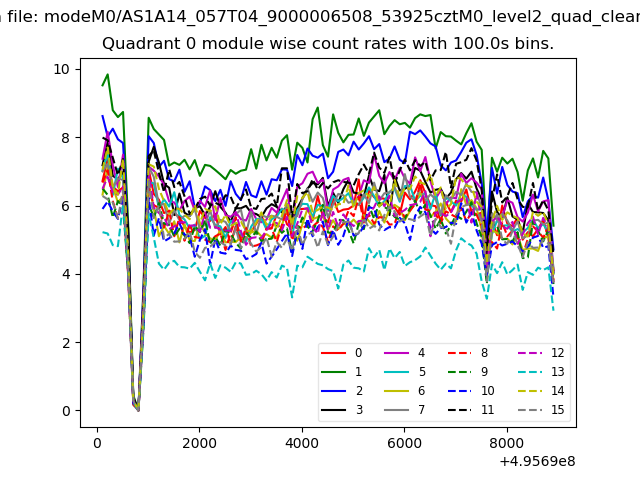 |
 |
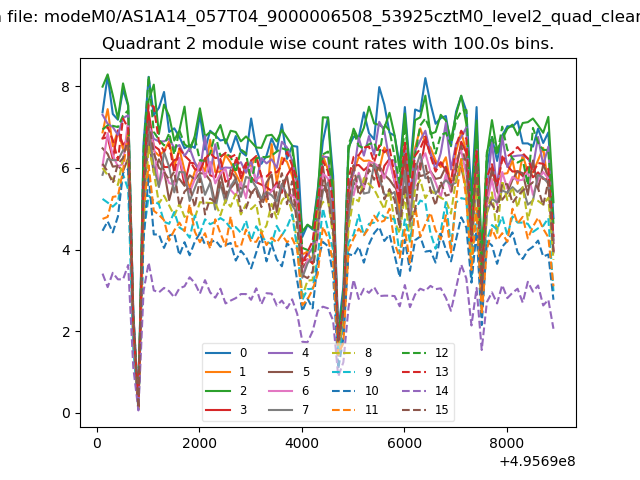
| Module-wise count rates for Quadrant B Data is divided into 100 sec bins |
 |
 |
| Module-wise count rates for Quadrant C Data is divided into 100 sec bins |
 |
 |
| Module-wise count rates for Quadrant D Data is divided into 100 sec bins |
 |
 |
| Parameter | Plot |
|---|---|
| CZT HV Monitor | 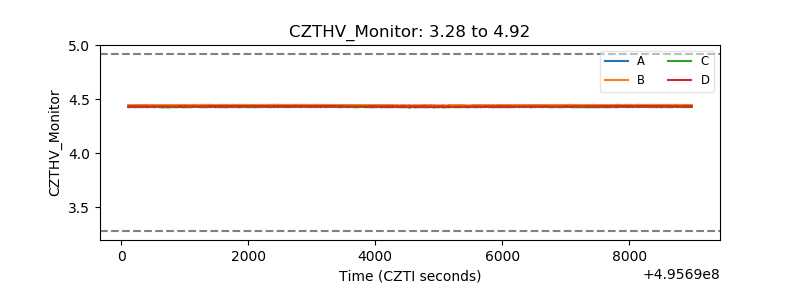 |
| D_VDD | 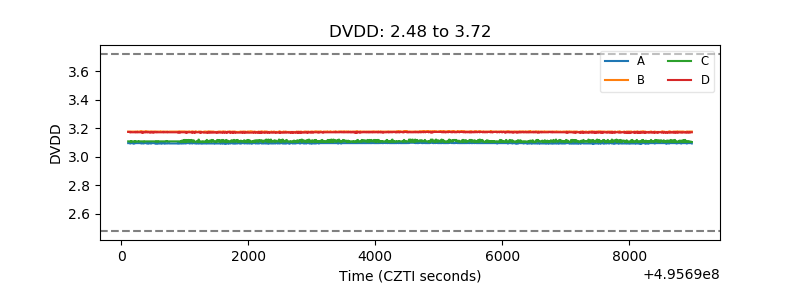 |
| Temperature 1 | 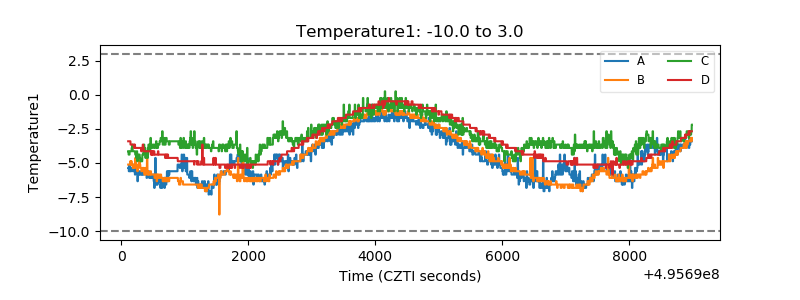 |
| Veto HV Monitor | 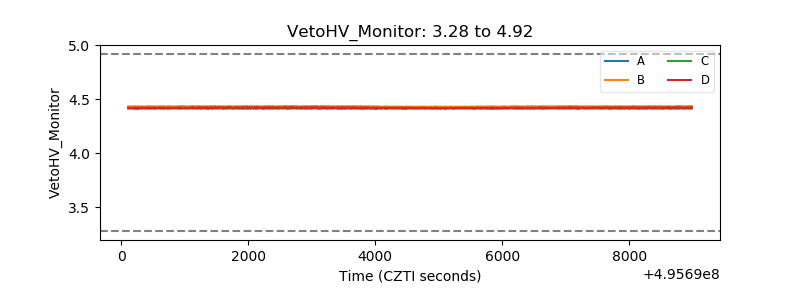 |
| Veto LLD | 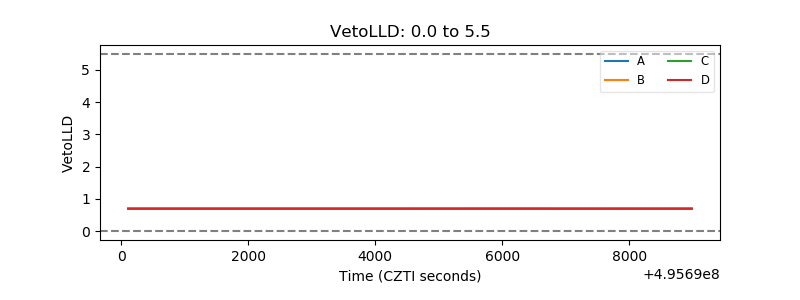 |
| Alpha Counter | 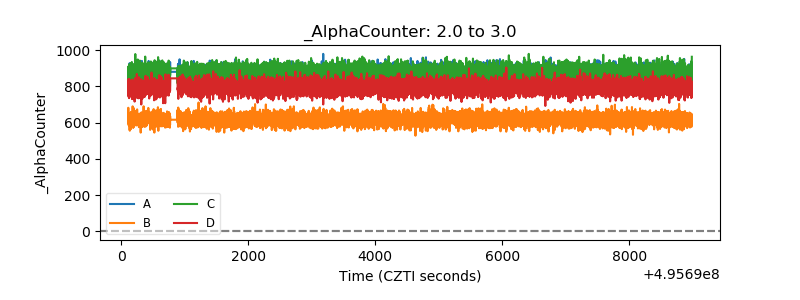 |
| _CPM_Rate | 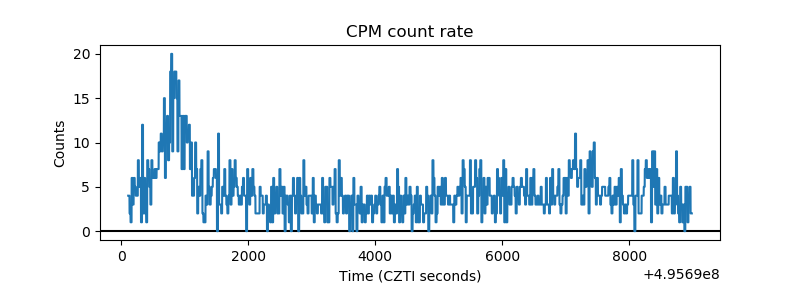 |
| CZT Counter | 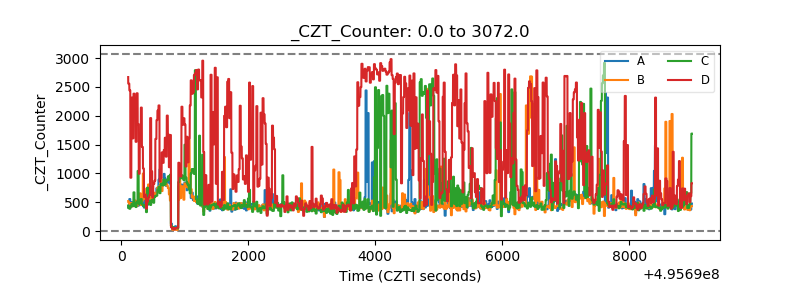 |
| +2.5 Volts monitor |  |
| +5 Volts monitor | 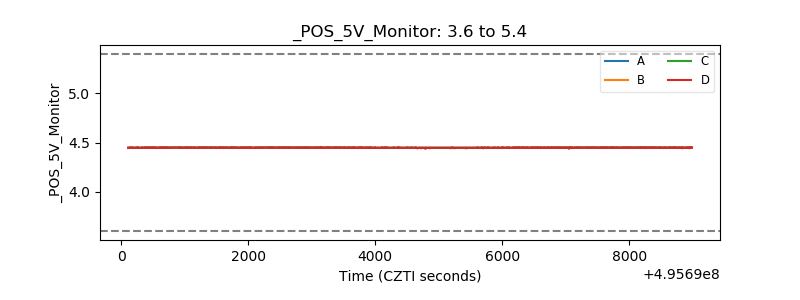 |
| _ROLL_ROT | 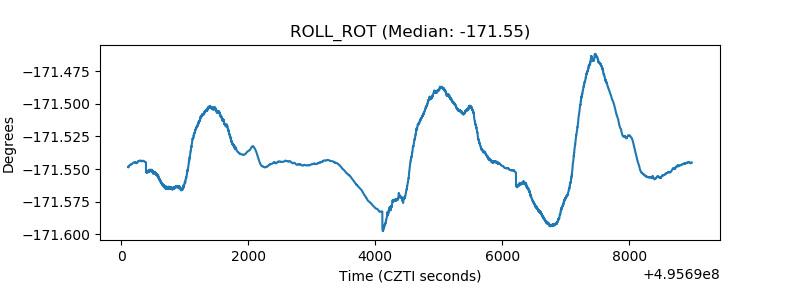 |
| _Roll_DEC | 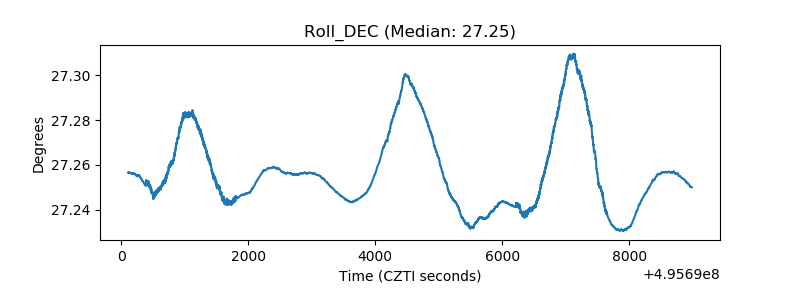 |
| _Roll_RA | 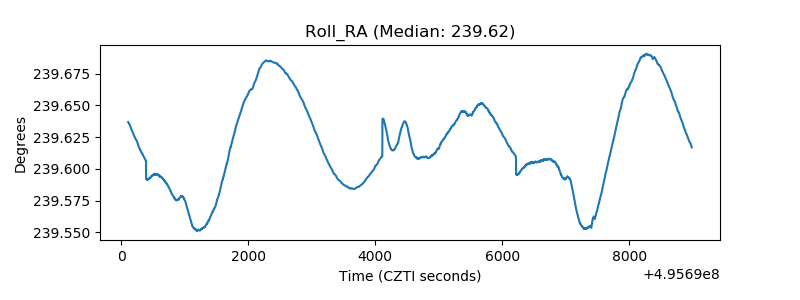 |
| Veto Counter | 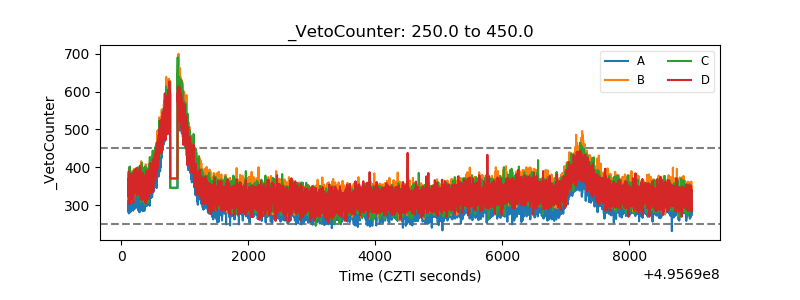 |