| Param | Original file | Final file |
|---|---|---|
| Filename | modeM0/AS1A14_057T04_9000006508_53926cztM0_level2.fits | modeM0/AS1A14_057T04_9000006508_53926cztM0_level2_quad_clean.evt |
| Size (bytes) | 539,746,560 | 108,149,760 |
| Size | 514.7 MB | 103.1 MB |
| Events in quadrant A | 4,163,437 | 706,542 |
| Events in quadrant B | 4,000,167 | 761,079 |
| Events in quadrant C | 3,728,774 | 682,870 |
| Events in quadrant D | 7,492,688 | 591,264 |
| Mode M0 | |||
|---|---|---|---|
| Quadrant | BADHDUFLAG | Total packets | Discarded packets |
| A | 0 | 17618 | 0 |
| B | 0 | 17262 | 0 |
| C | 0 | 16760 | 0 |
| D | 0 | 27541 | 0 |
| Mode SS | |||
|---|---|---|---|
| Quadrant | BADHDUFLAG | Total packets | Discarded packets |
| A | 0 | 154 | 0 |
| B | 0 | 154 | 0 |
| C | 0 | 154 | 0 |
| D | 0 | 154 | 0 |
| Quadrant | Total seconds | Saturated seconds | Saturation percentage |
|---|---|---|---|
| A | 7656 | 180 | 2.351097% |
| B | 7656 | 140 | 1.828631% |
| C | 7656 | 84 | 1.097179% |
| D | 7657 | 843 | 11.009534% |
Noise dominated data is calculated using 1-second bins in cleaned event files. If a bin has >2000 counts, and if more than 50% of those come from <1% of pixels, then it is considered to be noise-dominated and hence unusable.
| Quadrant | # 1 sec bins | Bins with >0 counts | Bins with >2000 counts | High rate bins dominated by noise | Noise dominated (total time) | Noise dominated (detector-on time) | Marked lightcurve |
|---|---|---|---|---|---|---|---|
| A | 7656 | 7656 | 163 | 163 | 2.13% | 2.13% | 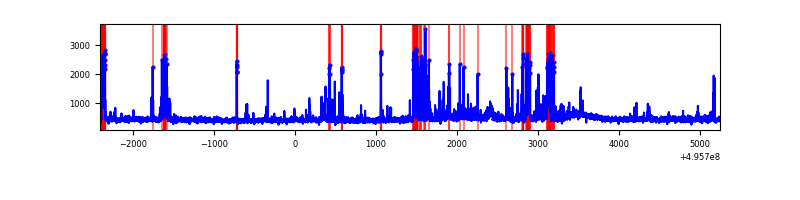 |
| B | 7656 | 7656 | 66 | 66 | 0.86% | 0.86% | 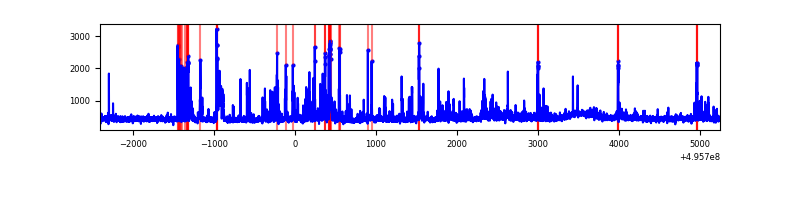 |
| C | 7656 | 7656 | 69 | 69 | 0.90% | 0.90% | 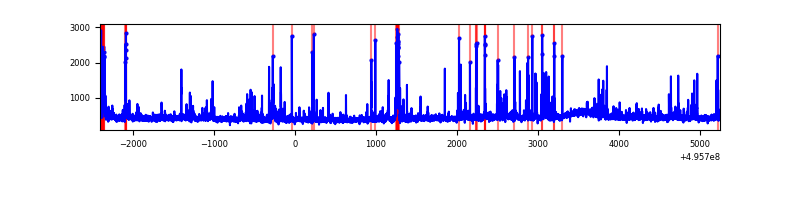 |
| D | 7657 | 7657 | 903 | 903 | 11.79% | 11.79% | 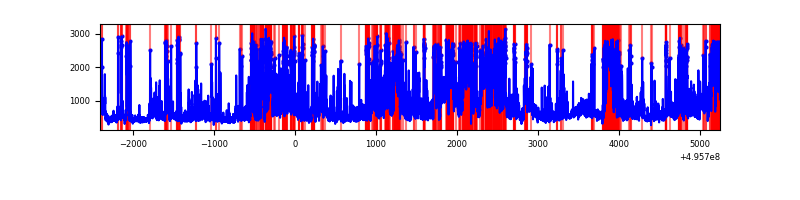 |
Top three noisy pixels from each quadrant. If the there are fewer than three noisy pixels in the level2.evt file, extra rows are filled as -1
| Pixel properties | Quadrant properties | ||||||
|---|---|---|---|---|---|---|---|
| Quadrant | DetID | PixID | Counts | Sigma | Mean | Median | Sigma |
| A | 0 | 8 | 558085 | 2779.66 | 821 | 803 | 200.5 |
| A | 4 | 254 | 84347 | 416.71 | 821 | 803 | 200.5 |
| A | 15 | 174 | 53336 | 262.03 | 821 | 803 | 200.5 |
| B | 5 | 236 | 356688 | 2033.72 | 813 | 782 | 175.0 |
| B | 0 | 213 | 138638 | 787.74 | 813 | 782 | 175.0 |
| B | 5 | 185 | 62867 | 354.77 | 813 | 782 | 175.0 |
| C | 13 | 3 | 195119 | 880.8 | 799 | 793 | 220.6 |
| C | 12 | 252 | 137983 | 621.83 | 799 | 793 | 220.6 |
| C | 12 | 2 | 60659 | 271.35 | 799 | 793 | 220.6 |
| D | 8 | 176 | 2227503 | 10209.34 | 763 | 730 | 218.1 |
| D | 2 | 172 | 833692 | 3818.97 | 763 | 730 | 218.1 |
| D | 3 | 12 | 513082 | 2349.04 | 763 | 730 | 218.1 |
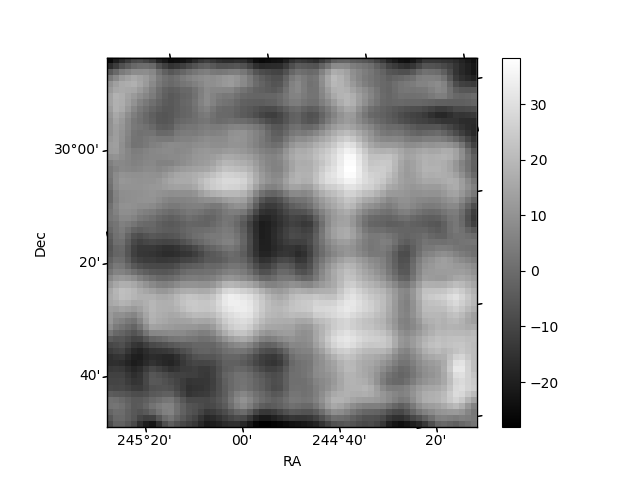
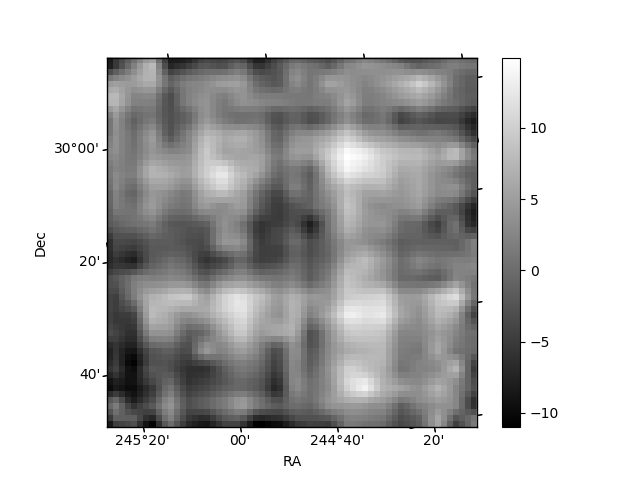
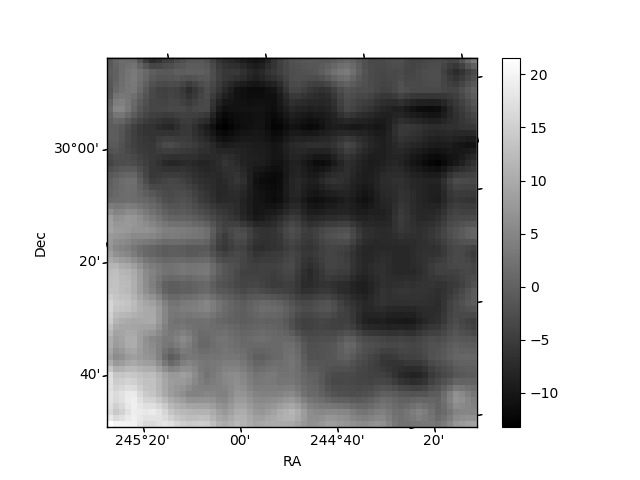
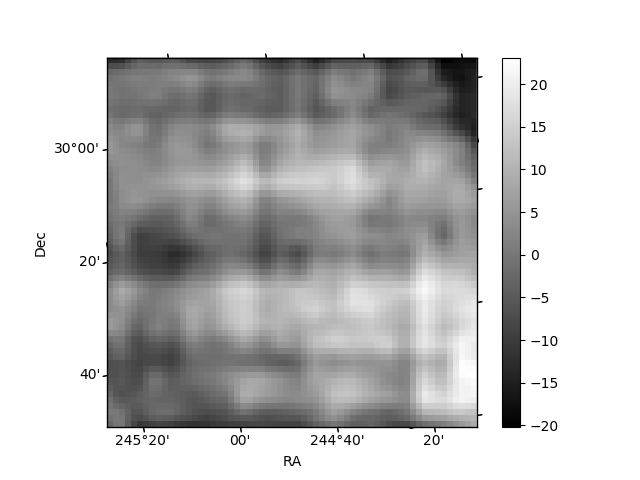
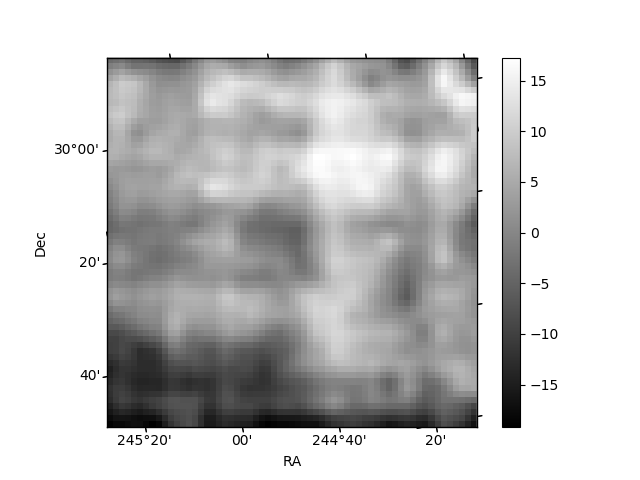
Histogram calculated using DETX and DETY for each event in the final _common_clean file
| Quadrant A | 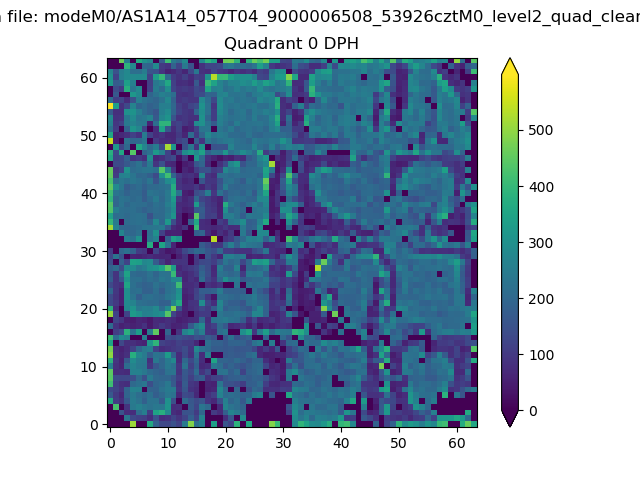 |
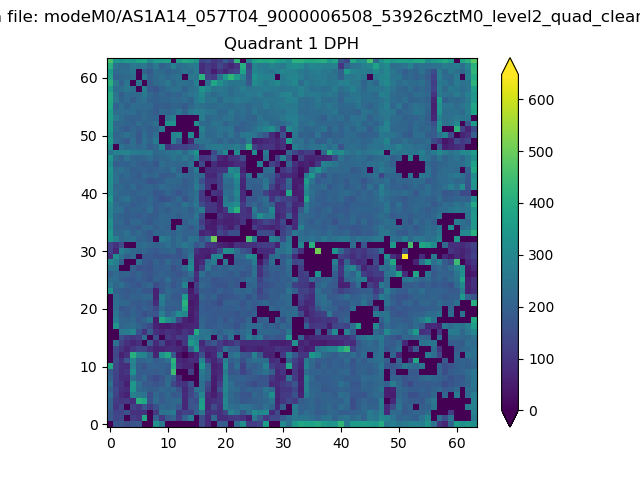 |
Quadrant B |
|---|---|---|---|
| Quadrant D | 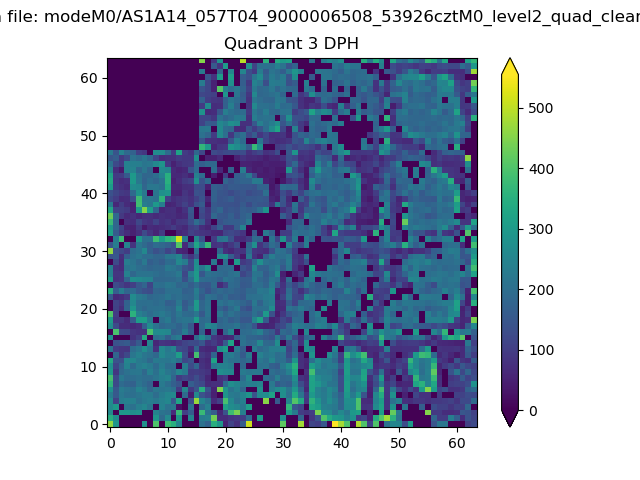 |
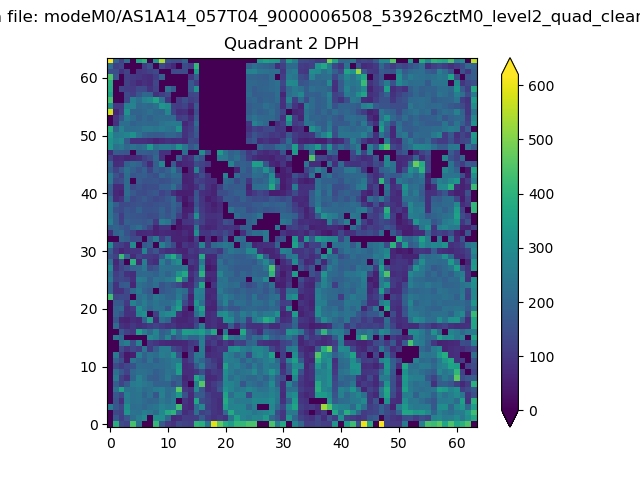 |
Quadrant C |
| Plot type | Count rate plots | Images |
|---|---|---|
| Comparison with Poisson distribution Blue bars denote a histogram of data divided into 1 sec bins. Red curve is a Poisson curve with rate = median count rate of data. |
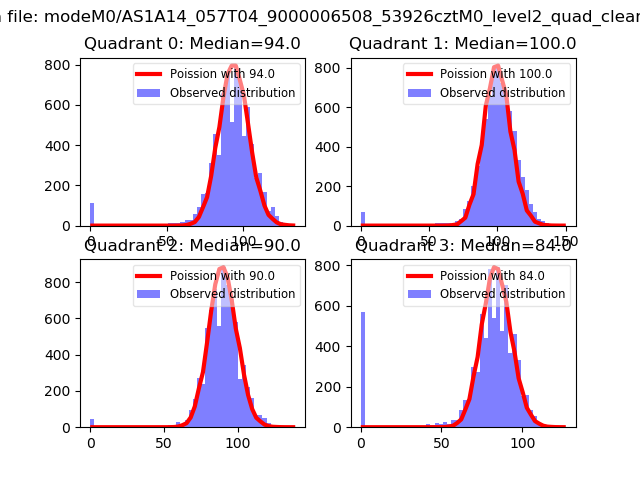 |
 |
| Quadrant-wise count rates Data is divided into 100 sec bins |
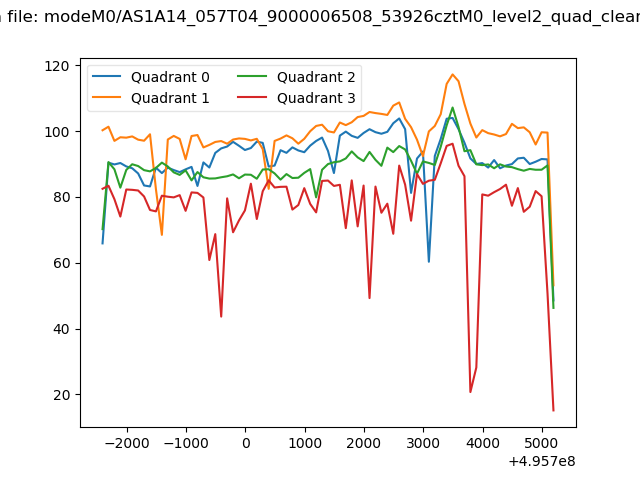 |
|
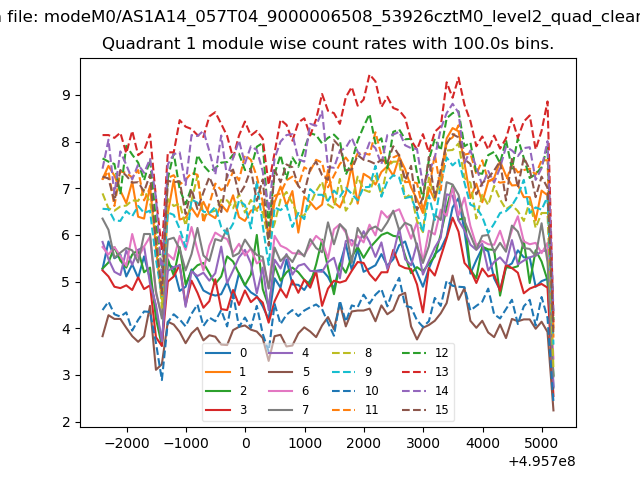
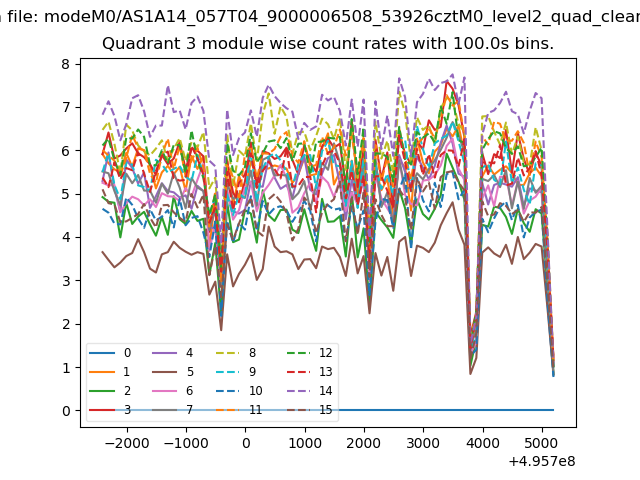
| Module-wise count rates for Quadrant A Data is divided into 100 sec bins |
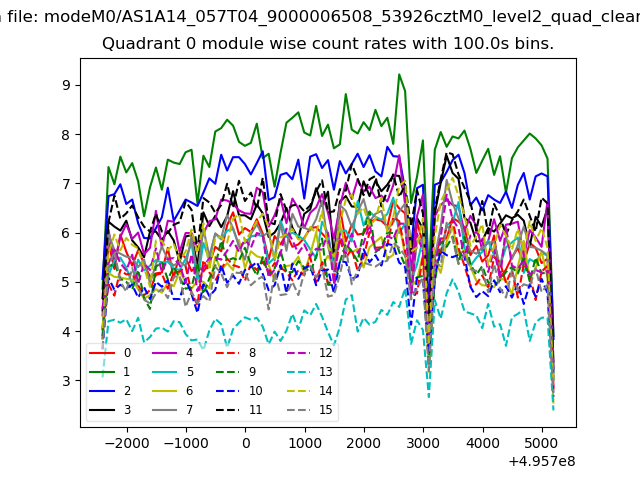 |
 |
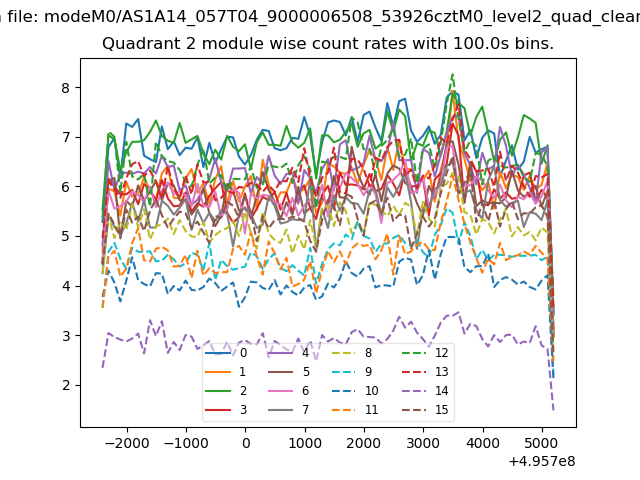
| Module-wise count rates for Quadrant B Data is divided into 100 sec bins |
 |
 |
| Module-wise count rates for Quadrant C Data is divided into 100 sec bins |
 |
 |
| Module-wise count rates for Quadrant D Data is divided into 100 sec bins |
 |
 |
| Parameter | Plot |
|---|---|
| CZT HV Monitor | 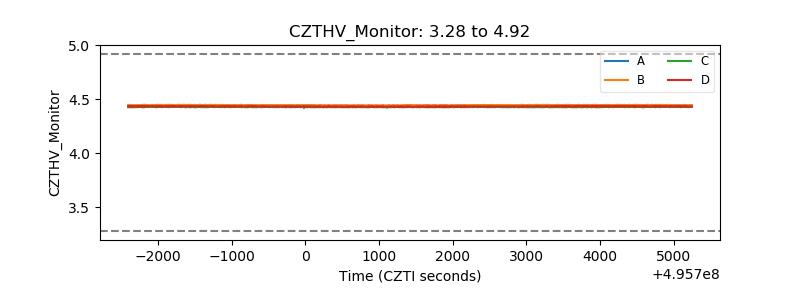 |
| D_VDD | 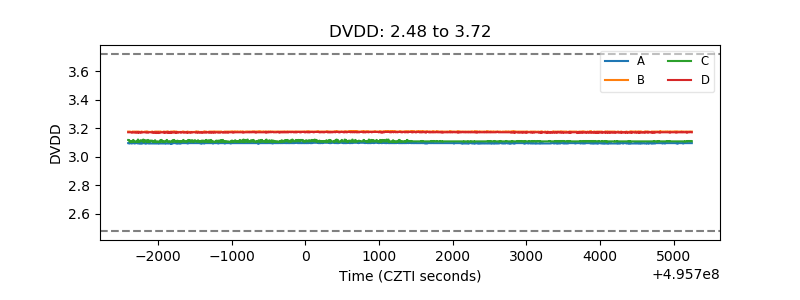 |
| Temperature 1 | 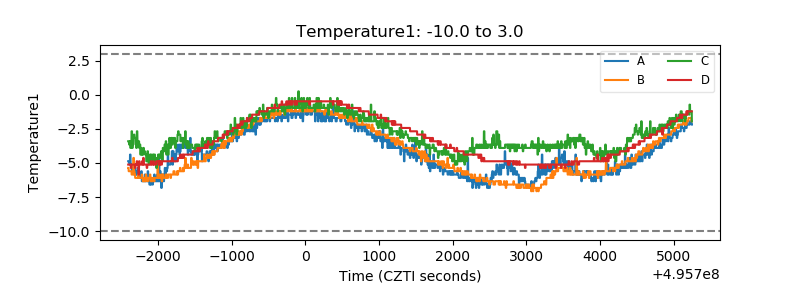 |
| Veto HV Monitor | 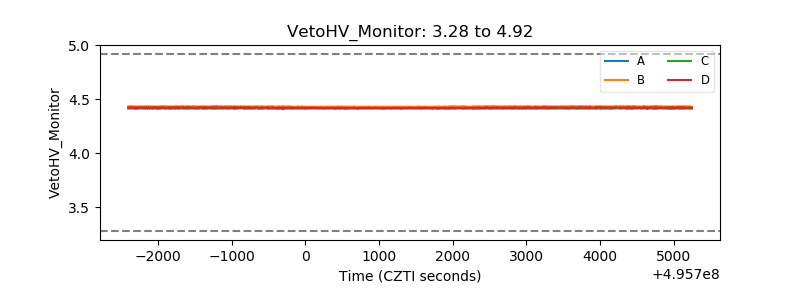 |
| Veto LLD | 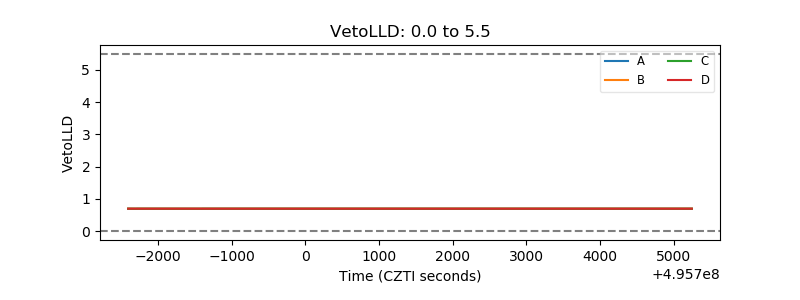 |
| Alpha Counter | 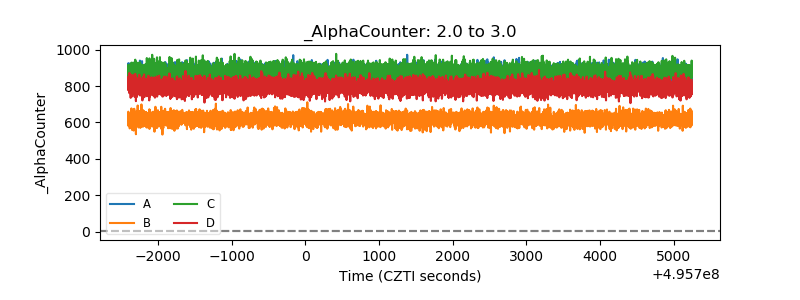 |
| _CPM_Rate | 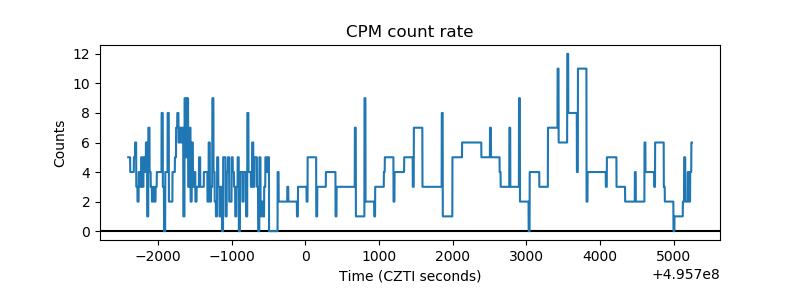 |
| CZT Counter | 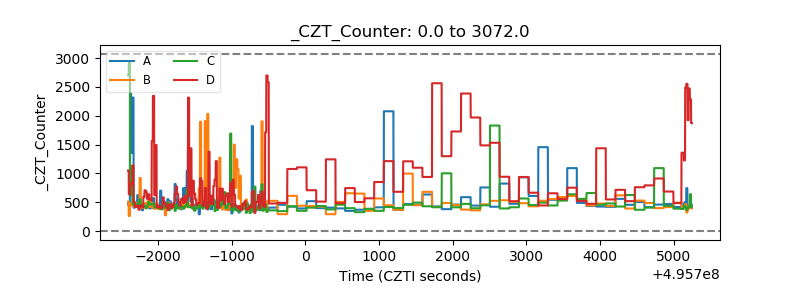 |
| +2.5 Volts monitor |  |
| +5 Volts monitor |  |
| _ROLL_ROT | 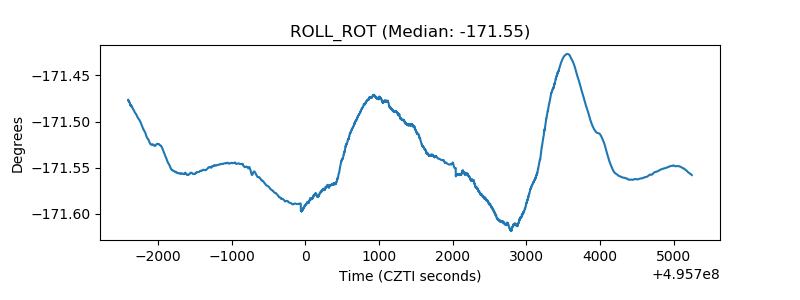 |
| _Roll_DEC | 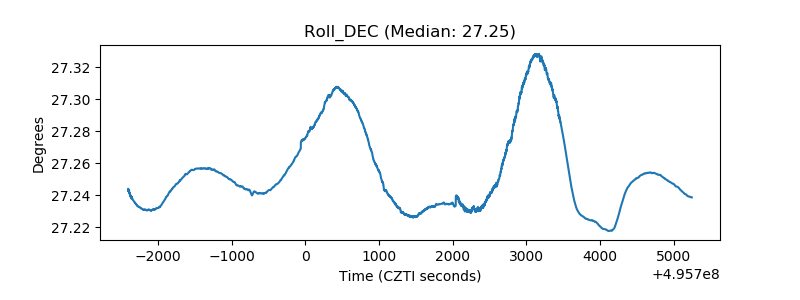 |
| _Roll_RA | 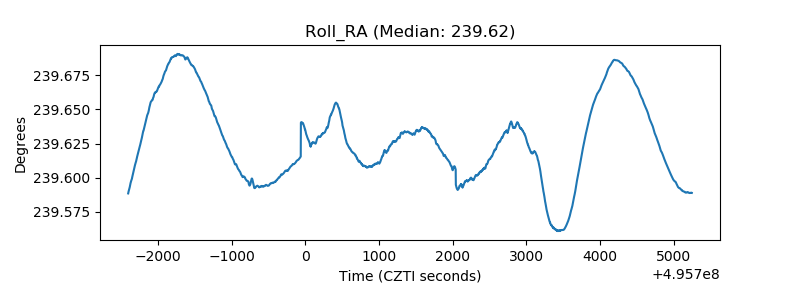 |
| Veto Counter | 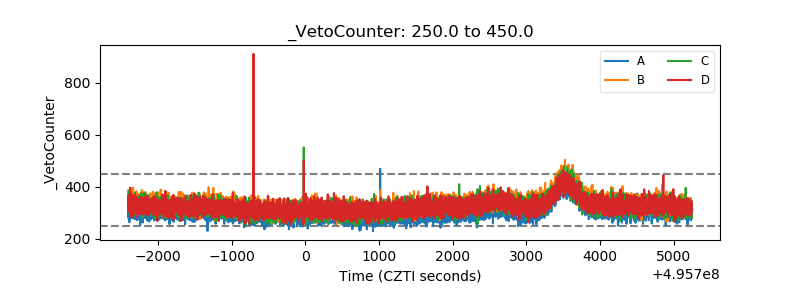 |