| Param | Original file | Final file |
|---|---|---|
| Filename | modeM0/AS1A14_057T04_9000006508_53930cztM0_level2.fits | modeM0/AS1A14_057T04_9000006508_53930cztM0_level2_quad_clean.evt |
| Size (bytes) | 1,197,498,240 | 127,399,680 |
| Size | 1.1 GB | 121.5 MB |
| Events in quadrant A | 6,032,600 | 979,727 |
| Events in quadrant B | 5,791,010 | 1,034,255 |
| Events in quadrant C | 13,830,135 | 635,037 |
| Events in quadrant D | 17,867,901 | 486,286 |
| Mode M0 | |||
|---|---|---|---|
| Quadrant | BADHDUFLAG | Total packets | Discarded packets |
| A | 0 | 25319 | 2 |
| B | 0 | 24659 | 3 |
| C | 0 | 48309 | 2 |
| D | 0 | 60240 | 2 |
| Mode SS | |||
|---|---|---|---|
| Quadrant | BADHDUFLAG | Total packets | Discarded packets |
| A | 0 | 212 | 0 |
| B | 0 | 212 | 0 |
| C | 0 | 212 | 0 |
| D | 0 | 212 | 0 |
| Mode M9 | |||
|---|---|---|---|
| Quadrant | BADHDUFLAG | Total packets | Discarded packets |
| A | 0 | 15 | 0 |
| B | 0 | 15 | 0 |
| C | 0 | 15 | 0 |
| D | 0 | 15 | 0 |
| Quadrant | Total seconds | Saturated seconds | Saturation percentage |
|---|---|---|---|
| A | 10417 | 326 | 3.129500% |
| B | 10417 | 282 | 2.707113% |
| C | 10417 | 3534 | 33.925314% |
| D | 10417 | 5230 | 50.206393% |
Noise dominated data is calculated using 1-second bins in cleaned event files. If a bin has >2000 counts, and if more than 50% of those come from <1% of pixels, then it is considered to be noise-dominated and hence unusable.
| Quadrant | # 1 sec bins | Bins with >0 counts | Bins with >2000 counts | High rate bins dominated by noise | Noise dominated (total time) | Noise dominated (detector-on time) | Marked lightcurve |
|---|---|---|---|---|---|---|---|
| A | 11951 | 10416 | 272 | 272 | 2.28% | 2.61% | 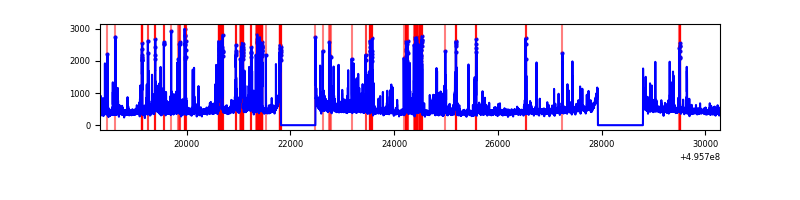 |
| B | 11951 | 10416 | 151 | 151 | 1.26% | 1.45% | 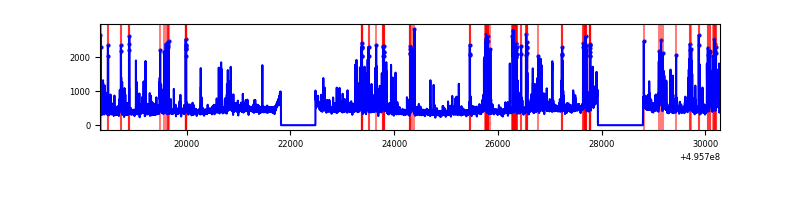 |
| C | 11951 | 10416 | 3538 | 3538 | 29.60% | 33.97% | 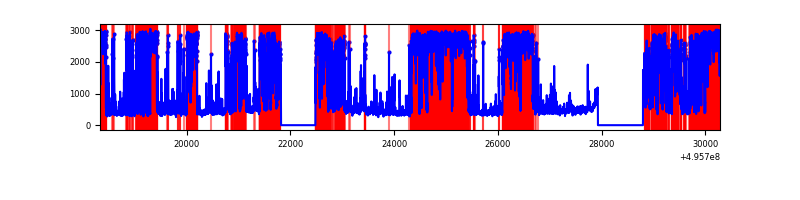 |
| D | 11951 | 10417 | 4715 | 4715 | 39.45% | 45.26% | 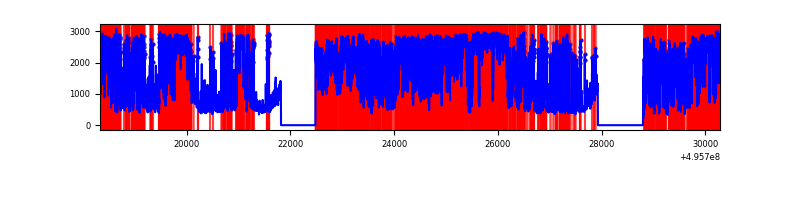 |
Top three noisy pixels from each quadrant. If the there are fewer than three noisy pixels in the level2.evt file, extra rows are filled as -1
| Pixel properties | Quadrant properties | ||||||
|---|---|---|---|---|---|---|---|
| Quadrant | DetID | PixID | Counts | Sigma | Mean | Median | Sigma |
| A | 0 | 8 | 751856 | 2791.03 | 1104 | 1078 | 269.0 |
| A | 15 | 174 | 363253 | 1346.39 | 1104 | 1078 | 269.0 |
| A | 3 | 45 | 195141 | 721.43 | 1104 | 1078 | 269.0 |
| B | 0 | 213 | 861866 | 3655.91 | 1098 | 1057 | 235.5 |
| B | 5 | 185 | 136754 | 576.31 | 1098 | 1057 | 235.5 |
| B | 7 | 252 | 106516 | 447.89 | 1098 | 1057 | 235.5 |
| C | 1 | 241 | 9629263 | 38617.56 | 901 | 892 | 249.3 |
| C | 12 | 252 | 252015 | 1007.21 | 901 | 892 | 249.3 |
| C | 14 | 254 | 108164 | 430.25 | 901 | 892 | 249.3 |
| D | 8 | 176 | 9419665 | 40728.31 | 793 | 756 | 231.3 |
| D | 6 | 239 | 2264996 | 9790.8 | 793 | 756 | 231.3 |
| D | 10 | 172 | 1157632 | 5002.45 | 793 | 756 | 231.3 |
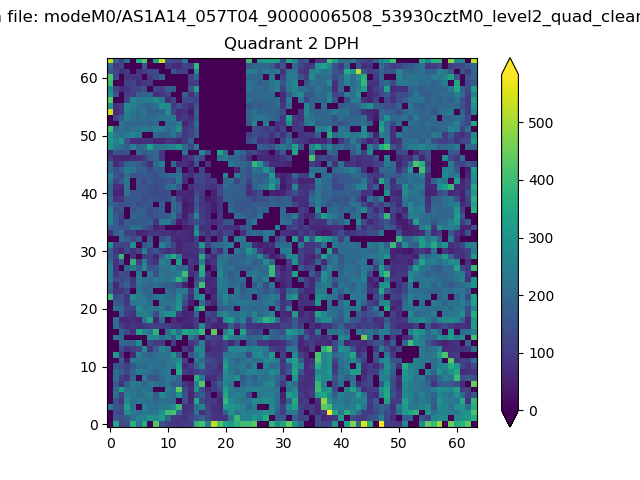
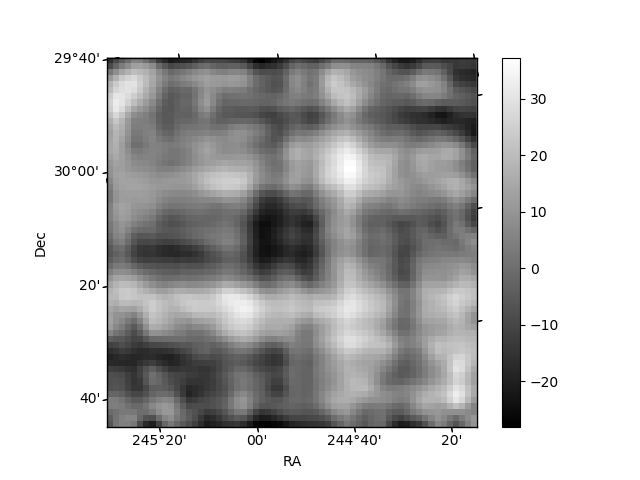
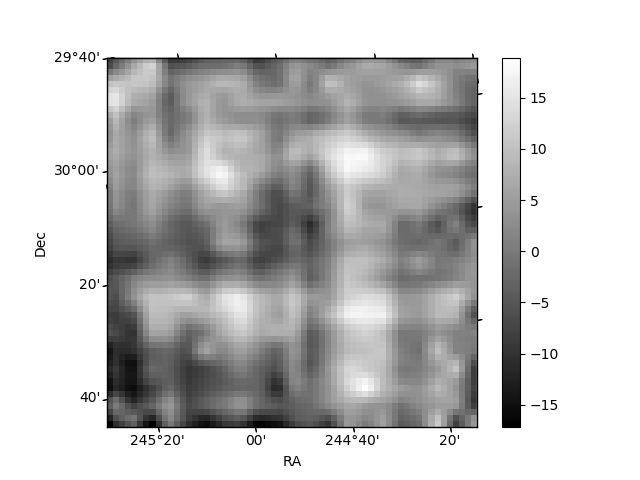
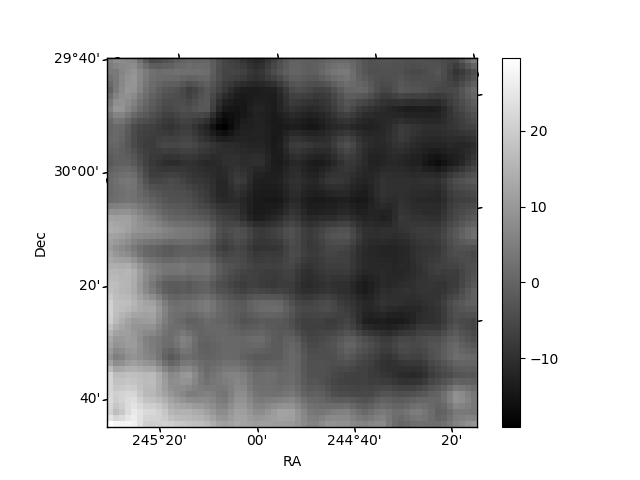
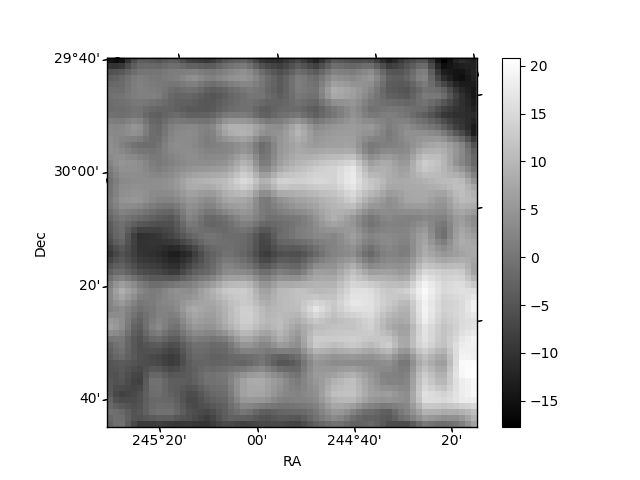
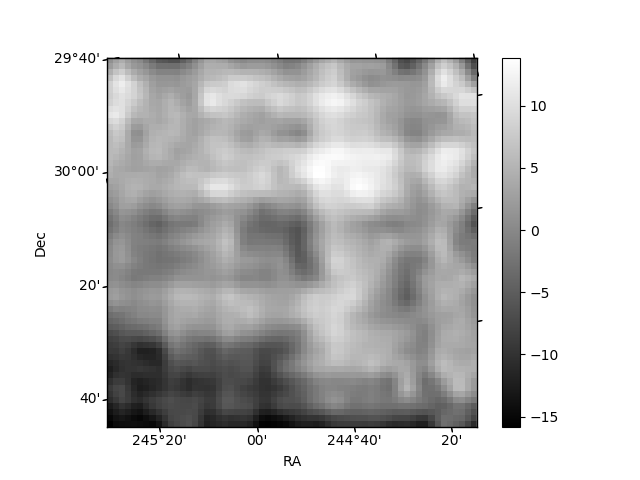
Histogram calculated using DETX and DETY for each event in the final _common_clean file
| Quadrant A | 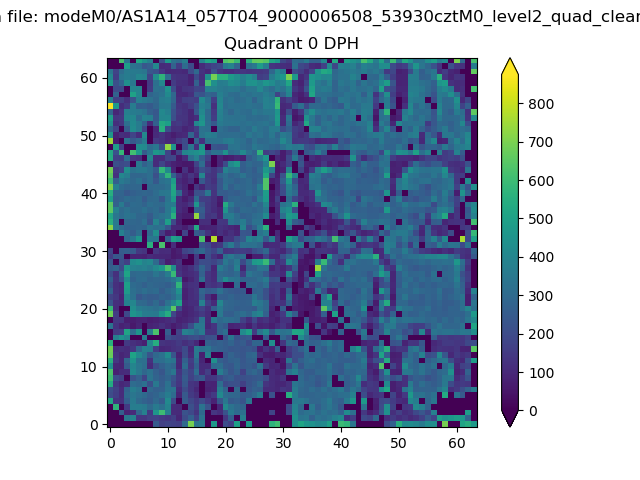 |
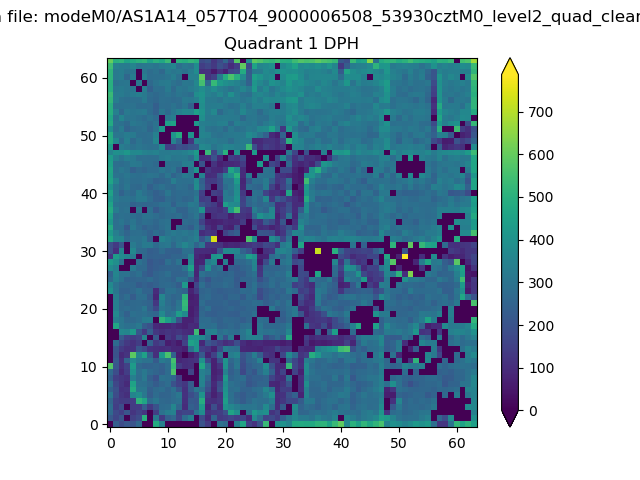 |
Quadrant B |
|---|---|---|---|
| Quadrant D | 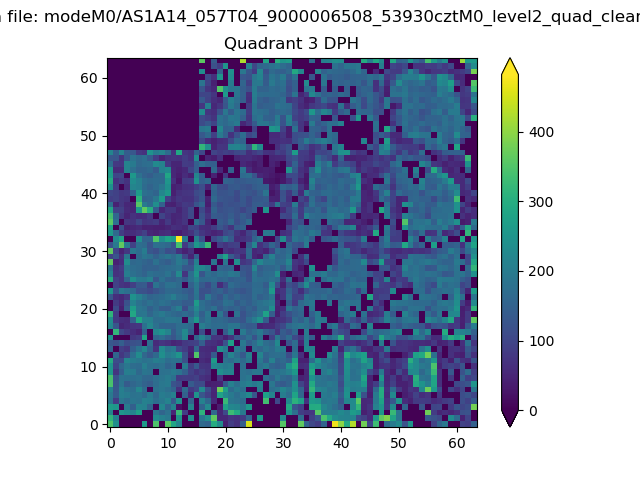 |
 |
Quadrant C |
| Plot type | Count rate plots | Images |
|---|---|---|
| Comparison with Poisson distribution Blue bars denote a histogram of data divided into 1 sec bins. Red curve is a Poisson curve with rate = median count rate of data. |
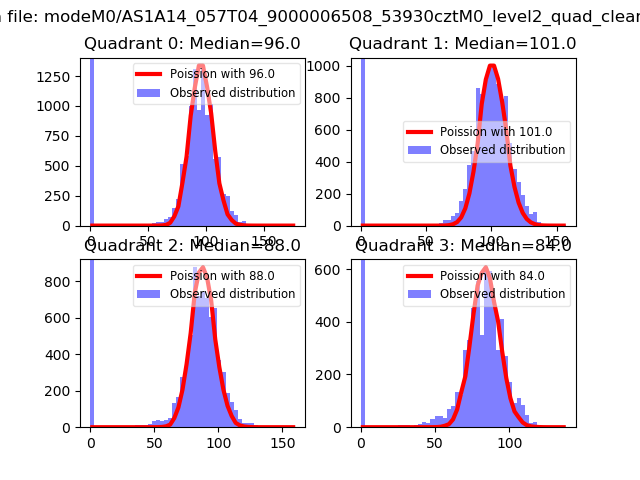 |
 |
| Quadrant-wise count rates Data is divided into 100 sec bins |
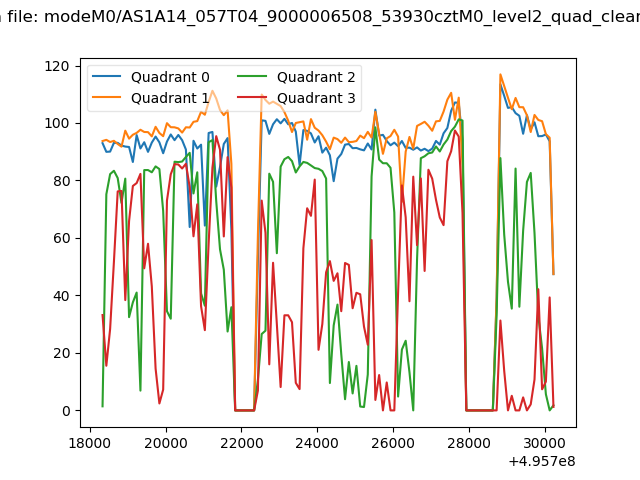 |
|
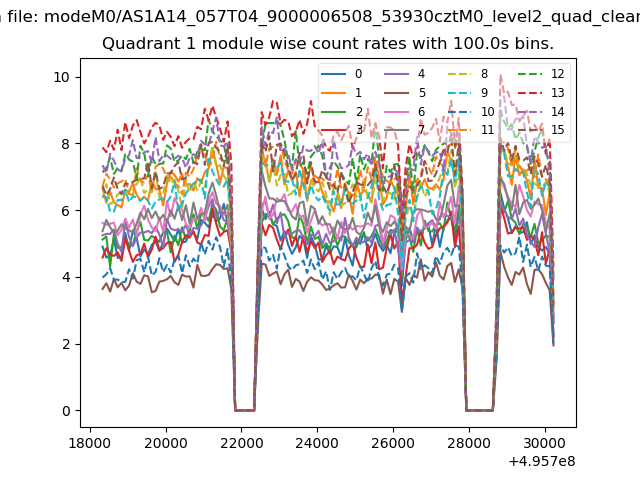
| Module-wise count rates for Quadrant A Data is divided into 100 sec bins |
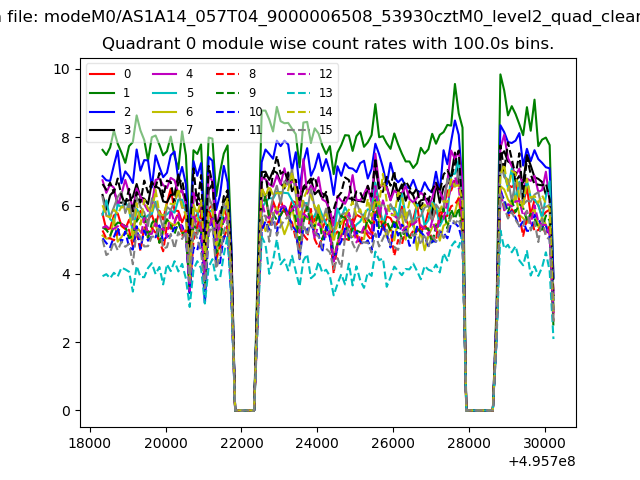 |
 |
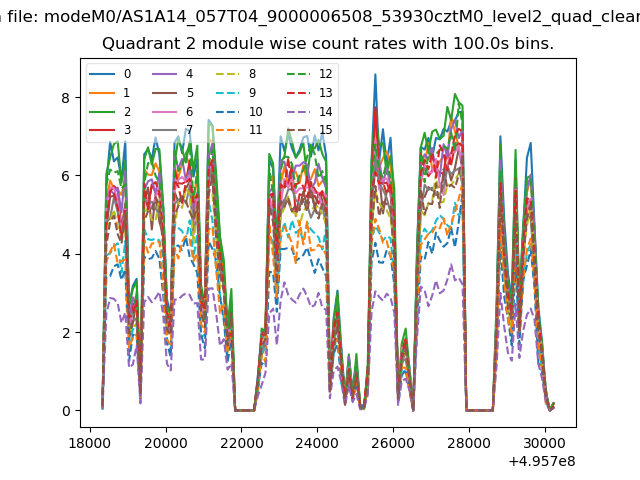
| Module-wise count rates for Quadrant B Data is divided into 100 sec bins |
 |
 |
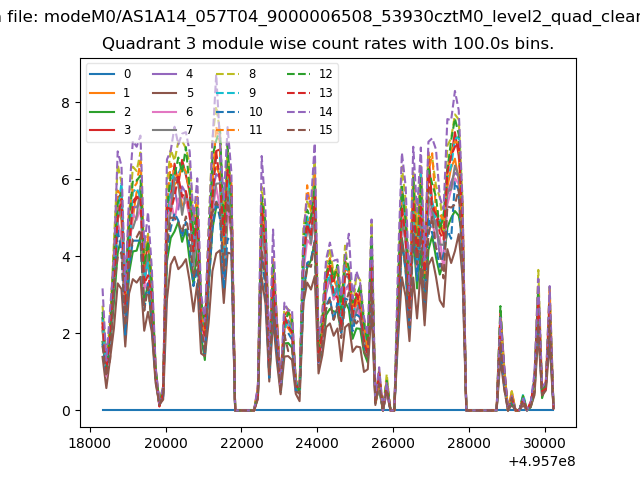
| Module-wise count rates for Quadrant C Data is divided into 100 sec bins |
 |
 |
| Module-wise count rates for Quadrant D Data is divided into 100 sec bins |
 |
 |
| Parameter | Plot |
|---|---|
| CZT HV Monitor | 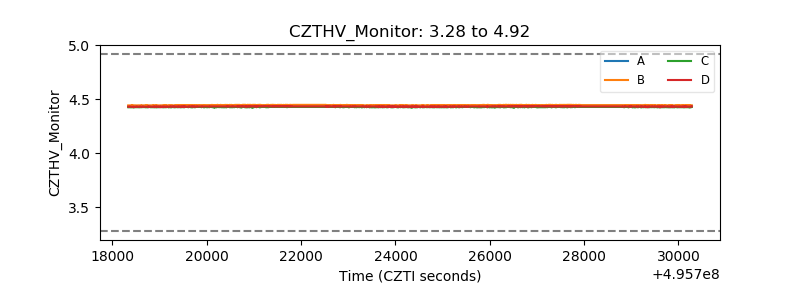 |
| D_VDD | 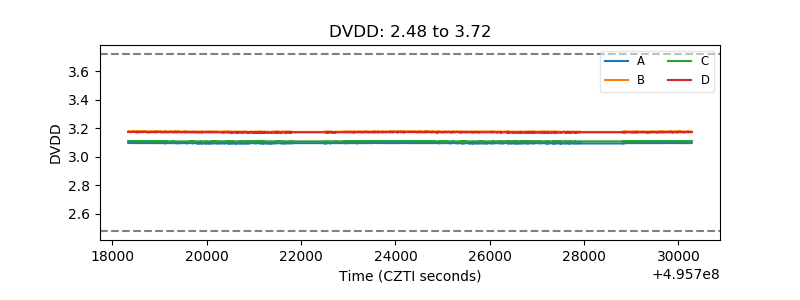 |
| Temperature 1 | 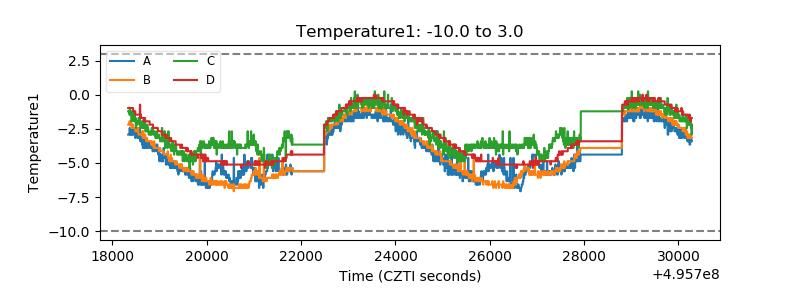 |
| Veto HV Monitor |  |
| Veto LLD | 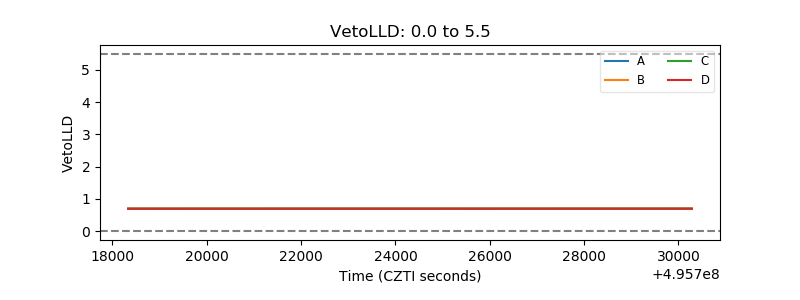 |
| Alpha Counter | 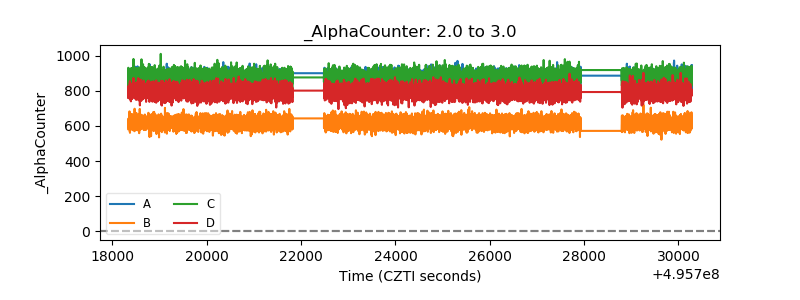 |
| _CPM_Rate | 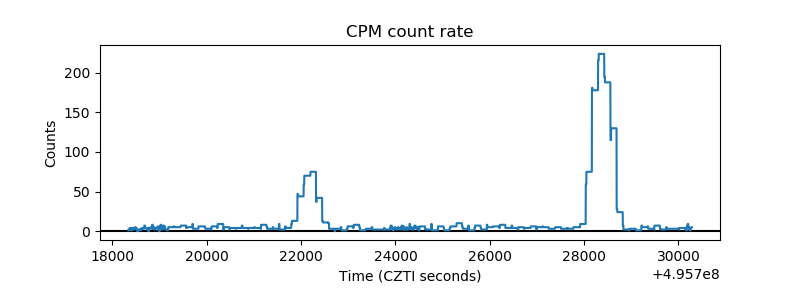 |
| CZT Counter | 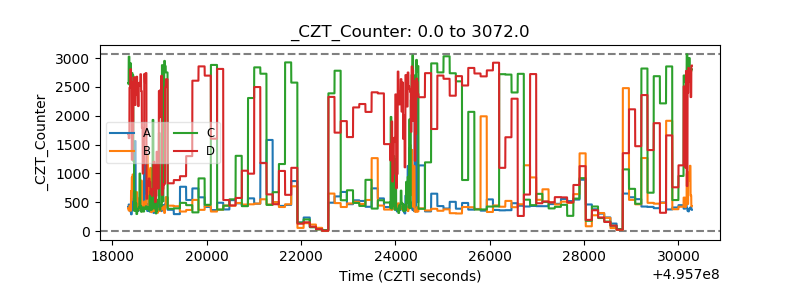 |
| +2.5 Volts monitor | 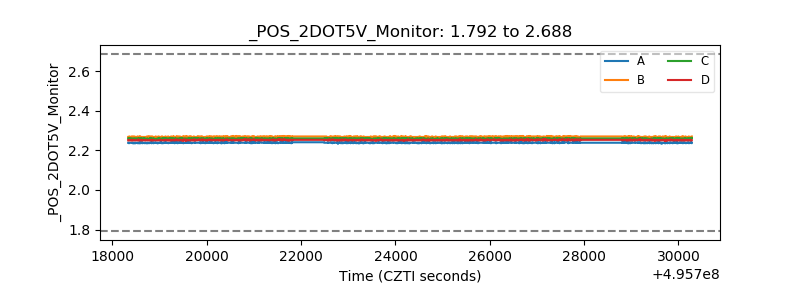 |
| +5 Volts monitor |  |
| _ROLL_ROT | 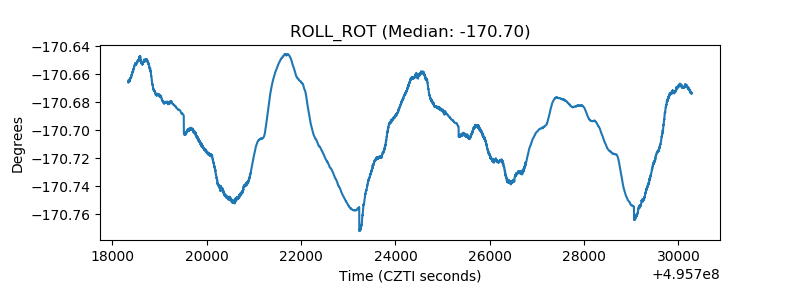 |
| _Roll_DEC | 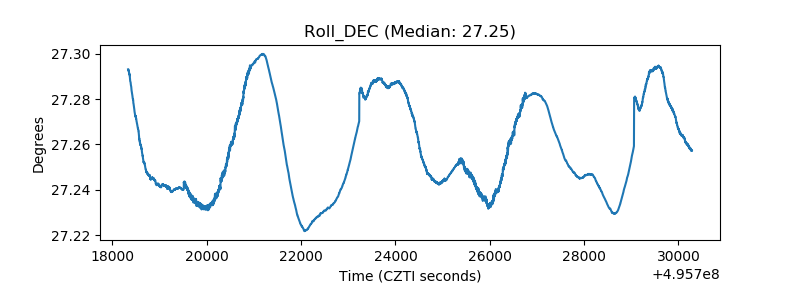 |
| _Roll_RA | 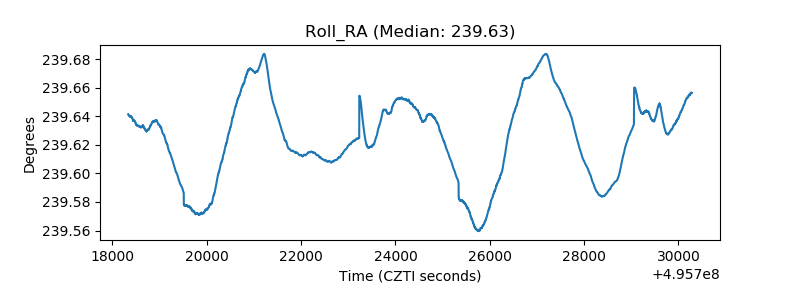 |
| Veto Counter | 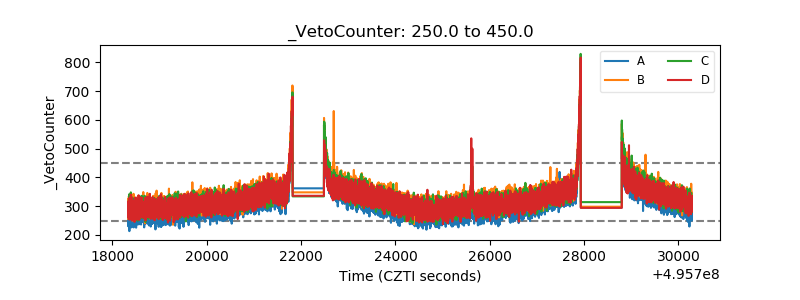 |