| Param | Original file | Final file |
|---|---|---|
| Filename | modeM0/AS1A14_057T04_9000006508_53932cztM0_level2.fits | modeM0/AS1A14_057T04_9000006508_53932cztM0_level2_quad_clean.evt |
| Size (bytes) | 773,303,040 | 72,982,080 |
| Size | 737.5 MB | 69.6 MB |
| Events in quadrant A | 3,265,715 | 598,716 |
| Events in quadrant B | 4,044,951 | 618,003 |
| Events in quadrant C | 6,833,473 | 453,888 |
| Events in quadrant D | 13,997,420 | 104,294 |
| Mode M0 | |||
|---|---|---|---|
| Quadrant | BADHDUFLAG | Total packets | Discarded packets |
| A | 0 | 14224 | 1 |
| B | 0 | 16379 | 1 |
| C | 0 | 24715 | 1 |
| D | 0 | 45881 | 3 |
| Mode SS | |||
|---|---|---|---|
| Quadrant | BADHDUFLAG | Total packets | Discarded packets |
| A | 0 | 126 | 0 |
| B | 0 | 126 | 0 |
| C | 0 | 126 | 0 |
| D | 0 | 126 | 0 |
| Mode M9 | |||
|---|---|---|---|
| Quadrant | BADHDUFLAG | Total packets | Discarded packets |
| A | 0 | 10 | 0 |
| B | 0 | 10 | 0 |
| C | 0 | 10 | 0 |
| D | 0 | 10 | 0 |
| Quadrant | Total seconds | Saturated seconds | Saturation percentage |
|---|---|---|---|
| A | 6227 | 128 | 2.055564% |
| B | 6228 | 287 | 4.608221% |
| C | 6228 | 1384 | 22.222222% |
| D | 6227 | 5223 | 83.876666% |
Noise dominated data is calculated using 1-second bins in cleaned event files. If a bin has >2000 counts, and if more than 50% of those come from <1% of pixels, then it is considered to be noise-dominated and hence unusable.
| Quadrant | # 1 sec bins | Bins with >0 counts | Bins with >2000 counts | High rate bins dominated by noise | Noise dominated (total time) | Noise dominated (detector-on time) | Marked lightcurve |
|---|---|---|---|---|---|---|---|
| A | 7202 | 6228 | 105 | 105 | 1.46% | 1.69% | 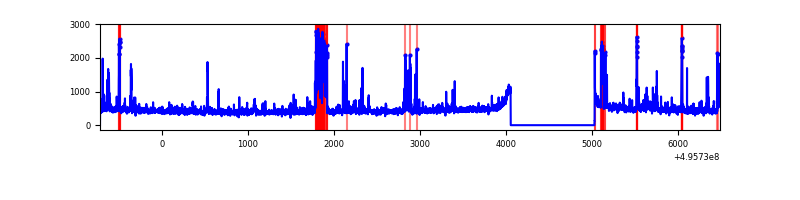 |
| B | 7203 | 6229 | 161 | 161 | 2.24% | 2.58% | 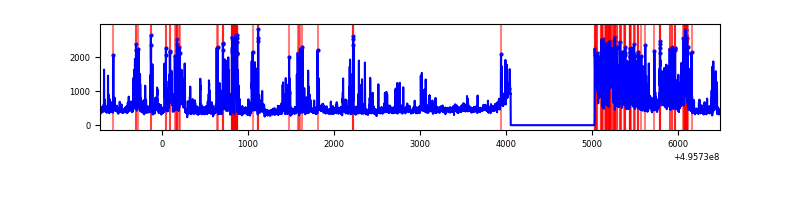 |
| C | 7203 | 6229 | 1392 | 1392 | 19.33% | 22.35% | 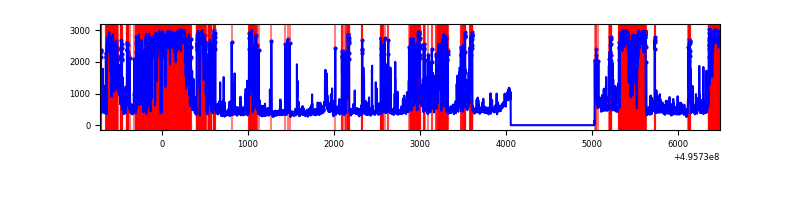 |
| D | 7202 | 6228 | 4525 | 4525 | 62.83% | 72.66% | 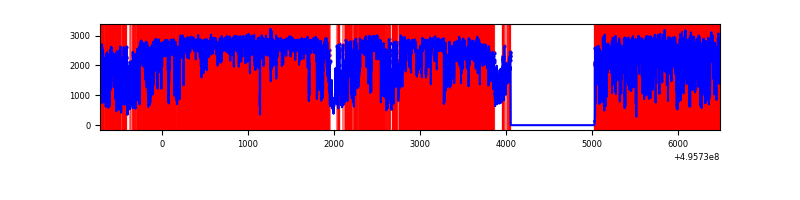 |
Top three noisy pixels from each quadrant. If the there are fewer than three noisy pixels in the level2.evt file, extra rows are filled as -1
| Pixel properties | Quadrant properties | ||||||
|---|---|---|---|---|---|---|---|
| Quadrant | DetID | PixID | Counts | Sigma | Mean | Median | Sigma |
| A | 10 | 253 | 240783 | 1449.15 | 666 | 647 | 165.7 |
| A | 15 | 174 | 180734 | 1086.77 | 666 | 647 | 165.7 |
| A | 0 | 8 | 79623 | 476.6 | 666 | 647 | 165.7 |
| B | 0 | 213 | 806684 | 5684.2 | 652 | 628 | 141.8 |
| B | 1 | 223 | 179868 | 1263.98 | 652 | 628 | 141.8 |
| B | 5 | 185 | 150224 | 1054.93 | 652 | 628 | 141.8 |
| C | 1 | 241 | 4040149 | 25234.86 | 575 | 569 | 160.1 |
| C | 12 | 252 | 171965 | 1070.69 | 575 | 569 | 160.1 |
| C | 13 | 3 | 166060 | 1033.81 | 575 | 569 | 160.1 |
| D | 8 | 176 | 9973911 | 119153.27 | 283 | 271 | 83.7 |
| D | 2 | 172 | 1312255 | 15674.04 | 283 | 271 | 83.7 |
| D | 10 | 172 | 583052 | 6962.38 | 283 | 271 | 83.7 |
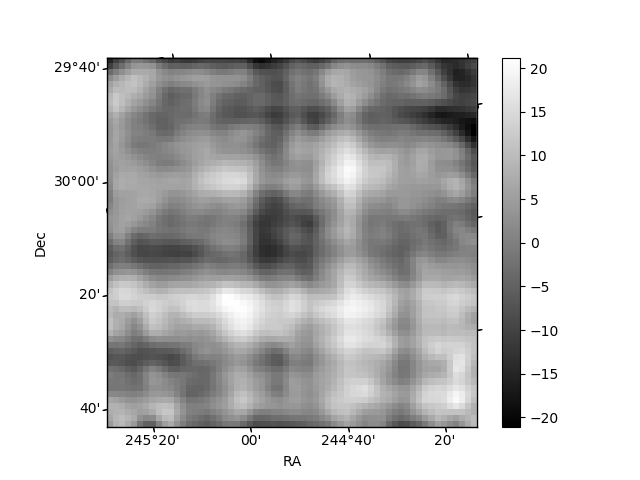
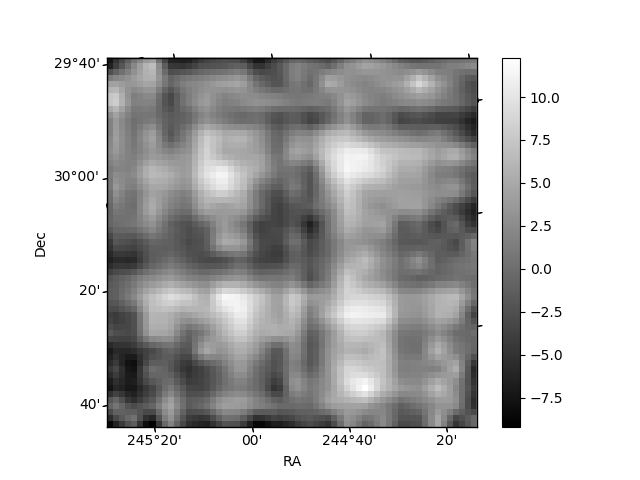
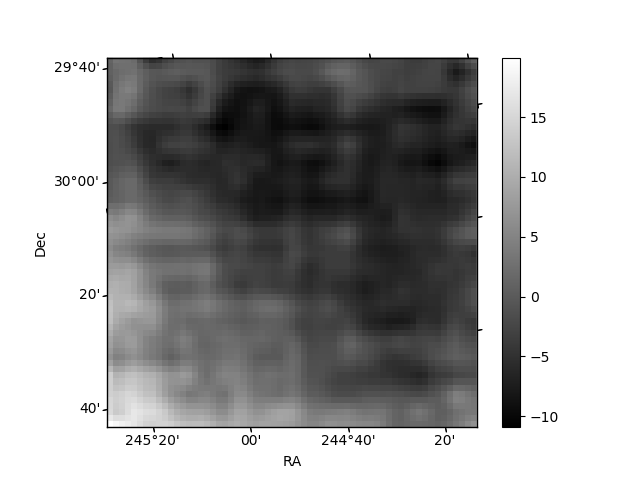
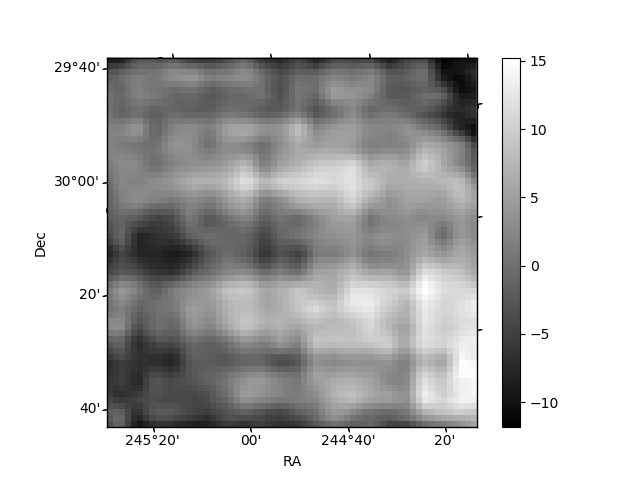
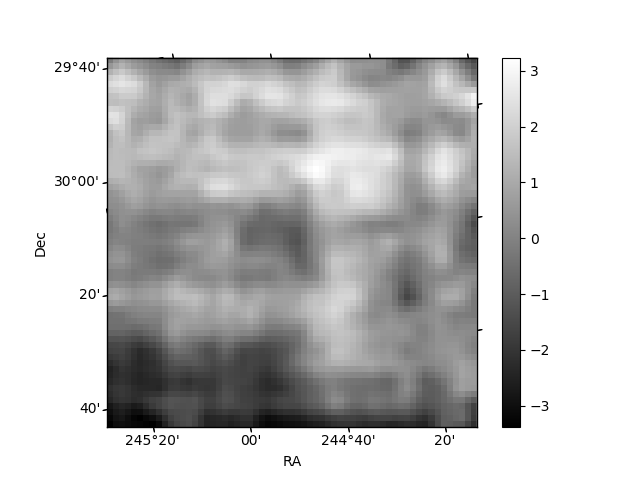
Histogram calculated using DETX and DETY for each event in the final _common_clean file
| Quadrant A | 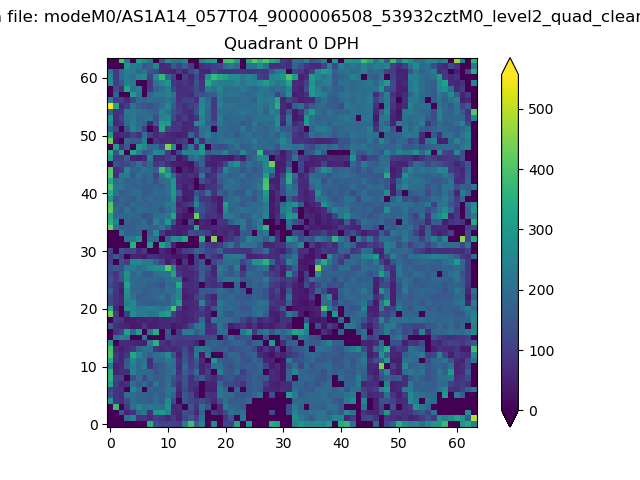 |
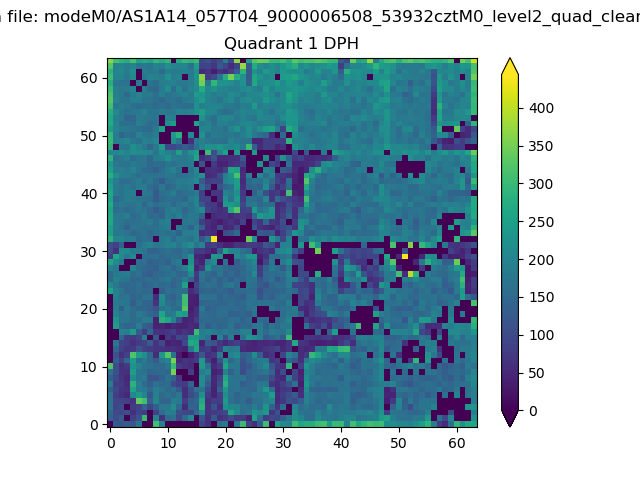 |
Quadrant B |
|---|---|---|---|
| Quadrant D | 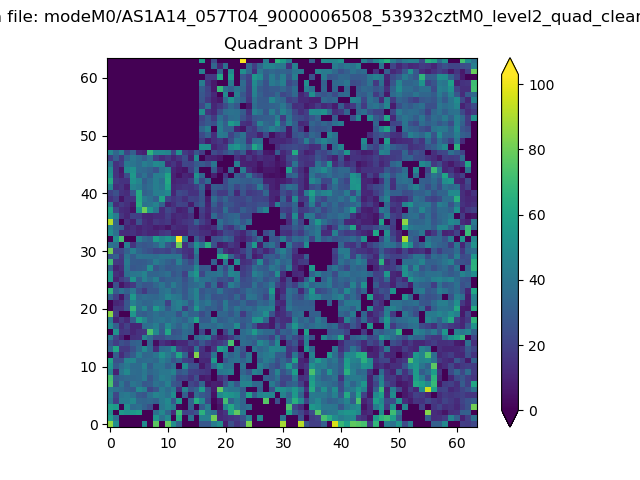 |
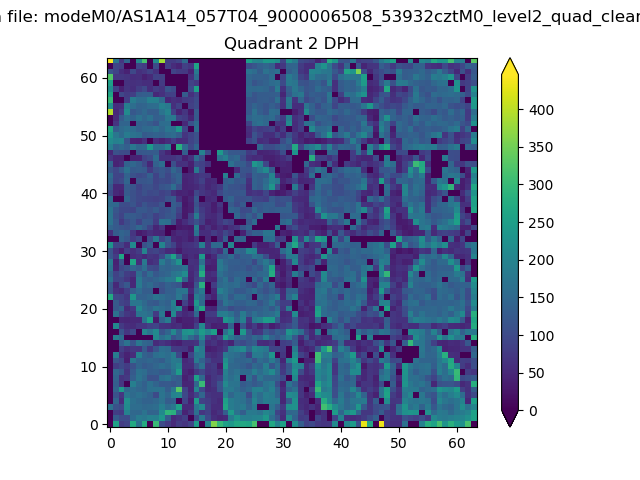 |
Quadrant C |
| Plot type | Count rate plots | Images |
|---|---|---|
| Comparison with Poisson distribution Blue bars denote a histogram of data divided into 1 sec bins. Red curve is a Poisson curve with rate = median count rate of data. |
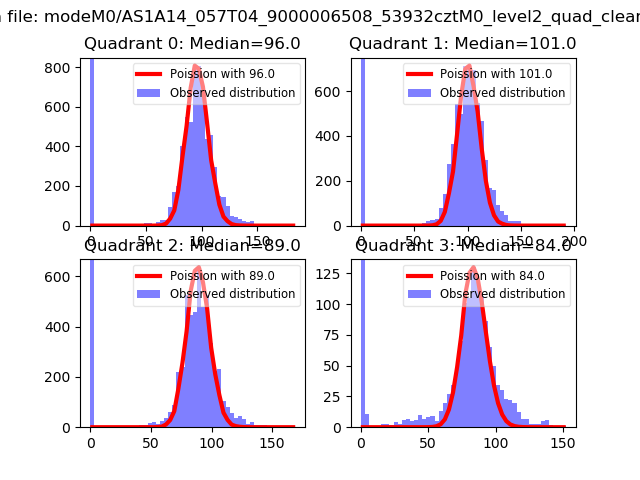 |
 |
| Quadrant-wise count rates Data is divided into 100 sec bins |
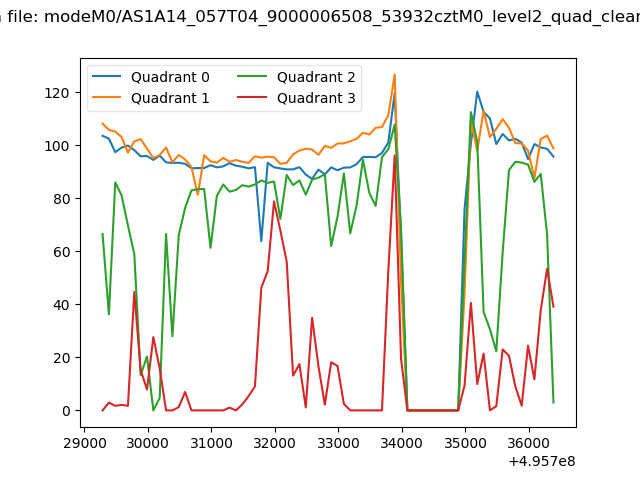 |
|
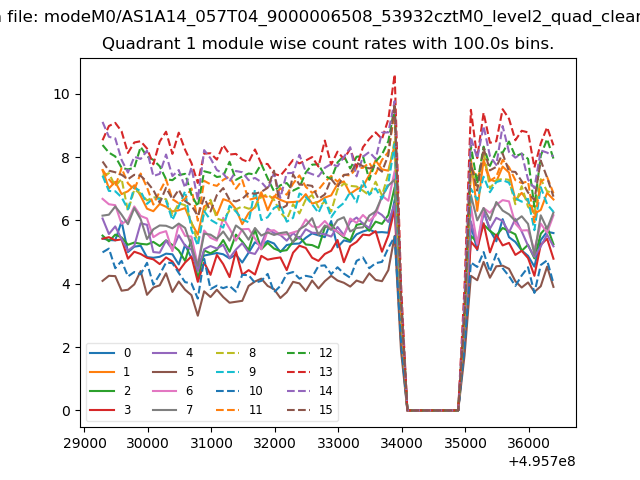
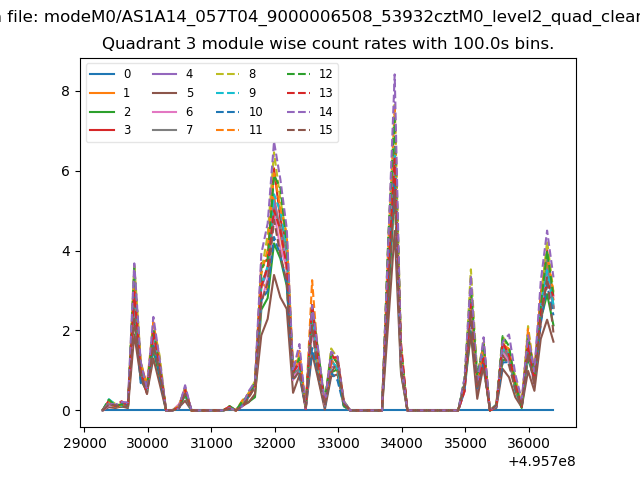
| Module-wise count rates for Quadrant A Data is divided into 100 sec bins |
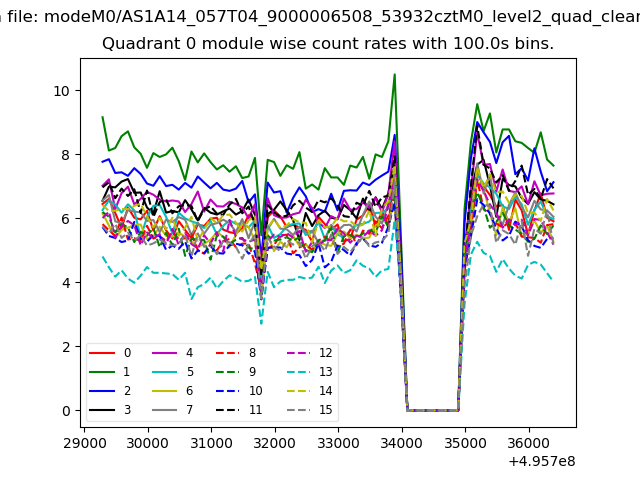 |
 |
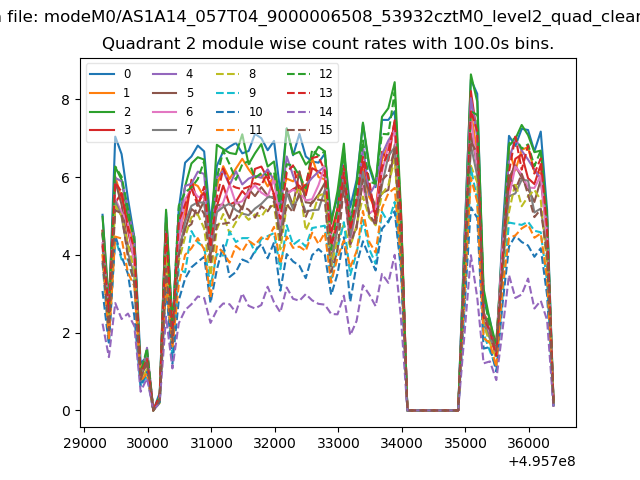
| Module-wise count rates for Quadrant B Data is divided into 100 sec bins |
 |
 |
| Module-wise count rates for Quadrant C Data is divided into 100 sec bins |
 |
 |
| Module-wise count rates for Quadrant D Data is divided into 100 sec bins |
 |
 |
| Parameter | Plot |
|---|---|
| CZT HV Monitor | 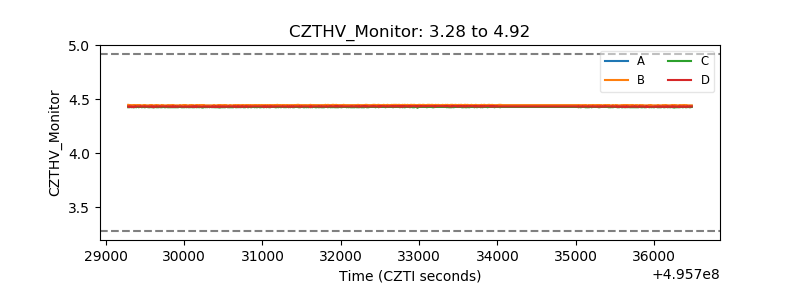 |
| D_VDD | 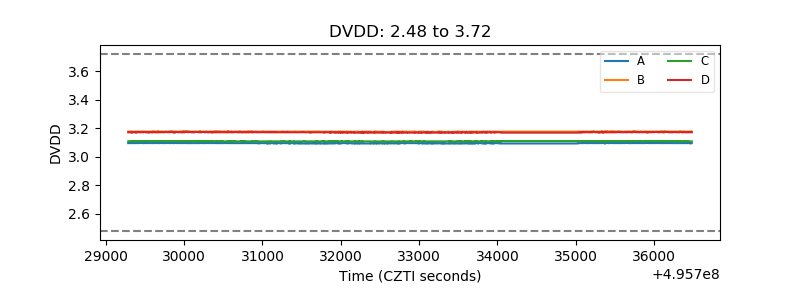 |
| Temperature 1 | 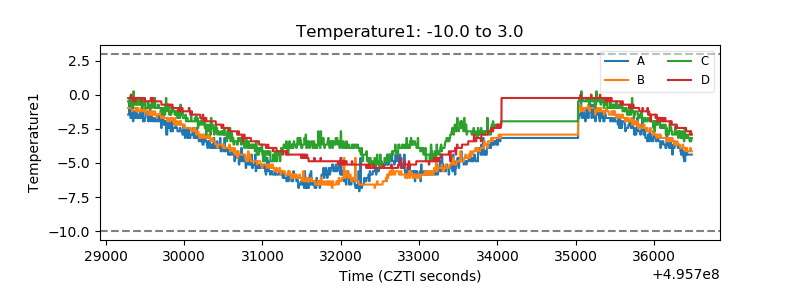 |
| Veto HV Monitor | 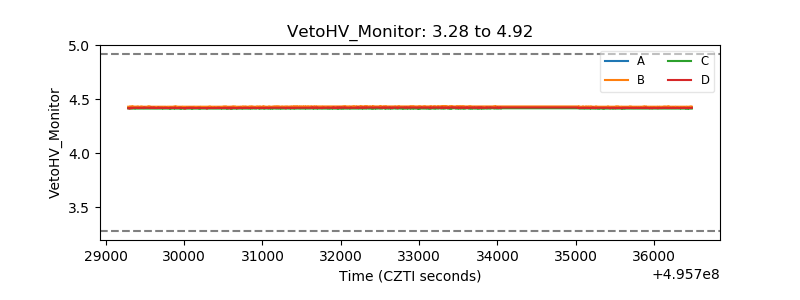 |
| Veto LLD | 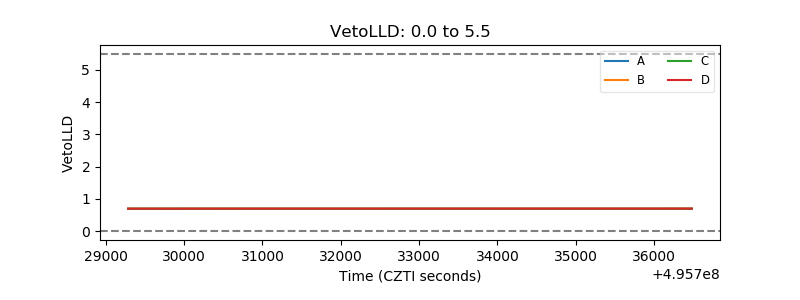 |
| Alpha Counter | 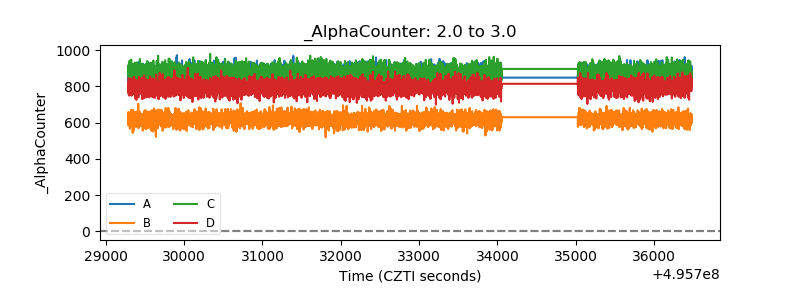 |
| _CPM_Rate | 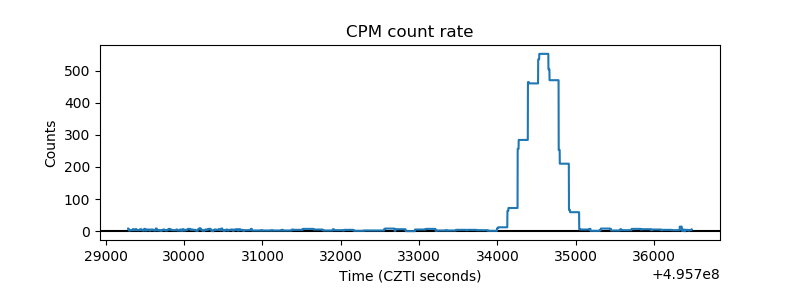 |
| CZT Counter | 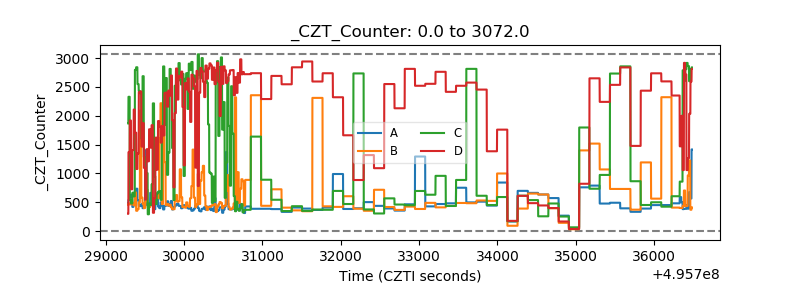 |
| +2.5 Volts monitor | 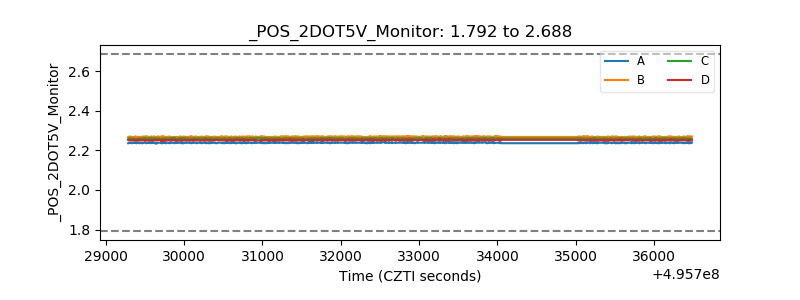 |
| +5 Volts monitor | 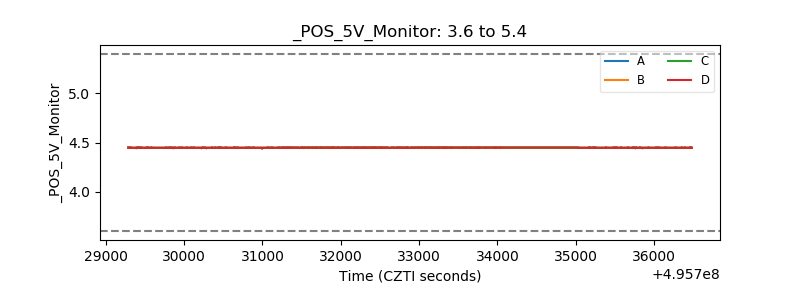 |
| _ROLL_ROT | 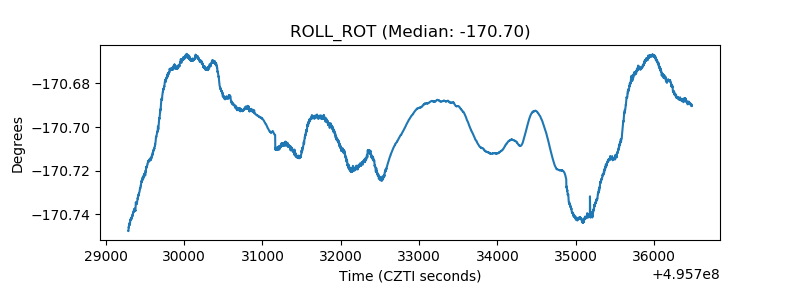 |
| _Roll_DEC | 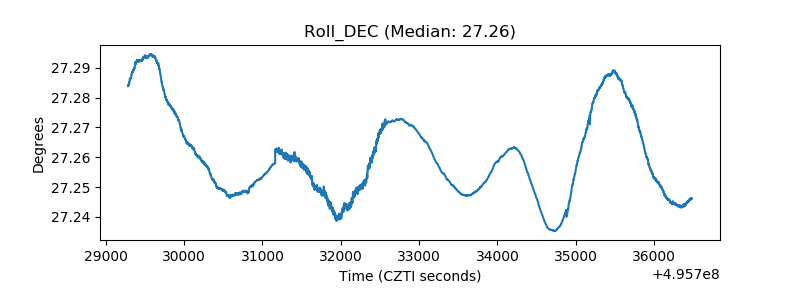 |
| _Roll_RA | 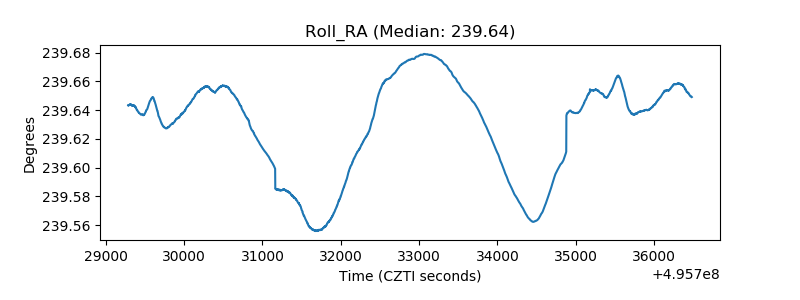 |
| Veto Counter | 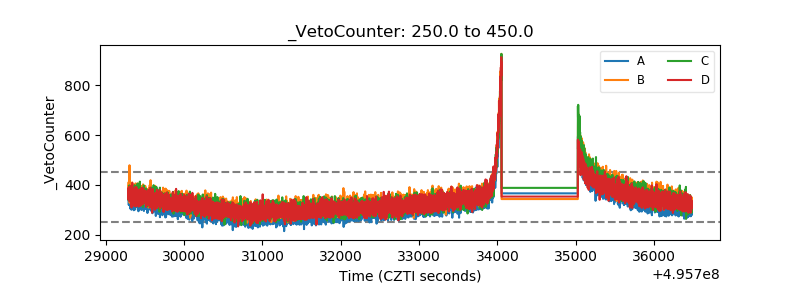 |