| Param | Original file | Final file |
|---|---|---|
| Filename | modeM0/AS1A14_057T04_9000006508_53933cztM0_level2.fits | modeM0/AS1A14_057T04_9000006508_53933cztM0_level2_quad_clean.evt |
| Size (bytes) | 734,630,400 | 83,154,240 |
| Size | 700.6 MB | 79.3 MB |
| Events in quadrant A | 3,482,315 | 638,548 |
| Events in quadrant B | 4,537,388 | 661,943 |
| Events in quadrant C | 6,634,857 | 498,782 |
| Events in quadrant D | 12,035,417 | 265,261 |
| Mode M0 | |||
|---|---|---|---|
| Quadrant | BADHDUFLAG | Total packets | Discarded packets |
| A | 0 | 15061 | 2 |
| B | 0 | 18019 | 2 |
| C | 0 | 24225 | 2 |
| D | 0 | 40173 | 2 |
| Mode SS | |||
|---|---|---|---|
| Quadrant | BADHDUFLAG | Total packets | Discarded packets |
| A | 0 | 132 | 0 |
| B | 0 | 132 | 0 |
| C | 0 | 132 | 0 |
| D | 0 | 132 | 0 |
| Mode M9 | |||
|---|---|---|---|
| Quadrant | BADHDUFLAG | Total packets | Discarded packets |
| A | 0 | 11 | 0 |
| B | 0 | 11 | 0 |
| C | 0 | 11 | 0 |
| D | 0 | 11 | 0 |
| Quadrant | Total seconds | Saturated seconds | Saturation percentage |
|---|---|---|---|
| A | 6494 | 141 | 2.171235% |
| B | 6493 | 362 | 5.575235% |
| C | 6493 | 1291 | 19.882951% |
| D | 6494 | 3723 | 57.329843% |
Noise dominated data is calculated using 1-second bins in cleaned event files. If a bin has >2000 counts, and if more than 50% of those come from <1% of pixels, then it is considered to be noise-dominated and hence unusable.
| Quadrant | # 1 sec bins | Bins with >0 counts | Bins with >2000 counts | High rate bins dominated by noise | Noise dominated (total time) | Noise dominated (detector-on time) | Marked lightcurve |
|---|---|---|---|---|---|---|---|
| A | 7599 | 6495 | 119 | 119 | 1.57% | 1.83% | 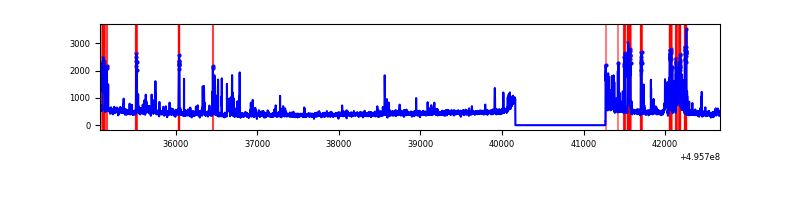 |
| B | 7598 | 6494 | 246 | 246 | 3.24% | 3.79% | 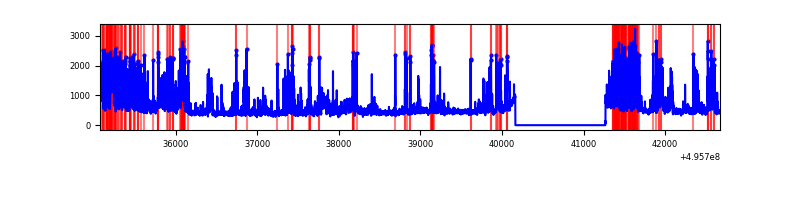 |
| C | 7598 | 6494 | 1285 | 1285 | 16.91% | 19.79% | 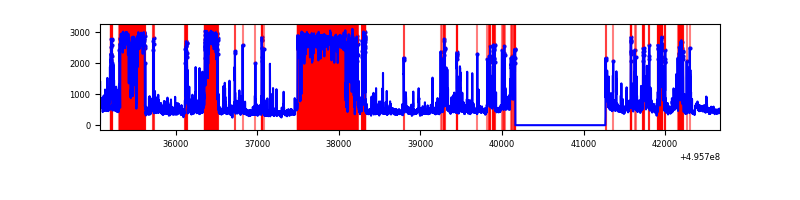 |
| D | 7599 | 6495 | 3491 | 3491 | 45.94% | 53.75% | 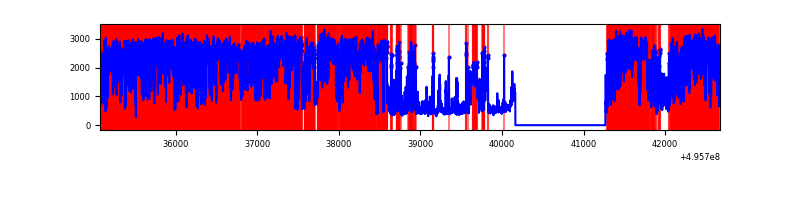 |
Top three noisy pixels from each quadrant. If the there are fewer than three noisy pixels in the level2.evt file, extra rows are filled as -1
| Pixel properties | Quadrant properties | ||||||
|---|---|---|---|---|---|---|---|
| Quadrant | DetID | PixID | Counts | Sigma | Mean | Median | Sigma |
| A | 15 | 174 | 472460 | 2736.46 | 700 | 682 | 172.4 |
| A | 4 | 249 | 74587 | 428.67 | 700 | 682 | 172.4 |
| A | 12 | 17 | 50816 | 290.79 | 700 | 682 | 172.4 |
| B | 0 | 213 | 775779 | 5296.91 | 687 | 664 | 146.3 |
| B | 1 | 223 | 452645 | 3088.71 | 687 | 664 | 146.3 |
| B | 0 | 155 | 171173 | 1165.21 | 687 | 664 | 146.3 |
| C | 1 | 241 | 3620438 | 21544.43 | 610 | 603 | 168.0 |
| C | 12 | 252 | 142854 | 846.65 | 610 | 603 | 168.0 |
| C | 13 | 3 | 117645 | 696.61 | 610 | 603 | 168.0 |
| D | 8 | 176 | 7368434 | 57454.7 | 440 | 419 | 128.2 |
| D | 6 | 239 | 1226531 | 9561.04 | 440 | 419 | 128.2 |
| D | 10 | 172 | 368670 | 2871.57 | 440 | 419 | 128.2 |
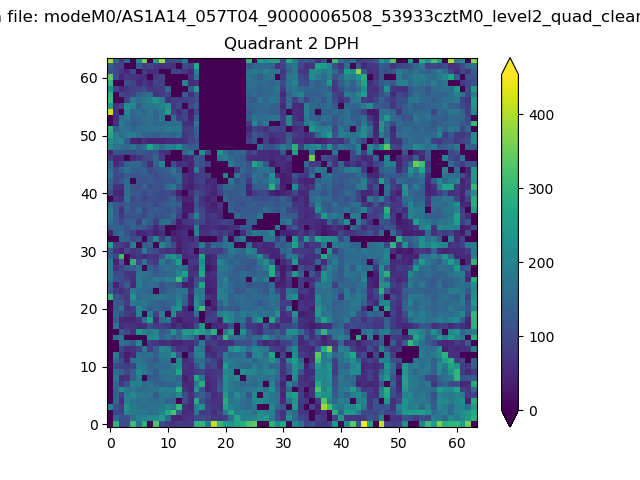
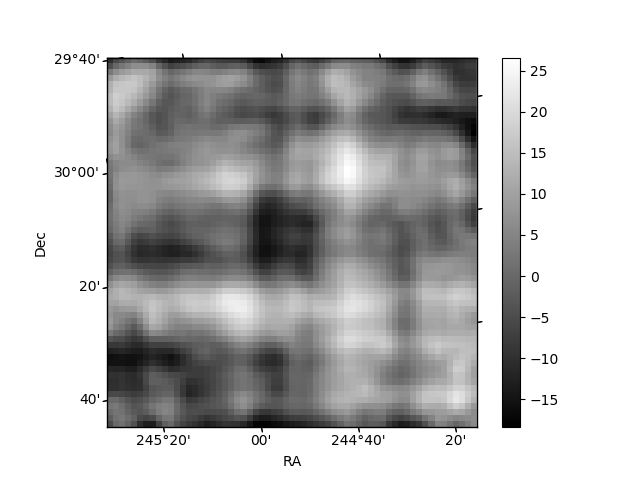
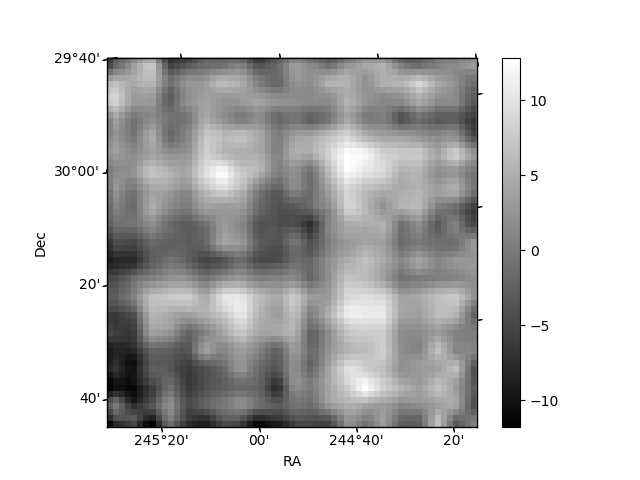
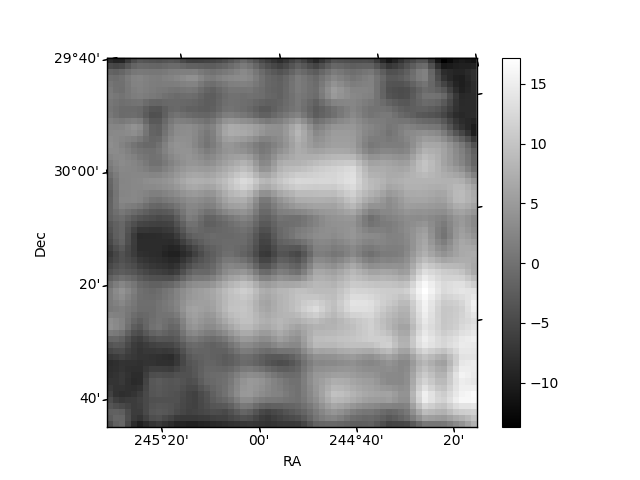
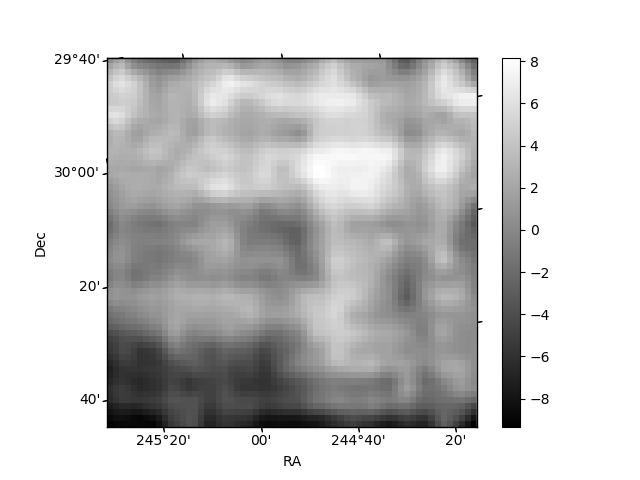
Histogram calculated using DETX and DETY for each event in the final _common_clean file
| Quadrant A | 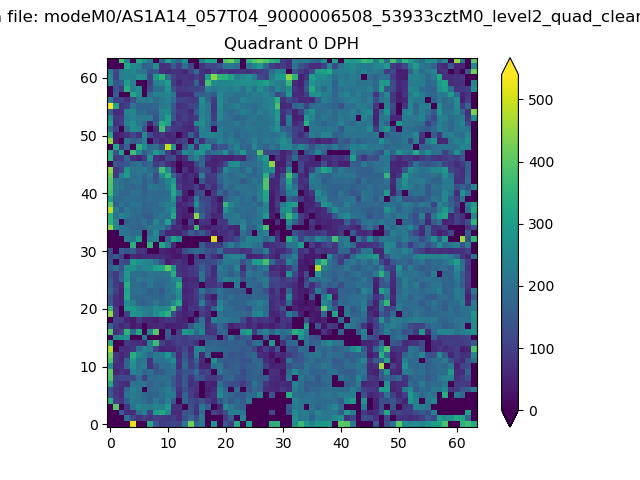 |
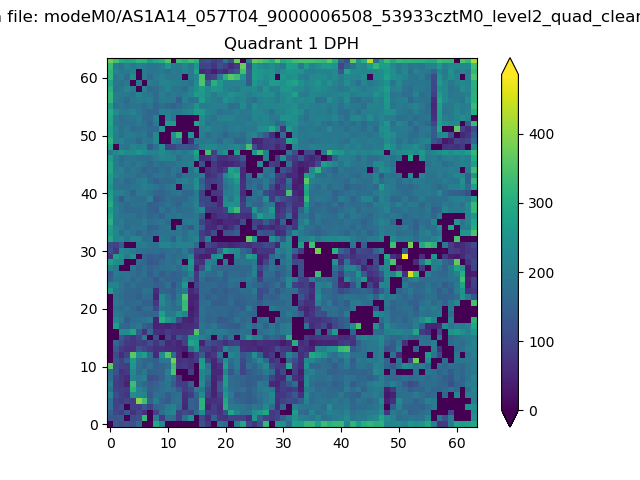 |
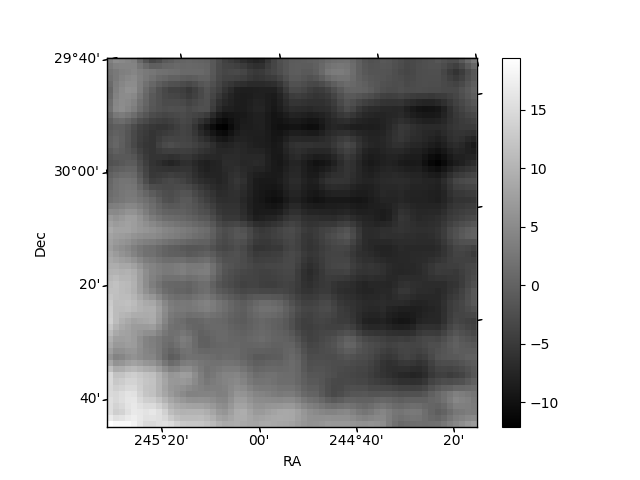
Quadrant B |
|---|---|---|---|
| Quadrant D | 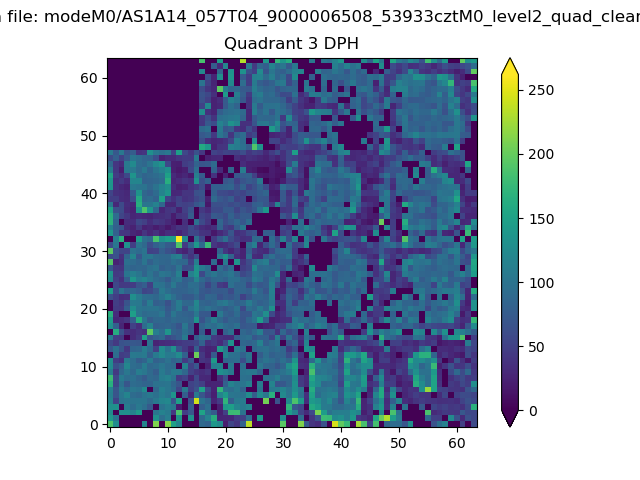 |
 |
Quadrant C |
| Plot type | Count rate plots | Images |
|---|---|---|
| Comparison with Poisson distribution Blue bars denote a histogram of data divided into 1 sec bins. Red curve is a Poisson curve with rate = median count rate of data. |
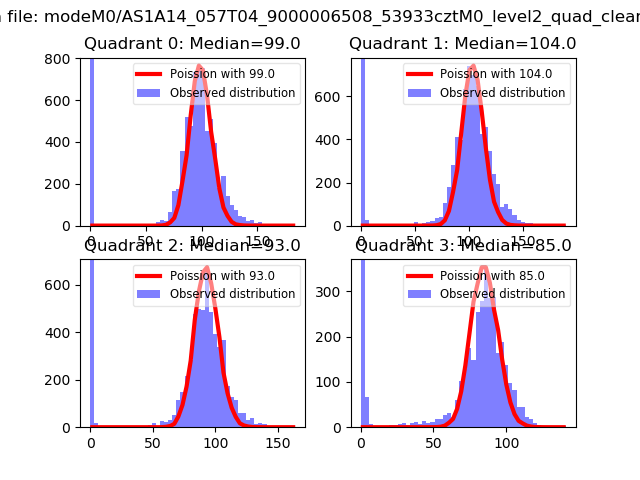 |
 |
| Quadrant-wise count rates Data is divided into 100 sec bins |
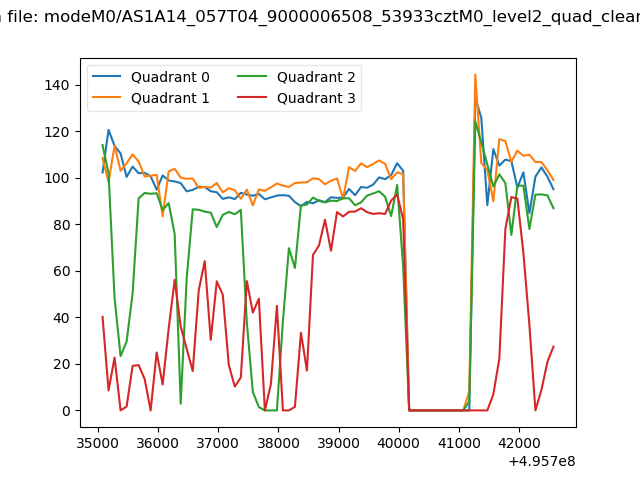 |
|
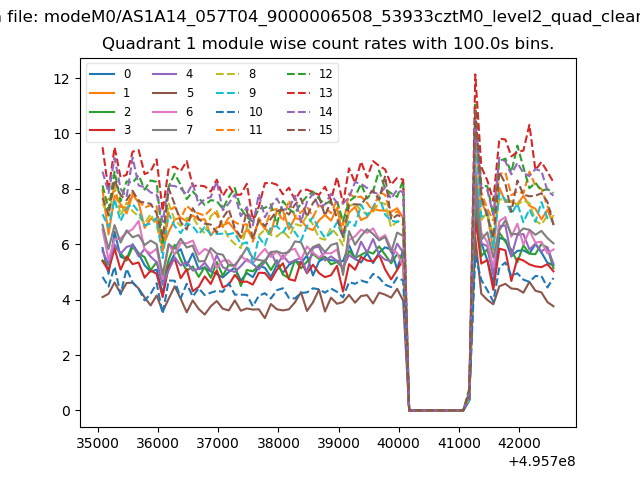
| Module-wise count rates for Quadrant A Data is divided into 100 sec bins |
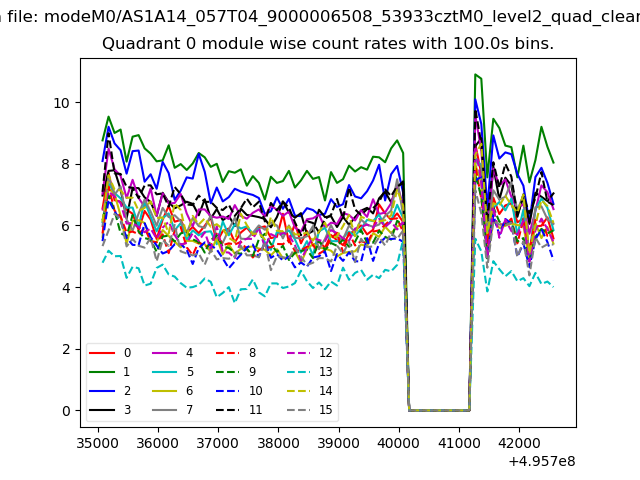 |
 |
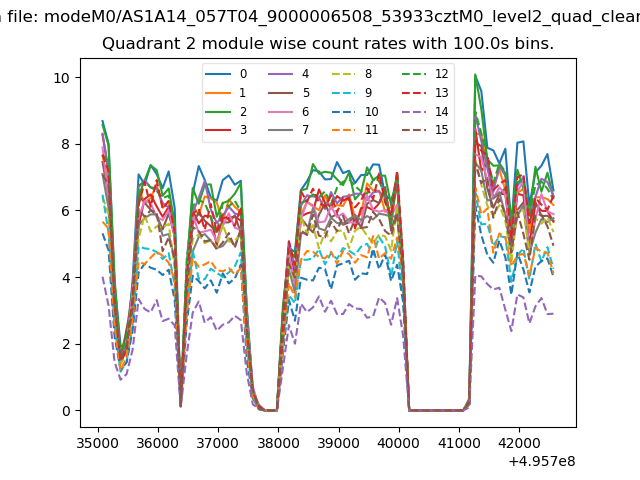
| Module-wise count rates for Quadrant B Data is divided into 100 sec bins |
 |
 |
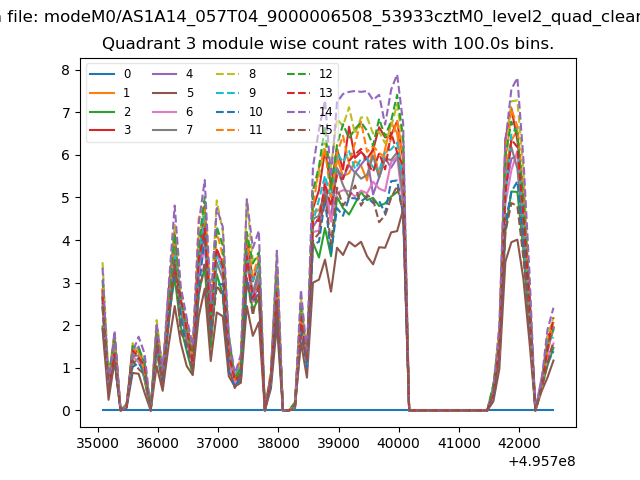
| Module-wise count rates for Quadrant C Data is divided into 100 sec bins |
 |
 |
| Module-wise count rates for Quadrant D Data is divided into 100 sec bins |
 |
 |
| Parameter | Plot |
|---|---|
| CZT HV Monitor | 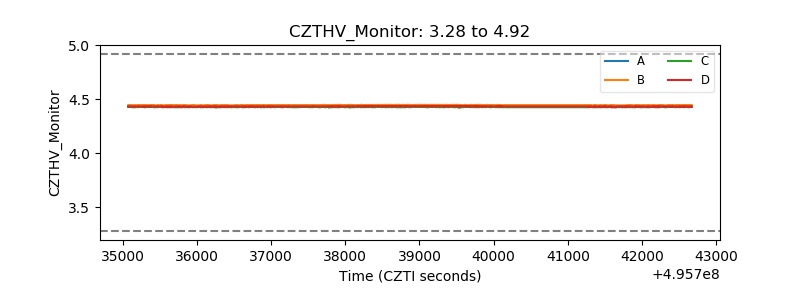 |
| D_VDD | 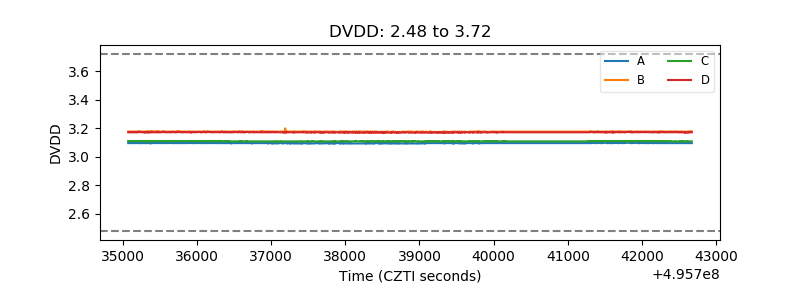 |
| Temperature 1 | 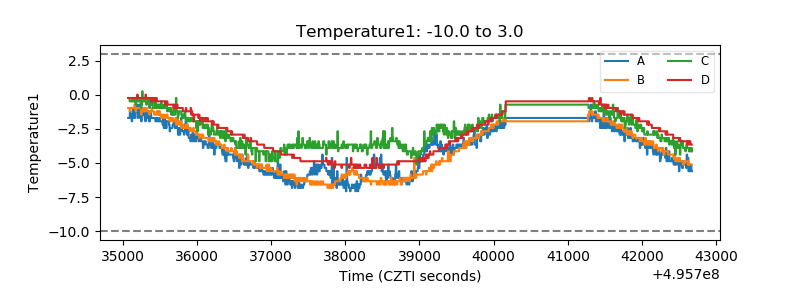 |
| Veto HV Monitor | 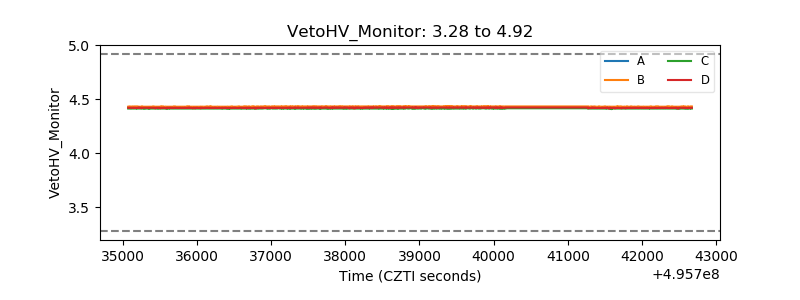 |
| Veto LLD | 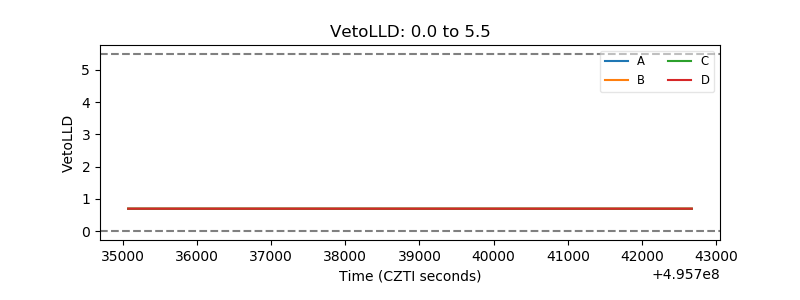 |
| Alpha Counter | 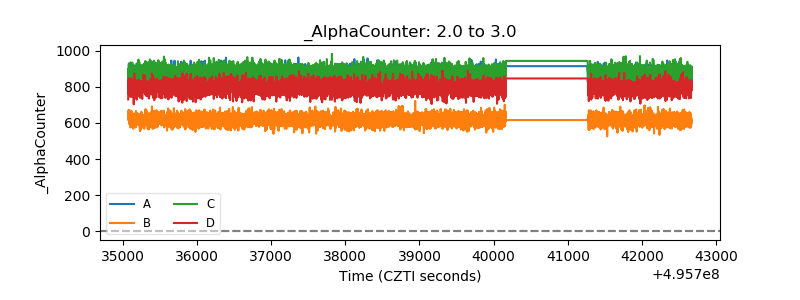 |
| _CPM_Rate | 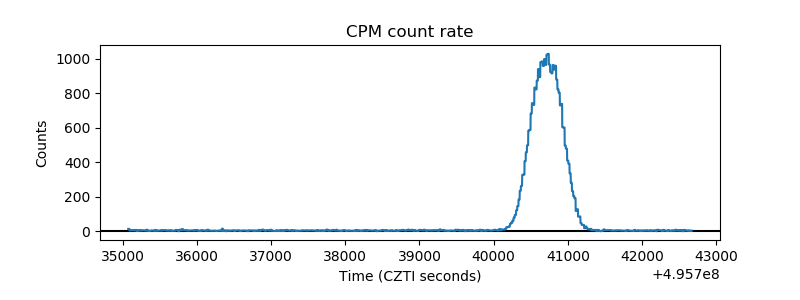 |
| CZT Counter | 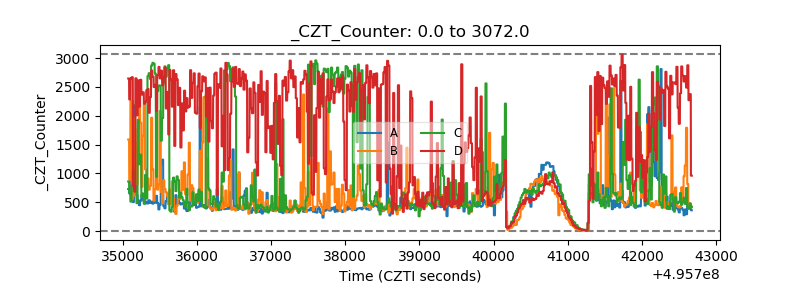 |
| +2.5 Volts monitor | 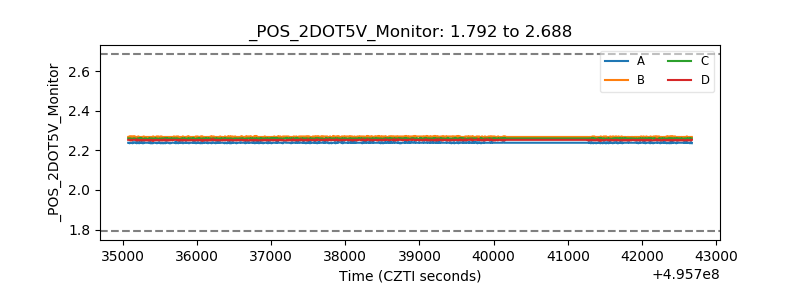 |
| +5 Volts monitor |  |
| _ROLL_ROT | 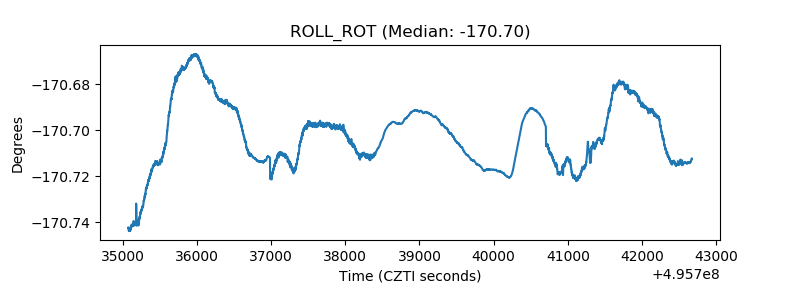 |
| _Roll_DEC | 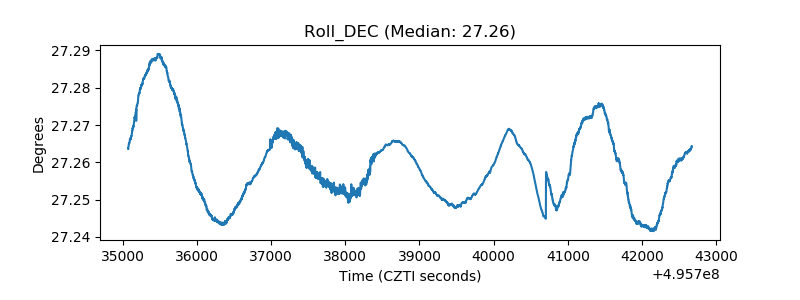 |
| _Roll_RA | 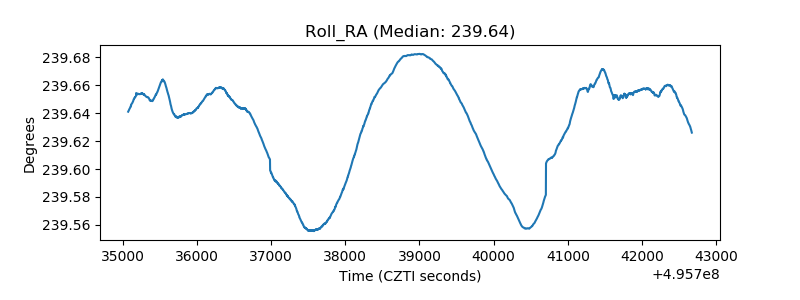 |
| Veto Counter | 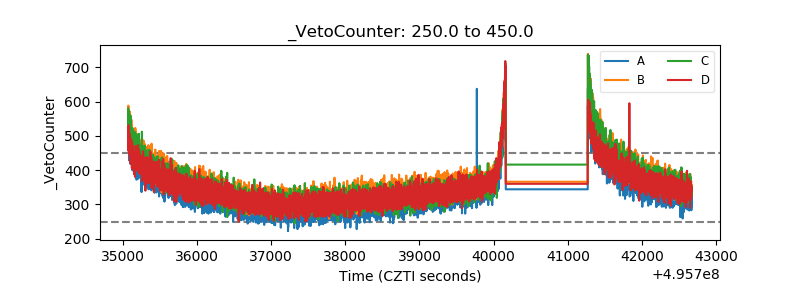 |