| Param | Original file | Final file |
|---|---|---|
| Filename | modeM0/AS1A14_057T04_9000006508_53934cztM0_level2.fits | modeM0/AS1A14_057T04_9000006508_53934cztM0_level2_quad_clean.evt |
| Size (bytes) | 682,577,280 | 84,899,520 |
| Size | 651.0 MB | 81.0 MB |
| Events in quadrant A | 3,663,917 | 637,954 |
| Events in quadrant B | 4,112,770 | 665,023 |
| Events in quadrant C | 4,293,036 | 595,313 |
| Events in quadrant D | 12,702,946 | 228,010 |
| Mode M0 | |||
|---|---|---|---|
| Quadrant | BADHDUFLAG | Total packets | Discarded packets |
| A | 0 | 15368 | 2 |
| B | 0 | 16799 | 2 |
| C | 0 | 17017 | 2 |
| D | 0 | 42121 | 5 |
| Mode SS | |||
|---|---|---|---|
| Quadrant | BADHDUFLAG | Total packets | Discarded packets |
| A | 0 | 130 | 0 |
| B | 0 | 130 | 0 |
| C | 0 | 130 | 0 |
| D | 0 | 130 | 0 |
| Mode M9 | |||
|---|---|---|---|
| Quadrant | BADHDUFLAG | Total packets | Discarded packets |
| A | 0 | 14 | 0 |
| B | 0 | 15 | 0 |
| C | 0 | 15 | 0 |
| D | 0 | 15 | 0 |
| Quadrant | Total seconds | Saturated seconds | Saturation percentage |
|---|---|---|---|
| A | 6363 | 163 | 2.561685% |
| B | 6363 | 341 | 5.359107% |
| C | 6363 | 250 | 3.928964% |
| D | 6362 | 4023 | 63.234832% |
Noise dominated data is calculated using 1-second bins in cleaned event files. If a bin has >2000 counts, and if more than 50% of those come from <1% of pixels, then it is considered to be noise-dominated and hence unusable.
| Quadrant | # 1 sec bins | Bins with >0 counts | Bins with >2000 counts | High rate bins dominated by noise | Noise dominated (total time) | Noise dominated (detector-on time) | Marked lightcurve |
|---|---|---|---|---|---|---|---|
| A | 7568 | 6364 | 143 | 143 | 1.89% | 2.25% | 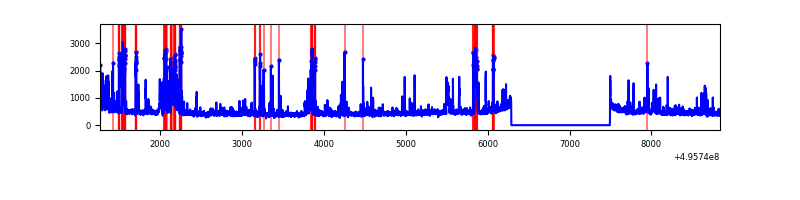 |
| B | 7568 | 6364 | 257 | 257 | 3.40% | 4.04% | 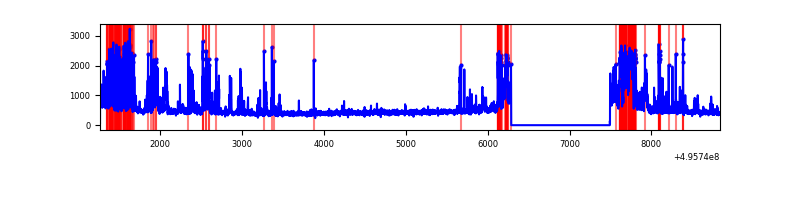 |
| C | 7568 | 6364 | 243 | 243 | 3.21% | 3.82% | 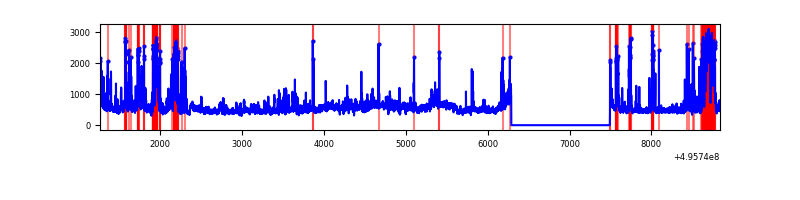 |
| D | 7567 | 6363 | 3695 | 3695 | 48.83% | 58.07% | 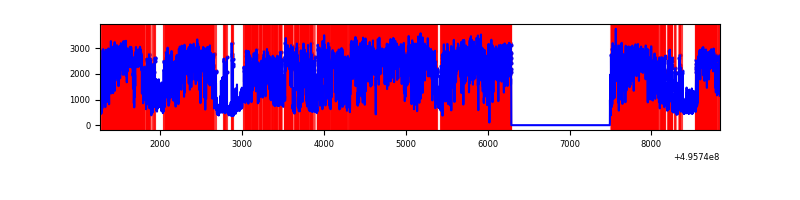 |
Top three noisy pixels from each quadrant. If the there are fewer than three noisy pixels in the level2.evt file, extra rows are filled as -1
| Pixel properties | Quadrant properties | ||||||
|---|---|---|---|---|---|---|---|
| Quadrant | DetID | PixID | Counts | Sigma | Mean | Median | Sigma |
| A | 15 | 174 | 390105 | 2277.65 | 695 | 679 | 171.0 |
| A | 4 | 249 | 312674 | 1824.78 | 695 | 679 | 171.0 |
| A | 0 | 8 | 74406 | 431.21 | 695 | 679 | 171.0 |
| B | 0 | 213 | 329352 | 2230.73 | 686 | 663 | 147.3 |
| B | 5 | 185 | 306541 | 2075.92 | 686 | 663 | 147.3 |
| B | 1 | 223 | 287768 | 1948.51 | 686 | 663 | 147.3 |
| C | 1 | 241 | 711886 | 3837.12 | 675 | 669 | 185.4 |
| C | 9 | 38 | 530584 | 2858.97 | 675 | 669 | 185.4 |
| C | 12 | 252 | 195582 | 1051.58 | 675 | 669 | 185.4 |
| D | 8 | 176 | 8387381 | 74676.13 | 380 | 361 | 112.3 |
| D | 6 | 239 | 978695 | 8710.86 | 380 | 361 | 112.3 |
| D | 2 | 165 | 537047 | 4778.53 | 380 | 361 | 112.3 |
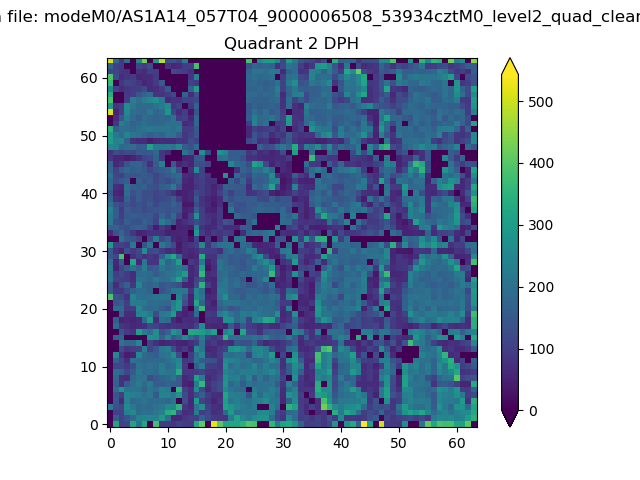
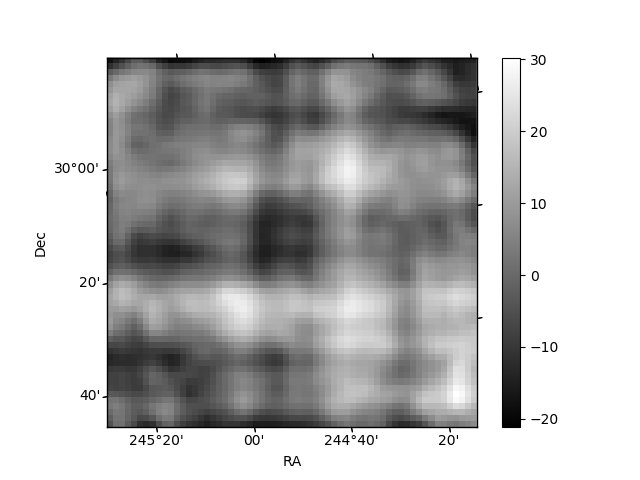
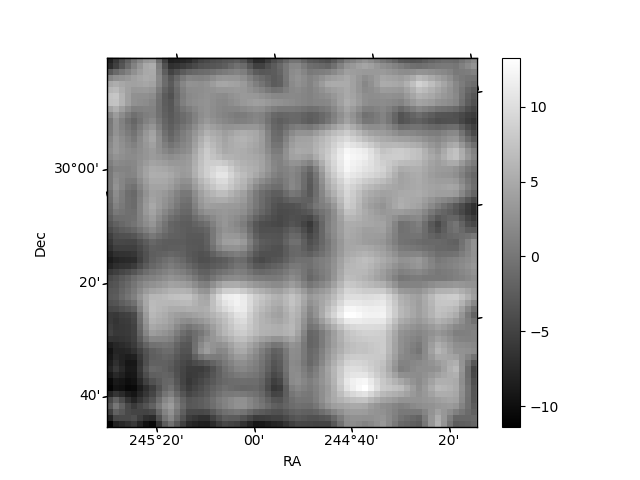
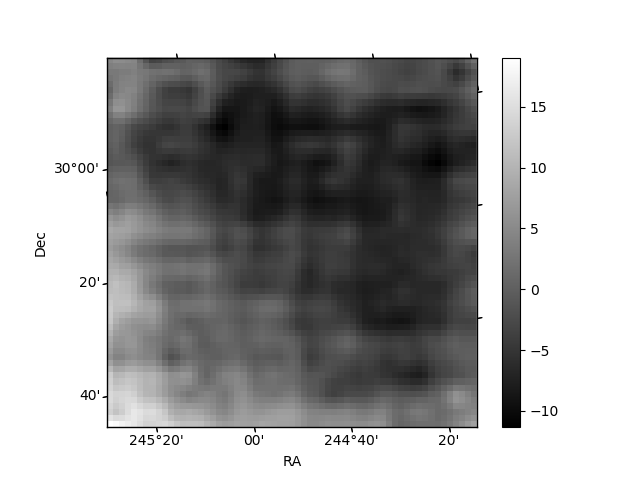
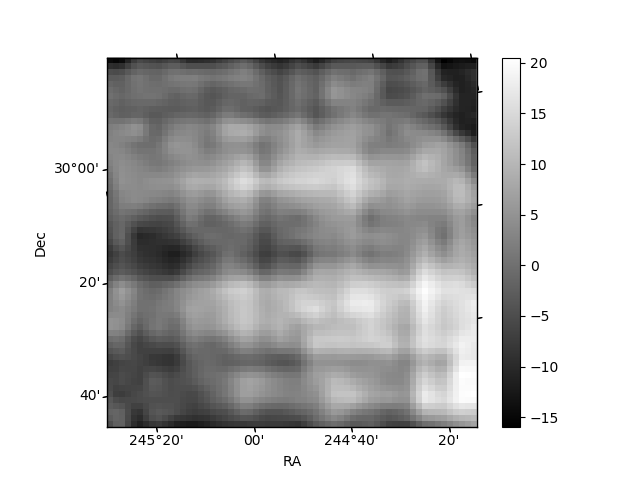
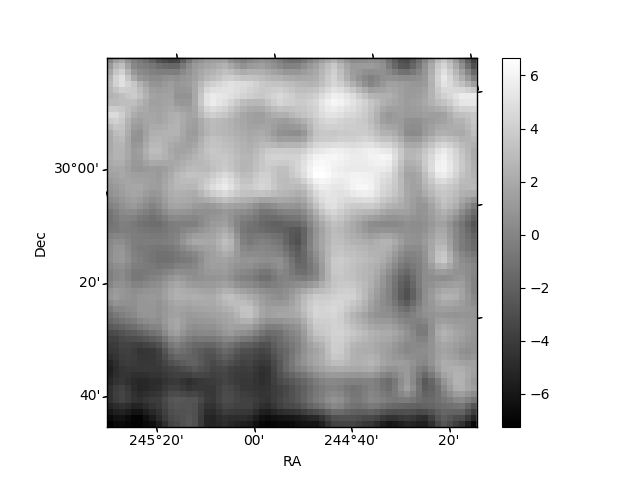
Histogram calculated using DETX and DETY for each event in the final _common_clean file
| Quadrant A | 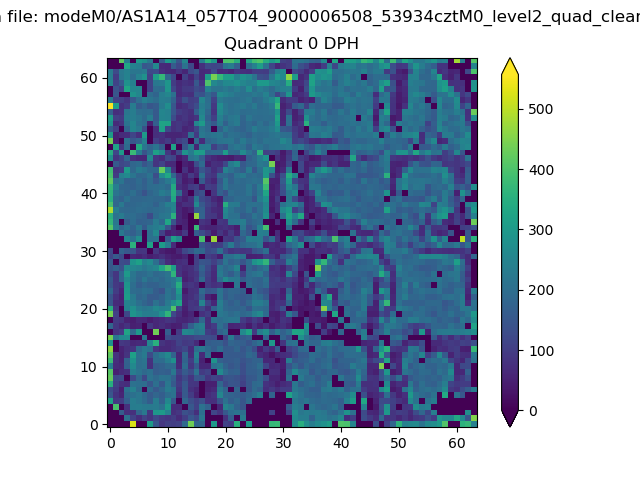 |
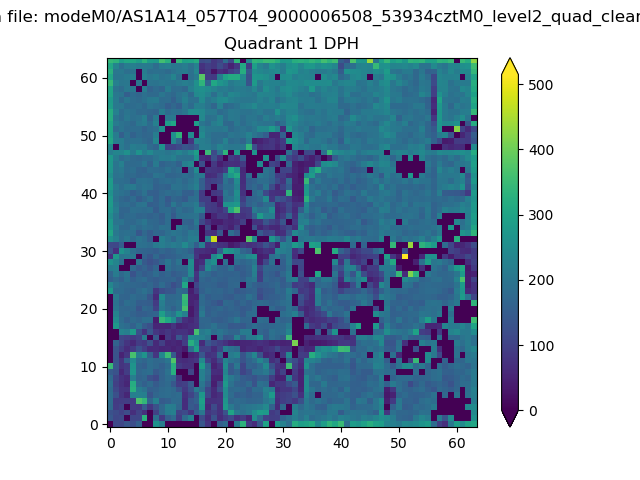 |
Quadrant B |
|---|---|---|---|
| Quadrant D | 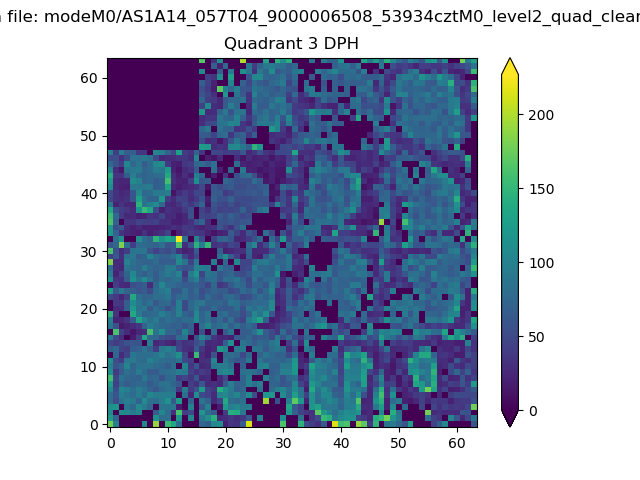 |
 |
Quadrant C |
| Plot type | Count rate plots | Images |
|---|---|---|
| Comparison with Poisson distribution Blue bars denote a histogram of data divided into 1 sec bins. Red curve is a Poisson curve with rate = median count rate of data. |
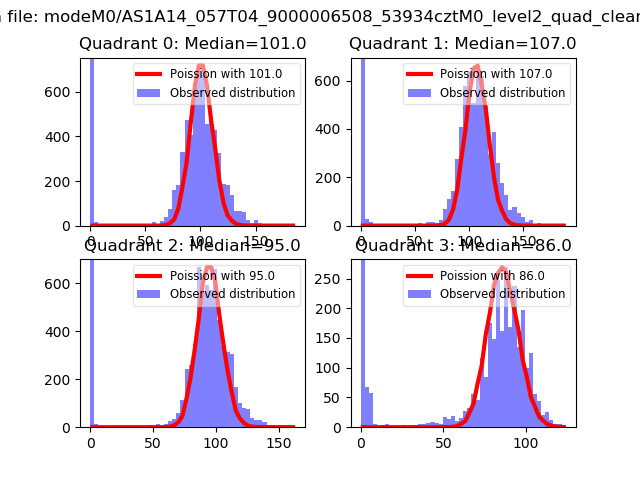 |
 |
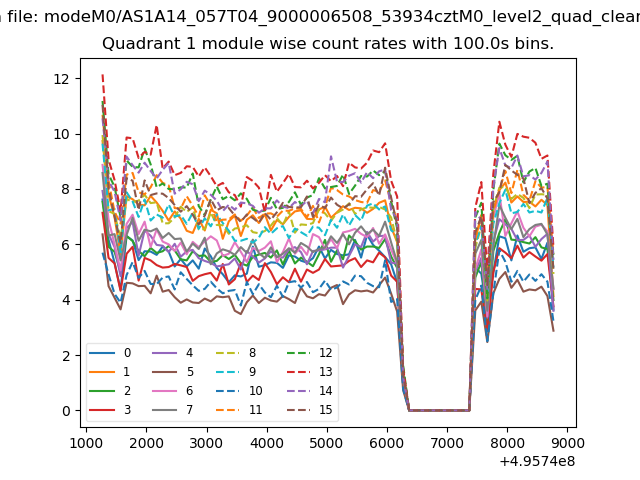
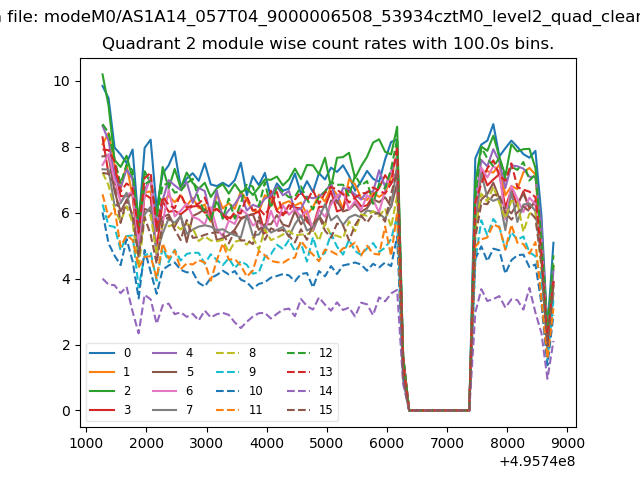
| Quadrant-wise count rates Data is divided into 100 sec bins |
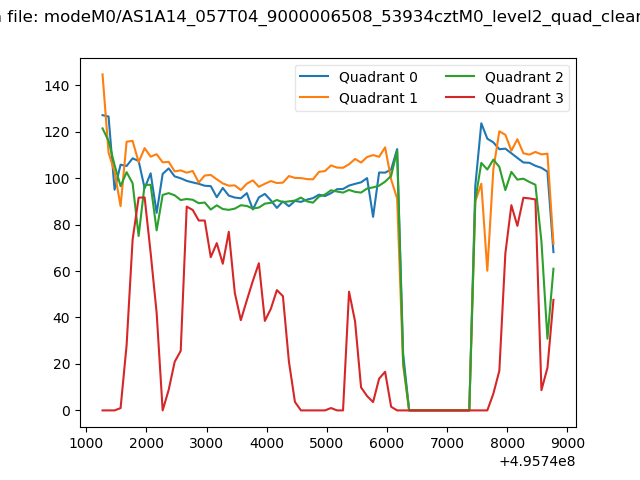 |
|
| Module-wise count rates for Quadrant A Data is divided into 100 sec bins |
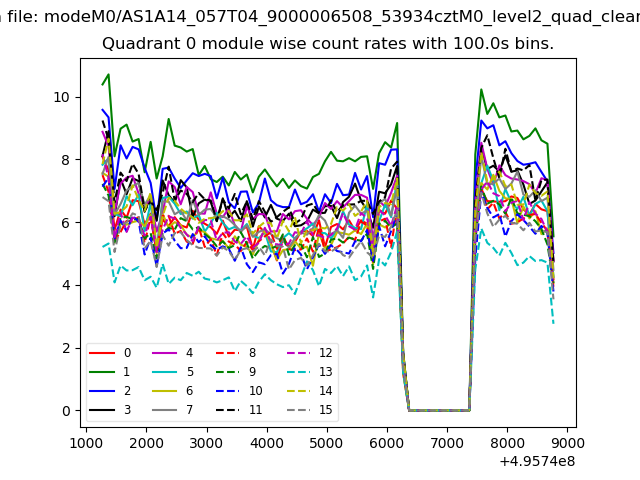 |
 |
| Module-wise count rates for Quadrant B Data is divided into 100 sec bins |
 |
 |
| Module-wise count rates for Quadrant C Data is divided into 100 sec bins |
 |
 |
| Module-wise count rates for Quadrant D Data is divided into 100 sec bins |
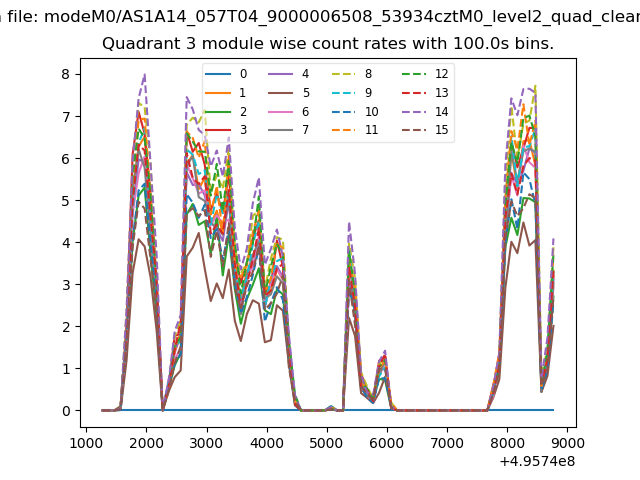 |
 |
| Parameter | Plot |
|---|---|
| CZT HV Monitor | 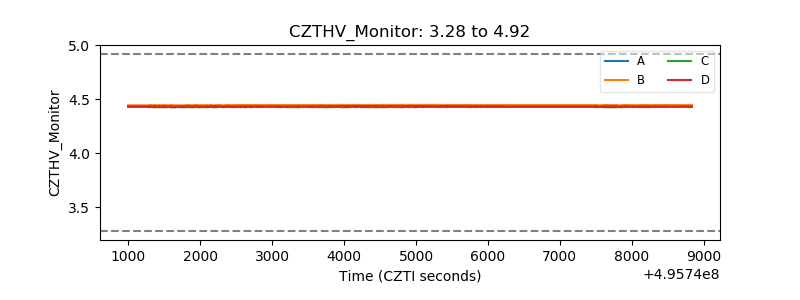 |
| D_VDD |  |
| Temperature 1 | 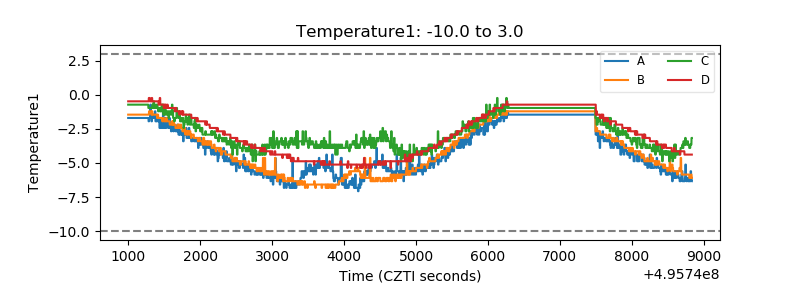 |
| Veto HV Monitor | 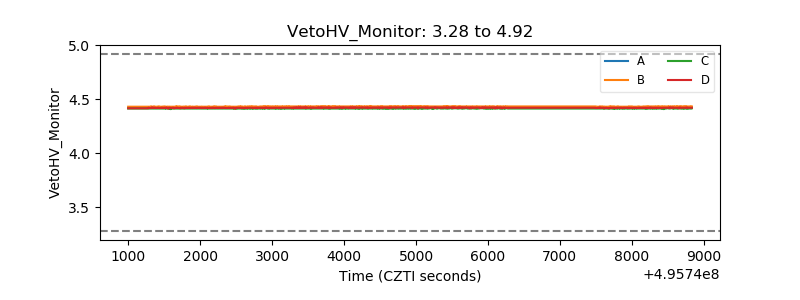 |
| Veto LLD | 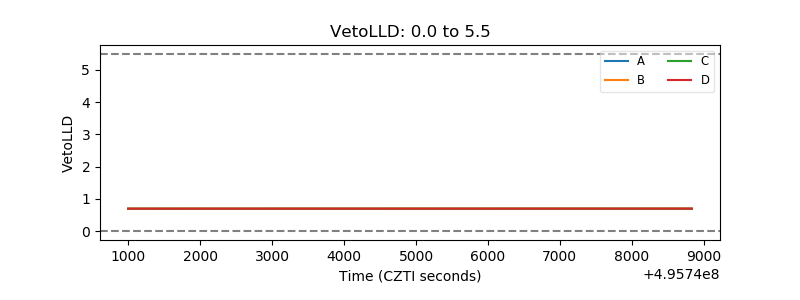 |
| Alpha Counter | 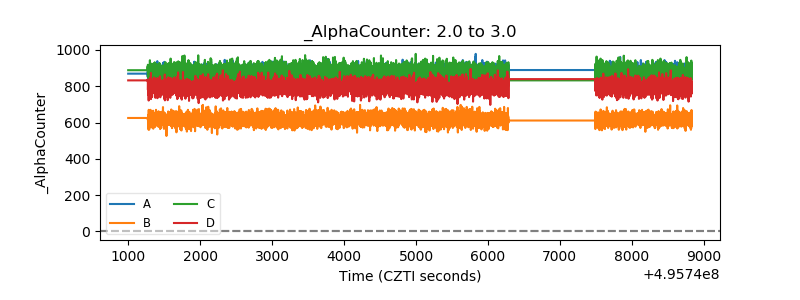 |
| _CPM_Rate | 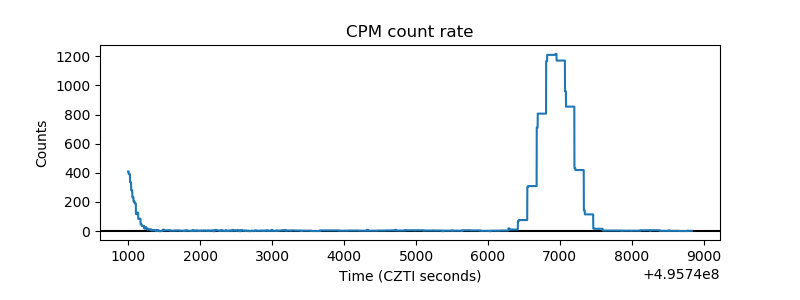 |
| CZT Counter | 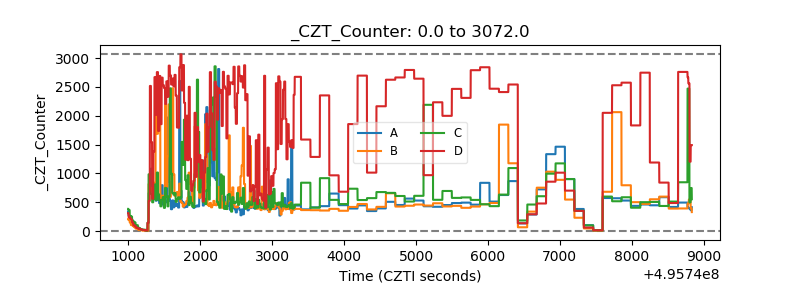 |
| +2.5 Volts monitor | 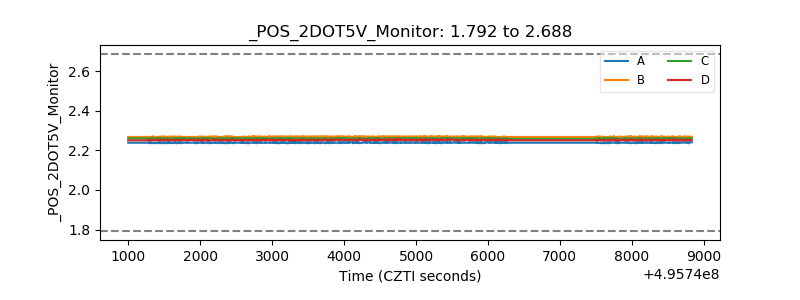 |
| +5 Volts monitor | 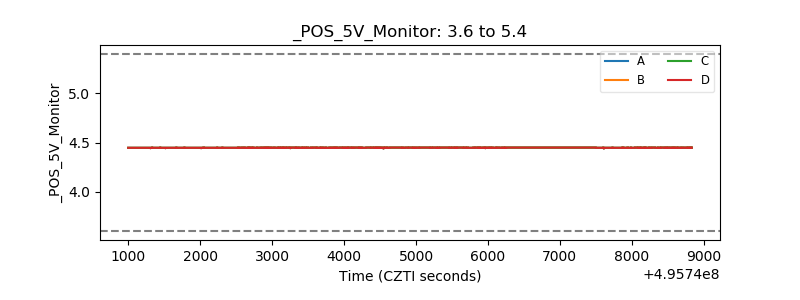 |
| _ROLL_ROT | 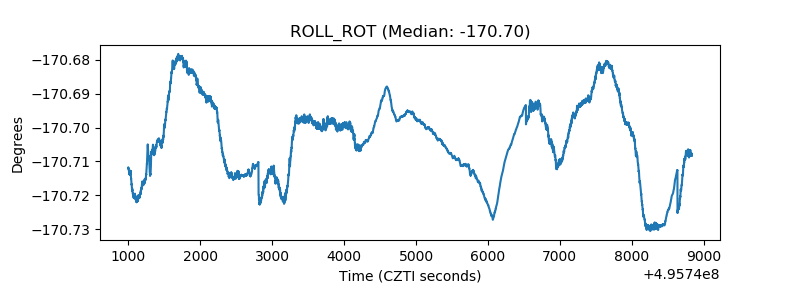 |
| _Roll_DEC | 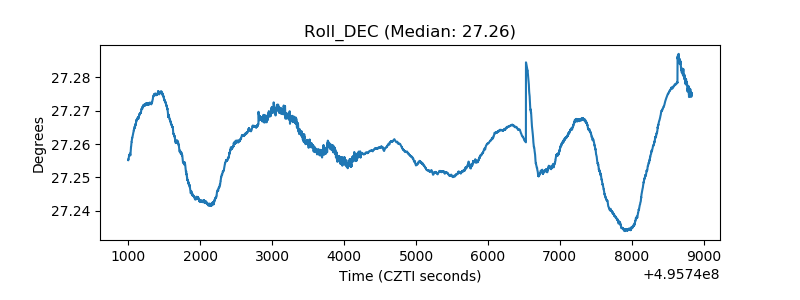 |
| _Roll_RA | 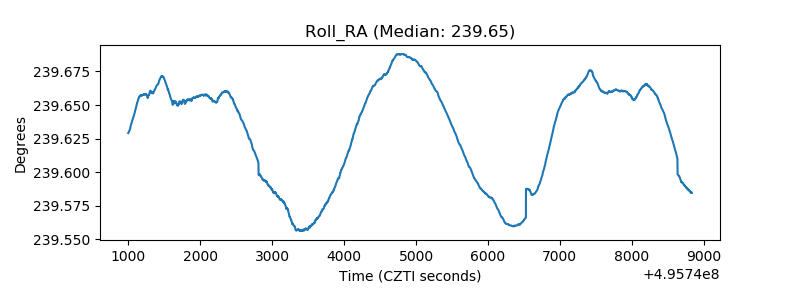 |
| Veto Counter | 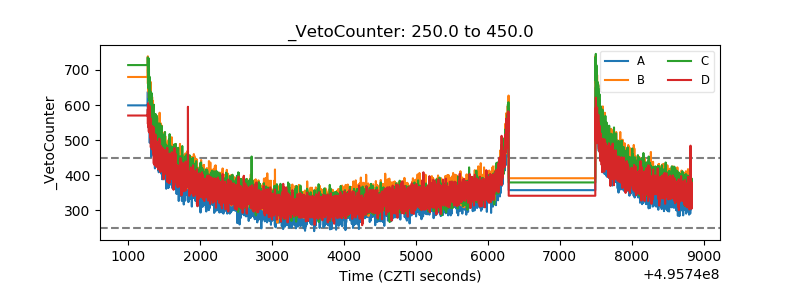 |