| Param | Original file | Final file |
|---|---|---|
| Filename | modeM0/AS1A14_057T04_9000006508_53936cztM0_level2.fits | modeM0/AS1A14_057T04_9000006508_53936cztM0_level2_quad_clean.evt |
| Size (bytes) | 640,592,640 | 91,039,680 |
| Size | 610.9 MB | 86.8 MB |
| Events in quadrant A | 3,846,513 | 660,951 |
| Events in quadrant B | 3,811,278 | 703,999 |
| Events in quadrant C | 4,739,236 | 577,491 |
| Events in quadrant D | 10,792,330 | 344,399 |
| Mode M0 | |||
|---|---|---|---|
| Quadrant | BADHDUFLAG | Total packets | Discarded packets |
| A | 0 | 16264 | 2 |
| B | 0 | 16143 | 3 |
| C | 0 | 18814 | 2 |
| D | 0 | 36709 | 2 |
| Mode SS | |||
|---|---|---|---|
| Quadrant | BADHDUFLAG | Total packets | Discarded packets |
| A | 0 | 138 | 0 |
| B | 0 | 138 | 0 |
| C | 0 | 138 | 0 |
| D | 0 | 138 | 0 |
| Mode M9 | |||
|---|---|---|---|
| Quadrant | BADHDUFLAG | Total packets | Discarded packets |
| A | 0 | 21 | 0 |
| B | 0 | 22 | 0 |
| C | 0 | 22 | 0 |
| D | 0 | 22 | 0 |
| Quadrant | Total seconds | Saturated seconds | Saturation percentage |
|---|---|---|---|
| A | 6733 | 232 | 3.445715% |
| B | 6732 | 227 | 3.371955% |
| C | 6732 | 683 | 10.145573% |
| D | 6732 | 3098 | 46.019014% |
Noise dominated data is calculated using 1-second bins in cleaned event files. If a bin has >2000 counts, and if more than 50% of those come from <1% of pixels, then it is considered to be noise-dominated and hence unusable.
| Quadrant | # 1 sec bins | Bins with >0 counts | Bins with >2000 counts | High rate bins dominated by noise | Noise dominated (total time) | Noise dominated (detector-on time) | Marked lightcurve |
|---|---|---|---|---|---|---|---|
| A | 7893 | 6734 | 198 | 198 | 2.51% | 2.94% | 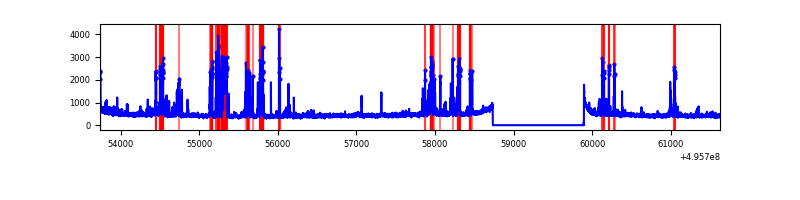 |
| B | 7892 | 6732 | 118 | 118 | 1.50% | 1.75% | 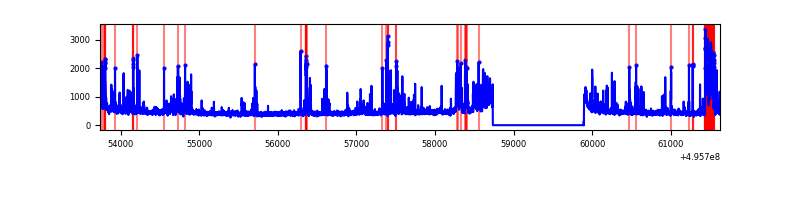 |
| C | 7892 | 6733 | 662 | 662 | 8.39% | 9.83% | 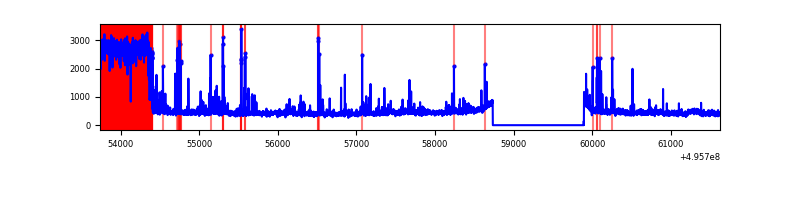 |
| D | 7892 | 6732 | 2485 | 2485 | 31.49% | 36.91% | 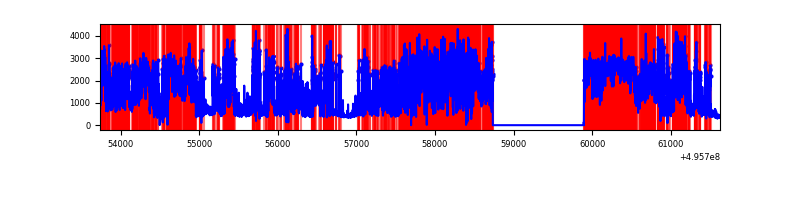 |
Top three noisy pixels from each quadrant. If the there are fewer than three noisy pixels in the level2.evt file, extra rows are filled as -1
| Pixel properties | Quadrant properties | ||||||
|---|---|---|---|---|---|---|---|
| Quadrant | DetID | PixID | Counts | Sigma | Mean | Median | Sigma |
| A | 0 | 8 | 473542 | 2632.89 | 732 | 715 | 179.6 |
| A | 15 | 174 | 255423 | 1418.32 | 732 | 715 | 179.6 |
| A | 4 | 249 | 103469 | 572.18 | 732 | 715 | 179.6 |
| B | 0 | 213 | 578696 | 3681.08 | 735 | 707 | 157.0 |
| B | 5 | 185 | 92097 | 582.04 | 735 | 707 | 157.0 |
| B | 5 | 250 | 74889 | 472.45 | 735 | 707 | 157.0 |
| C | 1 | 241 | 1643062 | 8786.63 | 676 | 670 | 186.9 |
| C | 12 | 252 | 134894 | 718.08 | 676 | 670 | 186.9 |
| C | 9 | 38 | 96875 | 514.69 | 676 | 670 | 186.9 |
| D | 8 | 176 | 6400753 | 43490.17 | 502 | 478 | 147.2 |
| D | 10 | 172 | 776839 | 5275.41 | 502 | 478 | 147.2 |
| D | 3 | 12 | 719945 | 4888.81 | 502 | 478 | 147.2 |
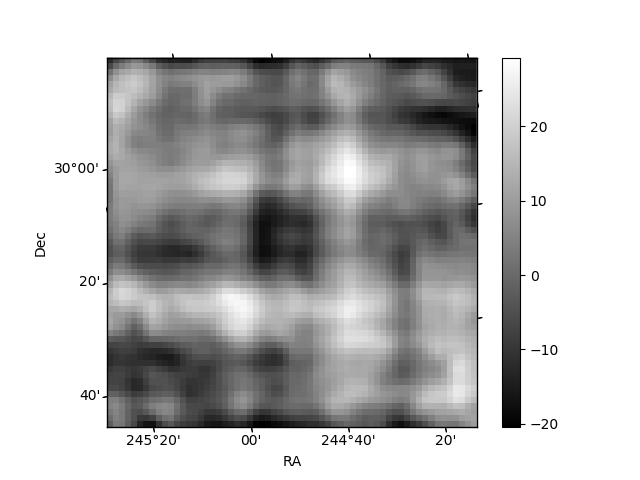
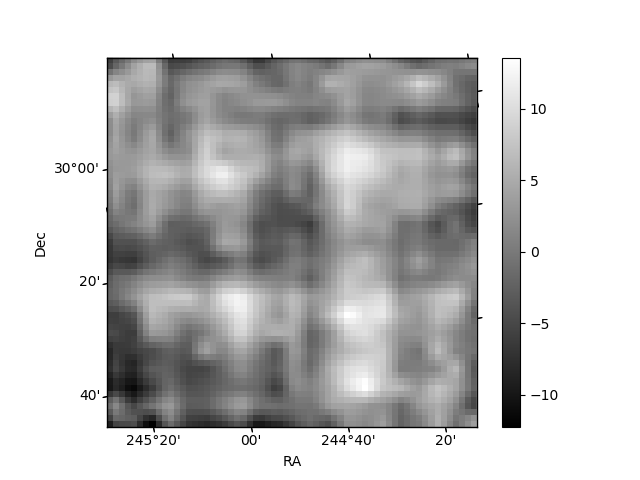
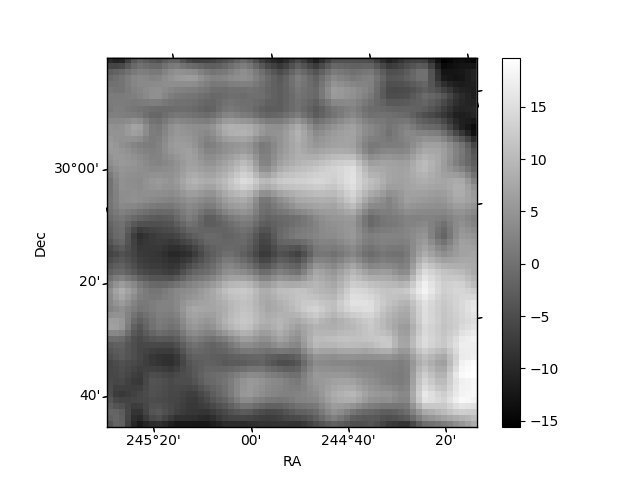
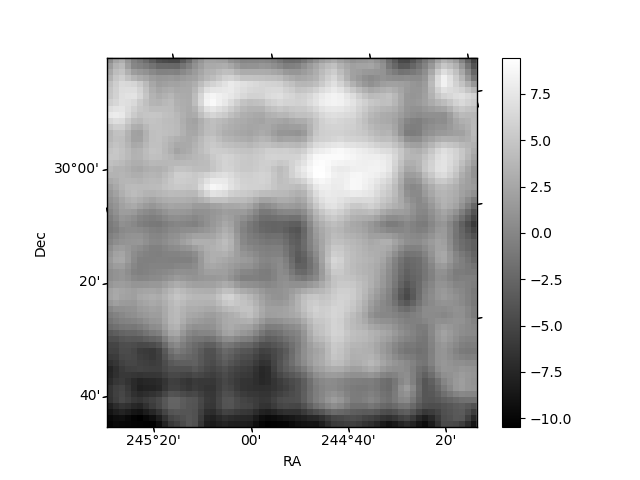
Histogram calculated using DETX and DETY for each event in the final _common_clean file
| Quadrant A | 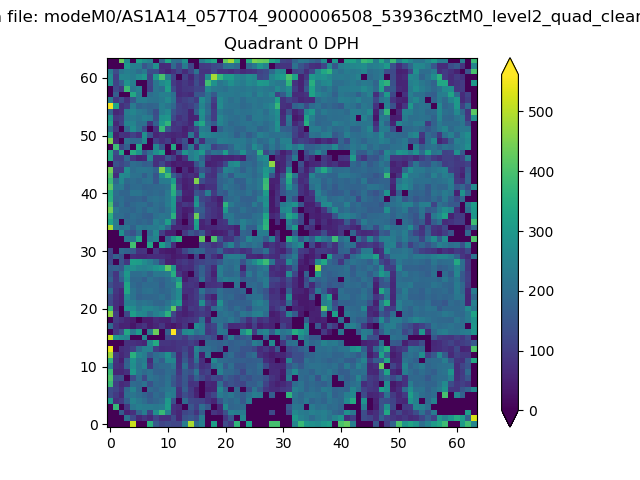 |
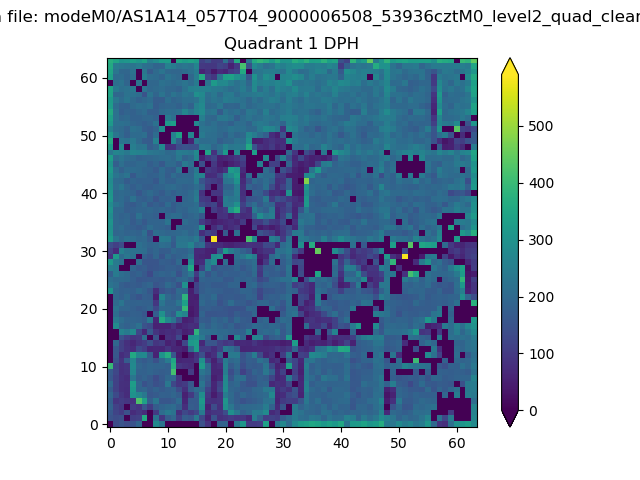 |
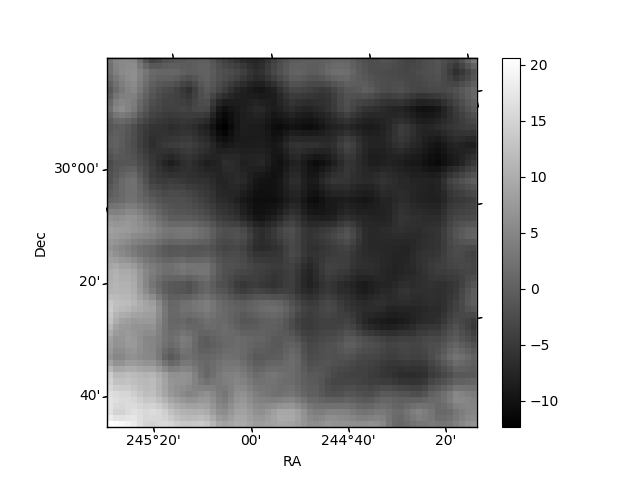
Quadrant B |
|---|---|---|---|
| Quadrant D | 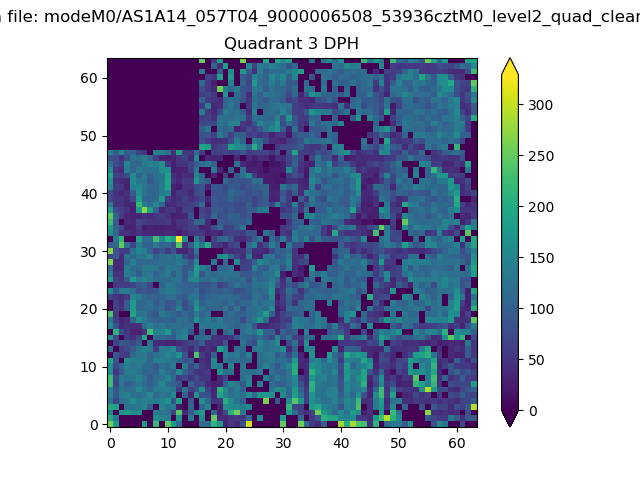 |
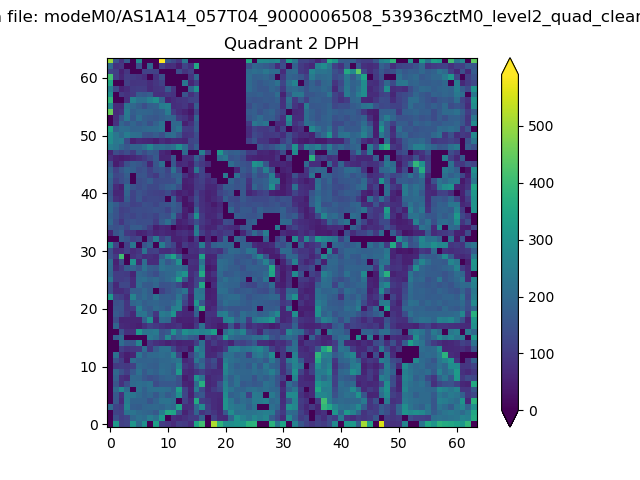 |
Quadrant C |
| Plot type | Count rate plots | Images |
|---|---|---|
| Comparison with Poisson distribution Blue bars denote a histogram of data divided into 1 sec bins. Red curve is a Poisson curve with rate = median count rate of data. |
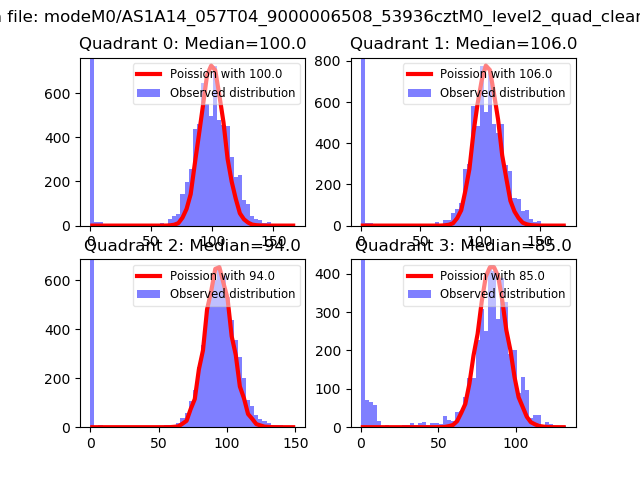 |
 |
| Quadrant-wise count rates Data is divided into 100 sec bins |
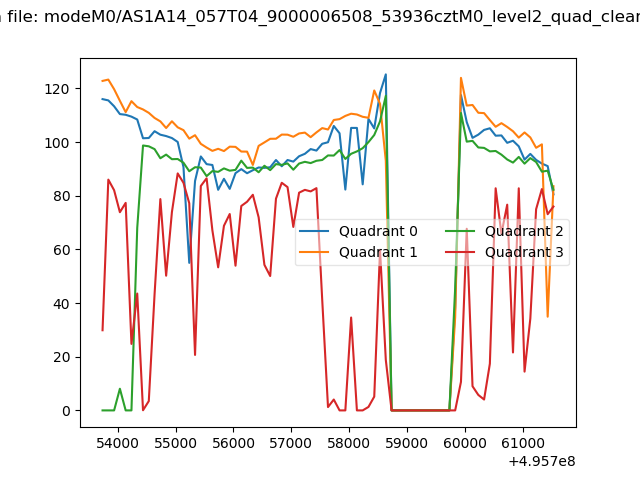 |
|
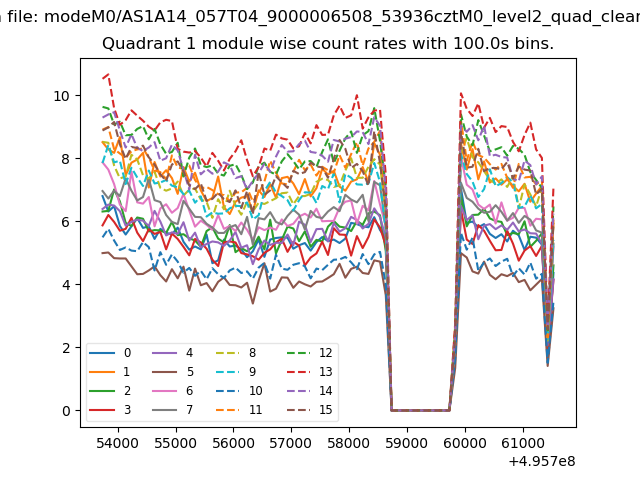
| Module-wise count rates for Quadrant A Data is divided into 100 sec bins |
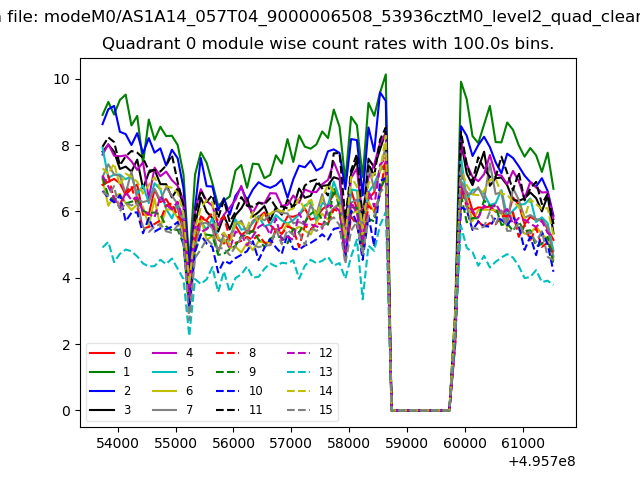 |
 |
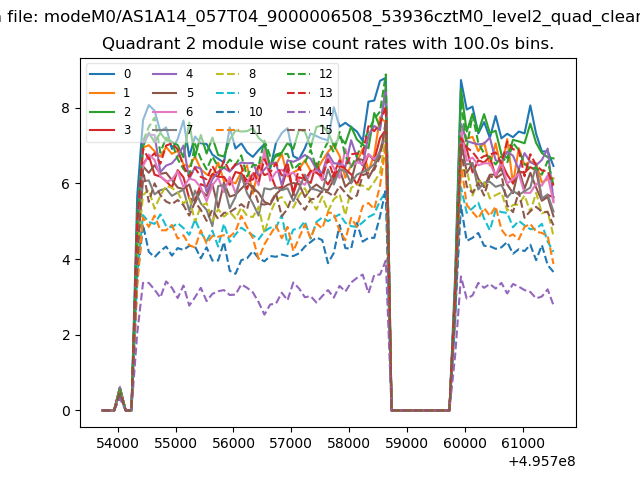
| Module-wise count rates for Quadrant B Data is divided into 100 sec bins |
 |
 |
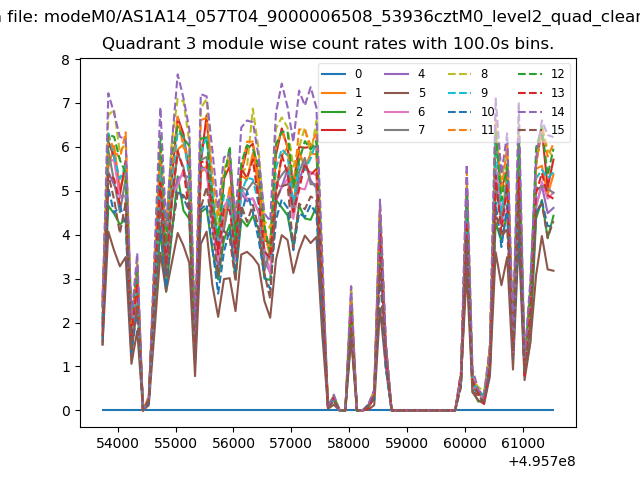
| Module-wise count rates for Quadrant C Data is divided into 100 sec bins |
 |
 |
| Module-wise count rates for Quadrant D Data is divided into 100 sec bins |
 |
 |
| Parameter | Plot |
|---|---|
| CZT HV Monitor | 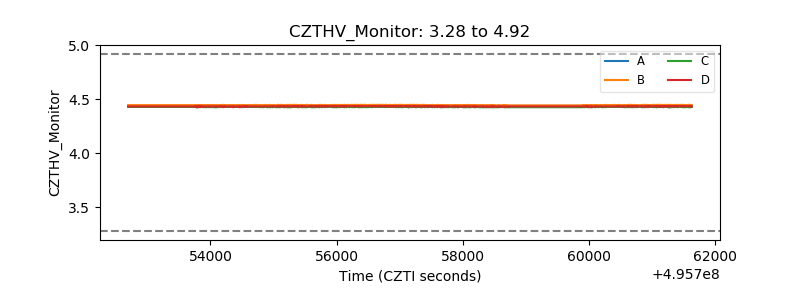 |
| D_VDD | 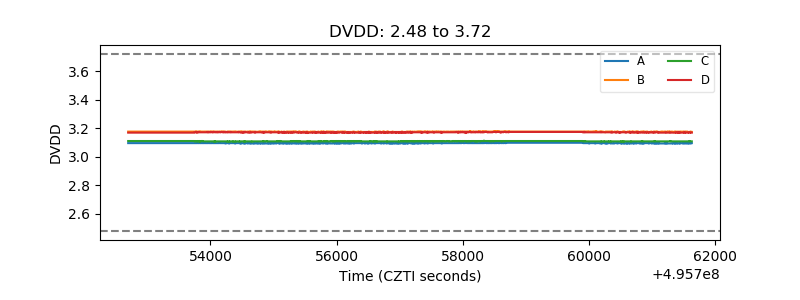 |
| Temperature 1 | 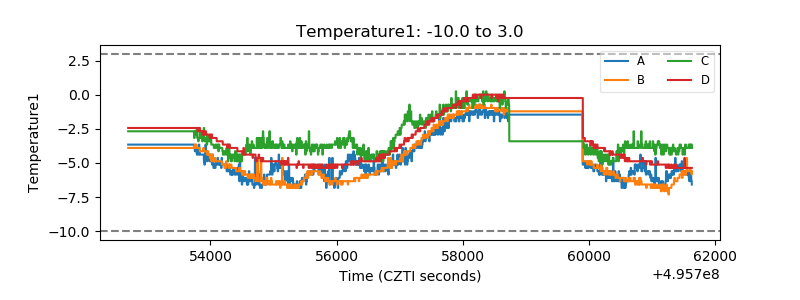 |
| Veto HV Monitor | 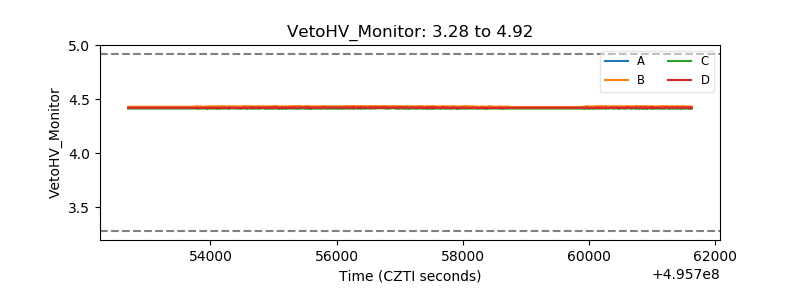 |
| Veto LLD | 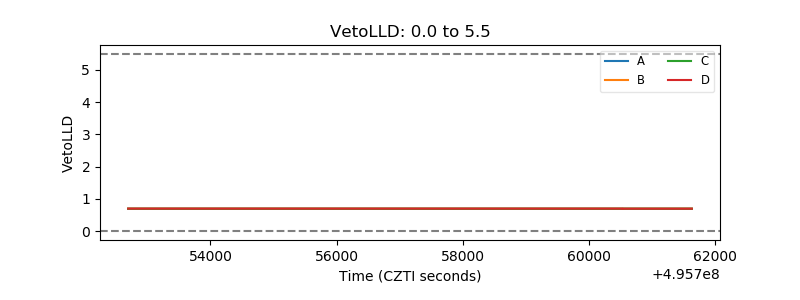 |
| Alpha Counter | 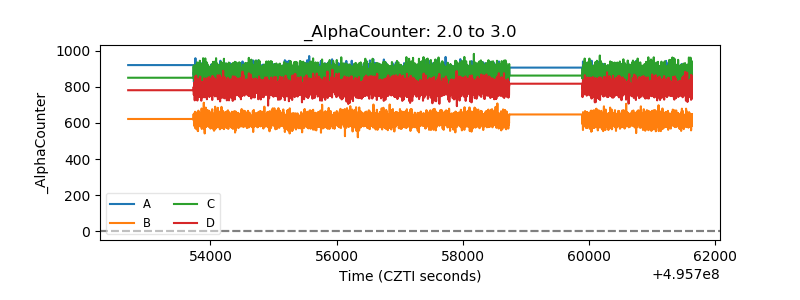 |
| _CPM_Rate | 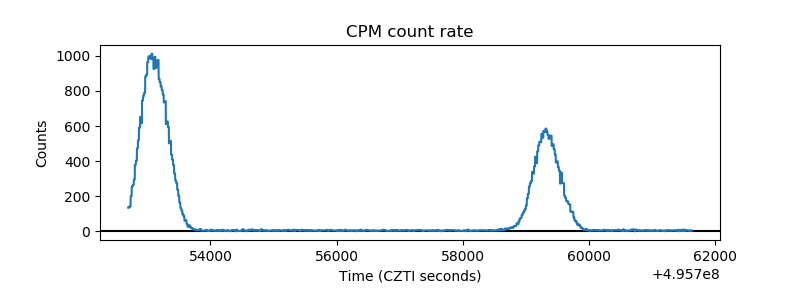 |
| CZT Counter | 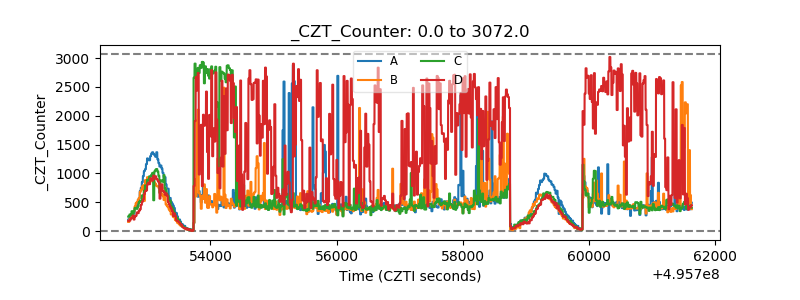 |
| +2.5 Volts monitor | 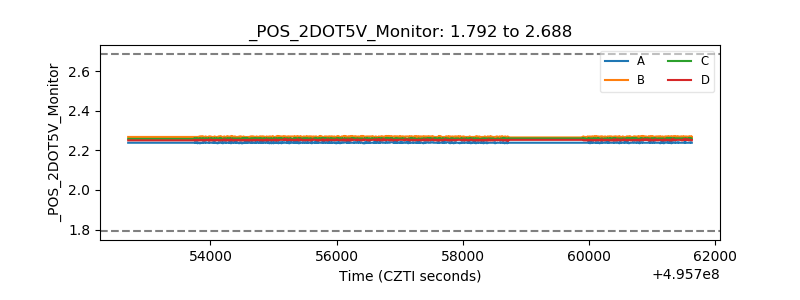 |
| +5 Volts monitor |  |
| _ROLL_ROT | 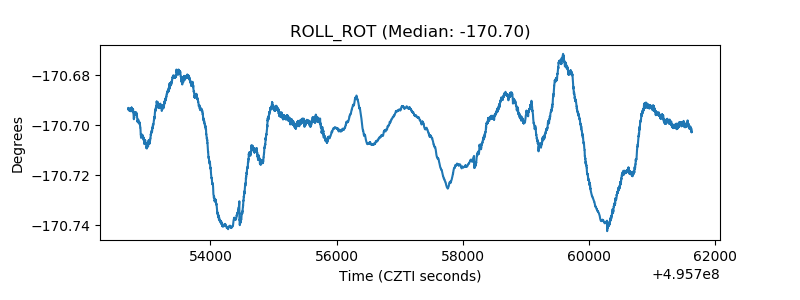 |
| _Roll_DEC | 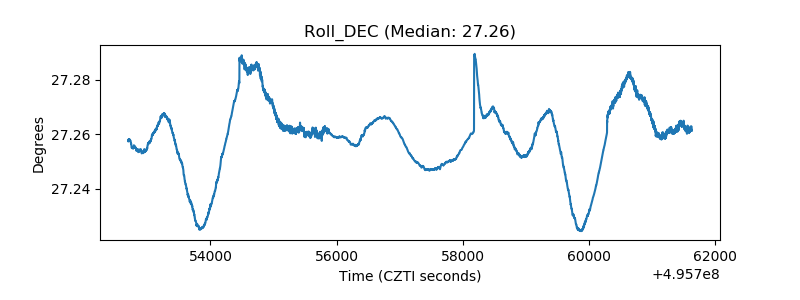 |
| _Roll_RA | 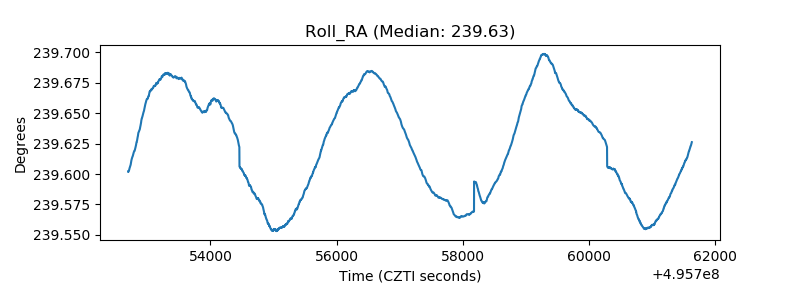 |
| Veto Counter | 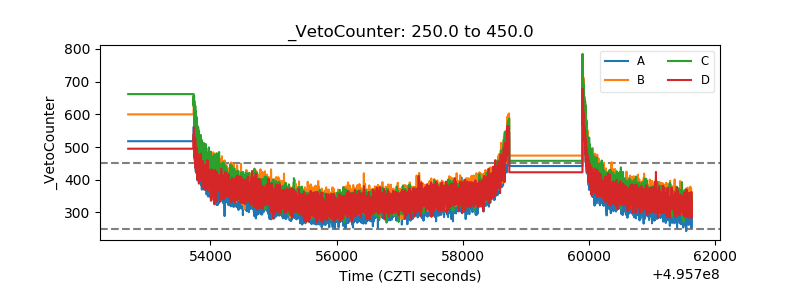 |