| Param | Original file | Final file |
|---|---|---|
| Filename | modeM0/AS1A14_057T04_9000006508_53937cztM0_level2.fits | modeM0/AS1A14_057T04_9000006508_53937cztM0_level2_quad_clean.evt |
| Size (bytes) | 654,730,560 | 91,048,320 |
| Size | 624.4 MB | 86.8 MB |
| Events in quadrant A | 4,348,334 | 649,733 |
| Events in quadrant B | 3,836,954 | 693,014 |
| Events in quadrant C | 3,633,643 | 626,599 |
| Events in quadrant D | 11,885,203 | 310,368 |
| Mode M0 | |||
|---|---|---|---|
| Quadrant | BADHDUFLAG | Total packets | Discarded packets |
| A | 0 | 17717 | 2 |
| B | 0 | 16340 | 2 |
| C | 0 | 15741 | 2 |
| D | 0 | 40060 | 2 |
| Mode SS | |||
|---|---|---|---|
| Quadrant | BADHDUFLAG | Total packets | Discarded packets |
| A | 0 | 142 | 0 |
| B | 0 | 142 | 0 |
| C | 0 | 142 | 0 |
| D | 0 | 142 | 0 |
| Mode M9 | |||
|---|---|---|---|
| Quadrant | BADHDUFLAG | Total packets | Discarded packets |
| A | 0 | 19 | 0 |
| B | 0 | 19 | 0 |
| C | 0 | 20 | 0 |
| D | 0 | 20 | 0 |
| Quadrant | Total seconds | Saturated seconds | Saturation percentage |
|---|---|---|---|
| A | 6849 | 202 | 2.949336% |
| B | 6849 | 293 | 4.277997% |
| C | 6849 | 202 | 2.949336% |
| D | 6849 | 3430 | 50.080304% |
Noise dominated data is calculated using 1-second bins in cleaned event files. If a bin has >2000 counts, and if more than 50% of those come from <1% of pixels, then it is considered to be noise-dominated and hence unusable.
| Quadrant | # 1 sec bins | Bins with >0 counts | Bins with >2000 counts | High rate bins dominated by noise | Noise dominated (total time) | Noise dominated (detector-on time) | Marked lightcurve |
|---|---|---|---|---|---|---|---|
| A | 7844 | 6852 | 79 | 79 | 1.01% | 1.15% | 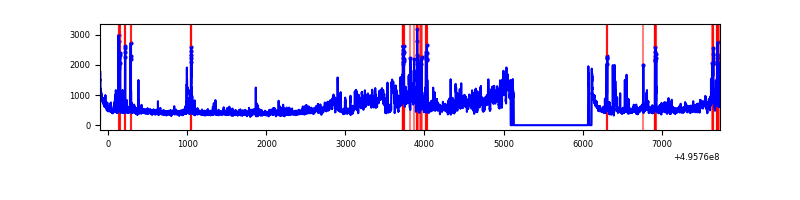 |
| B | 7844 | 6851 | 123 | 123 | 1.57% | 1.80% | 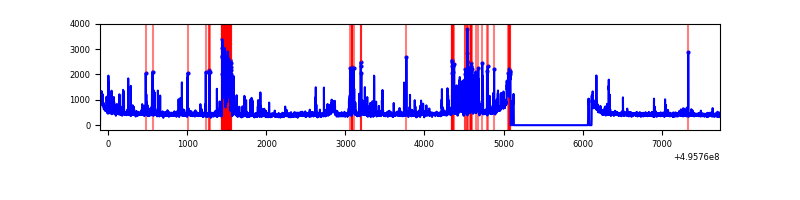 |
| C | 7844 | 6852 | 157 | 157 | 2.00% | 2.29% | 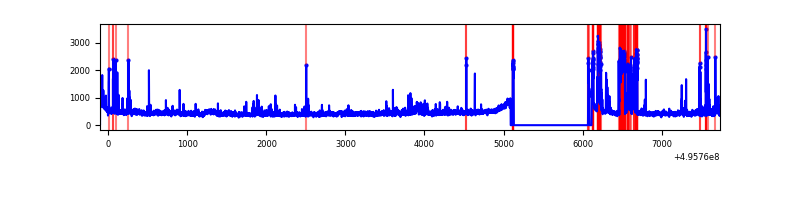 |
| D | 7844 | 6852 | 3360 | 3360 | 42.84% | 49.04% | 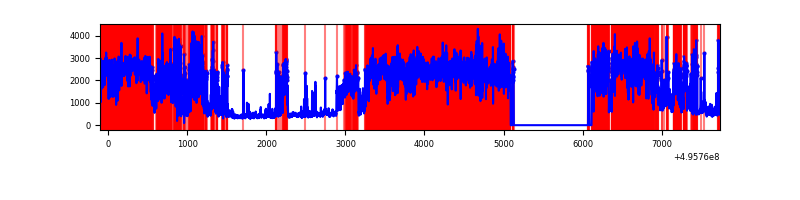 |
Top three noisy pixels from each quadrant. If the there are fewer than three noisy pixels in the level2.evt file, extra rows are filled as -1
| Pixel properties | Quadrant properties | ||||||
|---|---|---|---|---|---|---|---|
| Quadrant | DetID | PixID | Counts | Sigma | Mean | Median | Sigma |
| A | 14 | 235 | 828703 | 4522.27 | 751 | 733 | 183.1 |
| A | 15 | 174 | 309587 | 1686.92 | 751 | 733 | 183.1 |
| A | 0 | 8 | 97472 | 528.38 | 751 | 733 | 183.1 |
| B | 0 | 213 | 697090 | 4354.64 | 744 | 718 | 159.9 |
| B | 5 | 236 | 46121 | 283.92 | 744 | 718 | 159.9 |
| B | 5 | 185 | 38714 | 237.6 | 744 | 718 | 159.9 |
| C | 1 | 241 | 441720 | 2208.97 | 729 | 722 | 199.6 |
| C | 9 | 38 | 99310 | 493.83 | 729 | 722 | 199.6 |
| C | 12 | 252 | 71094 | 352.5 | 729 | 722 | 199.6 |
| D | 8 | 176 | 6360173 | 41786.46 | 530 | 506 | 152.2 |
| D | 10 | 172 | 1661976 | 10916.76 | 530 | 506 | 152.2 |
| D | 2 | 165 | 1123290 | 7377.3 | 530 | 506 | 152.2 |
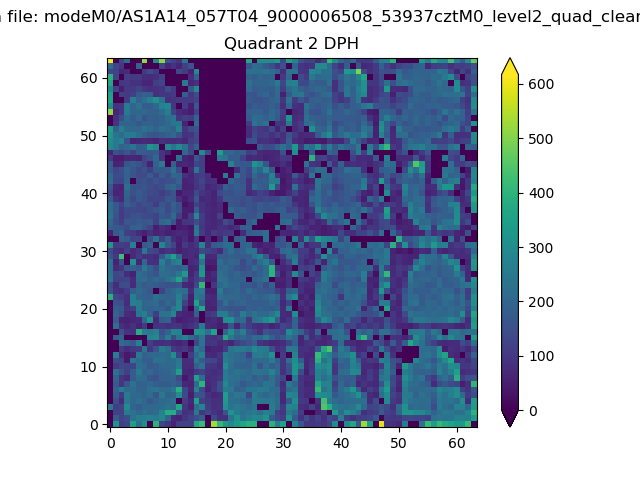
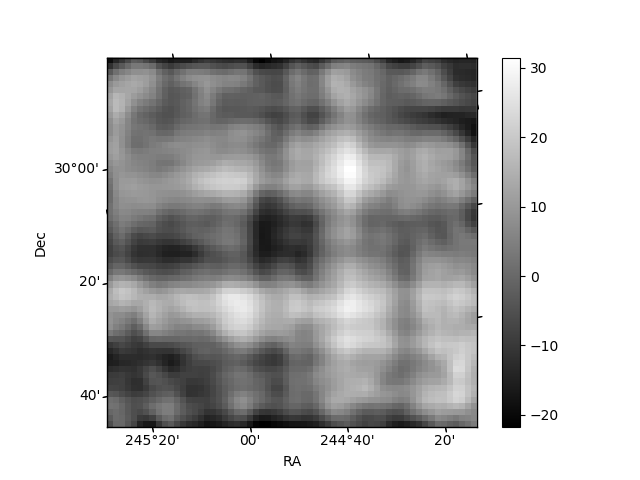
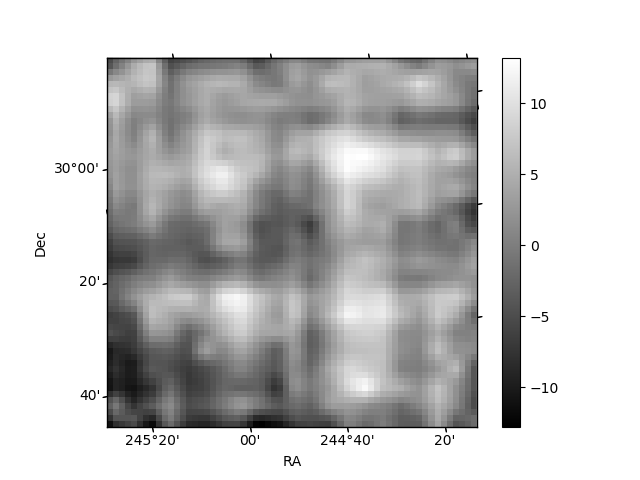
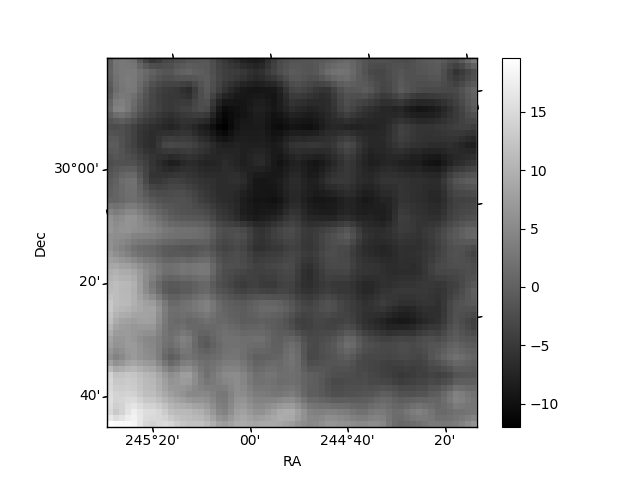
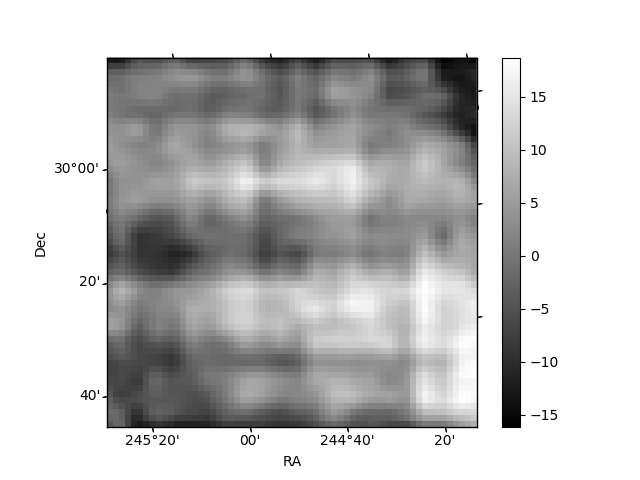
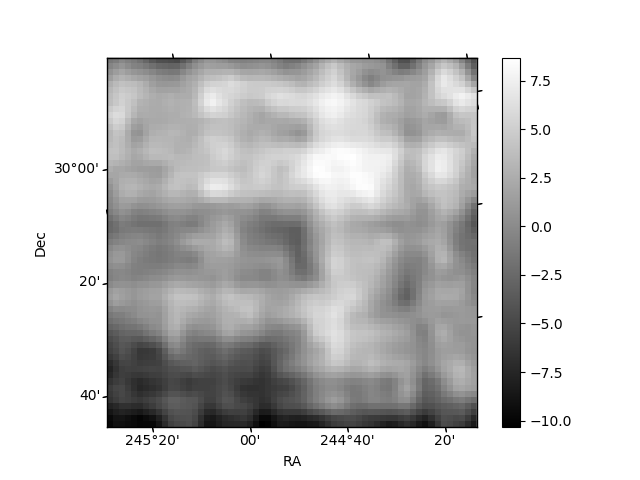
Histogram calculated using DETX and DETY for each event in the final _common_clean file
| Quadrant A | 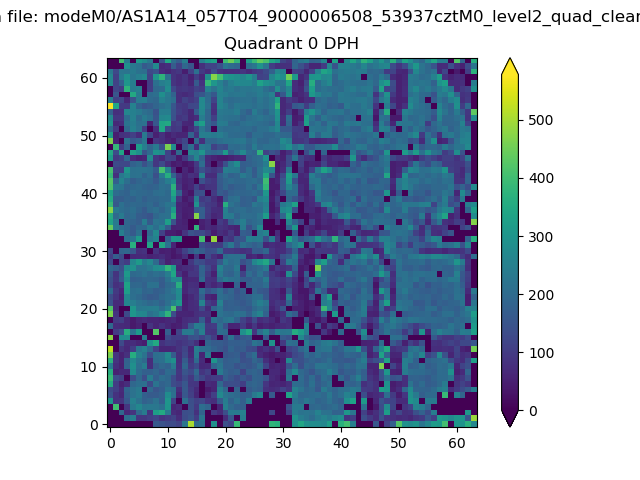 |
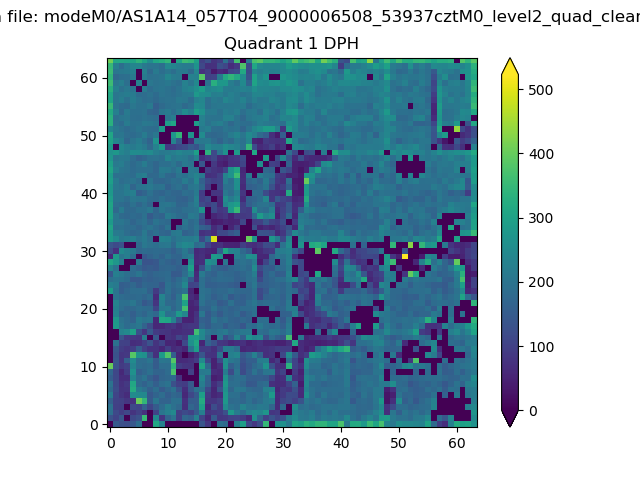 |
Quadrant B |
|---|---|---|---|
| Quadrant D | 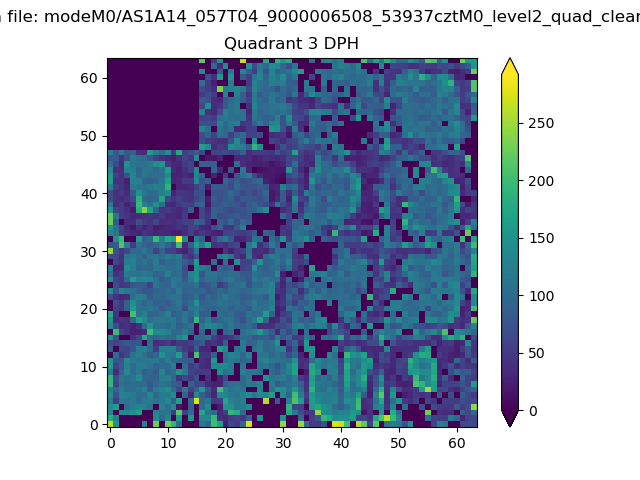 |
 |
Quadrant C |
| Plot type | Count rate plots | Images |
|---|---|---|
| Comparison with Poisson distribution Blue bars denote a histogram of data divided into 1 sec bins. Red curve is a Poisson curve with rate = median count rate of data. |
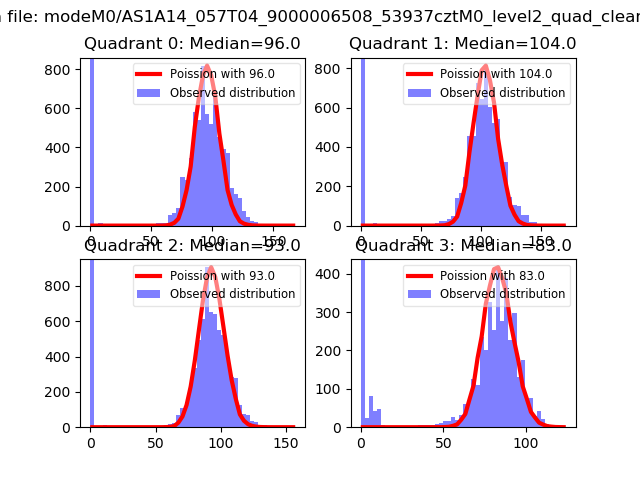 |
 |
| Quadrant-wise count rates Data is divided into 100 sec bins |
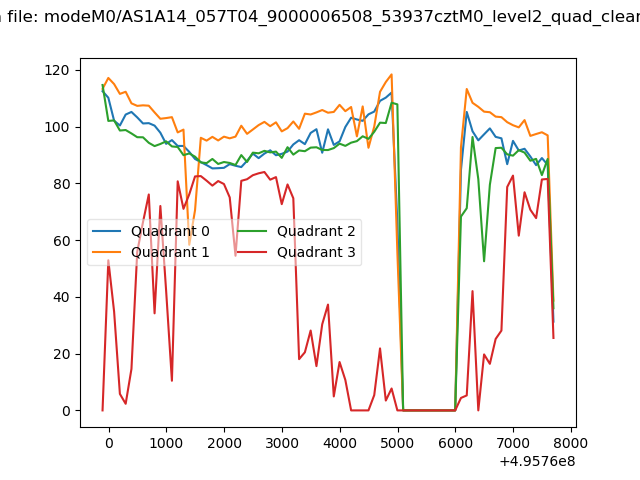 |
|
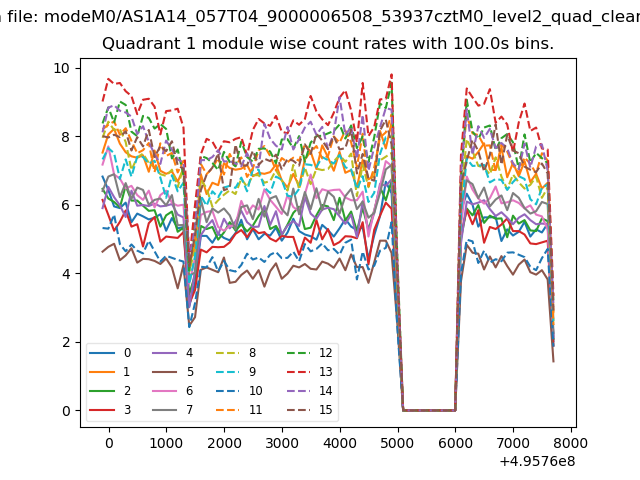
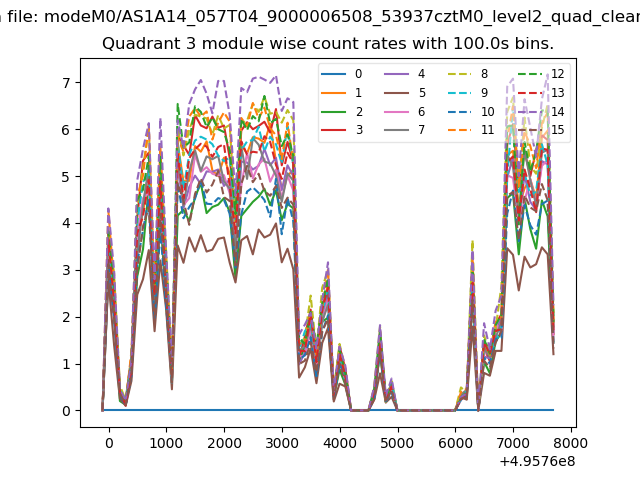
| Module-wise count rates for Quadrant A Data is divided into 100 sec bins |
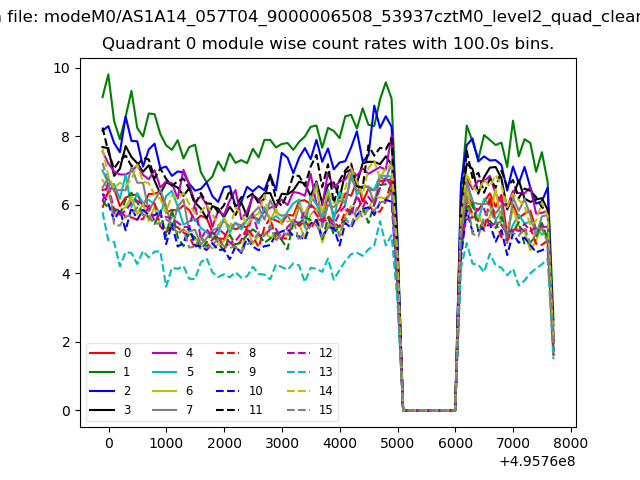 |
 |
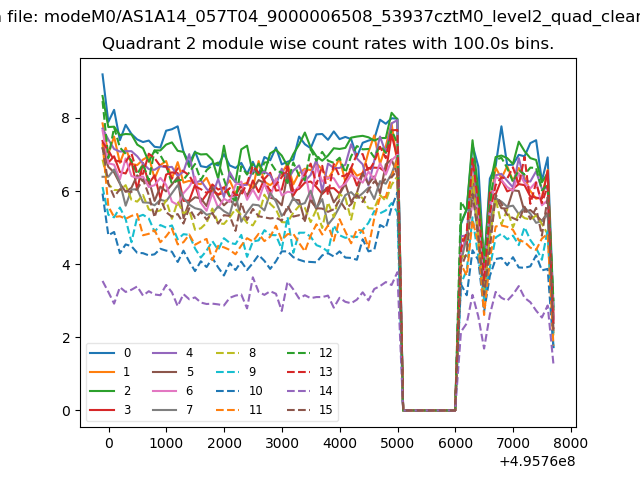
| Module-wise count rates for Quadrant B Data is divided into 100 sec bins |
 |
 |
| Module-wise count rates for Quadrant C Data is divided into 100 sec bins |
 |
 |
| Module-wise count rates for Quadrant D Data is divided into 100 sec bins |
 |
 |
| Parameter | Plot |
|---|---|
| CZT HV Monitor | 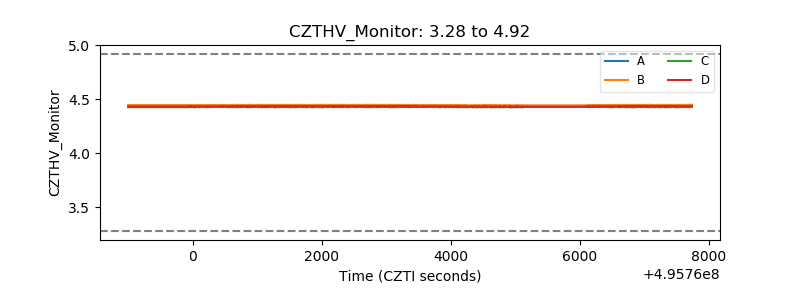 |
| D_VDD | 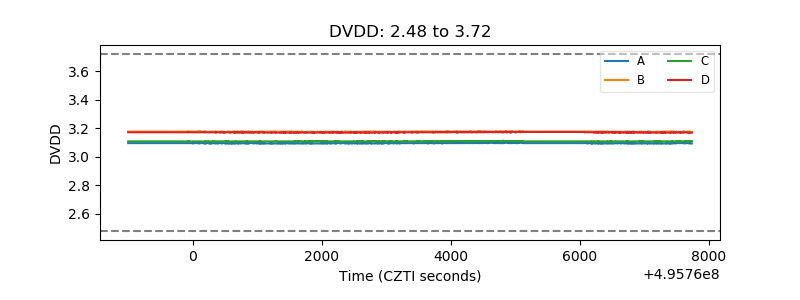 |
| Temperature 1 | 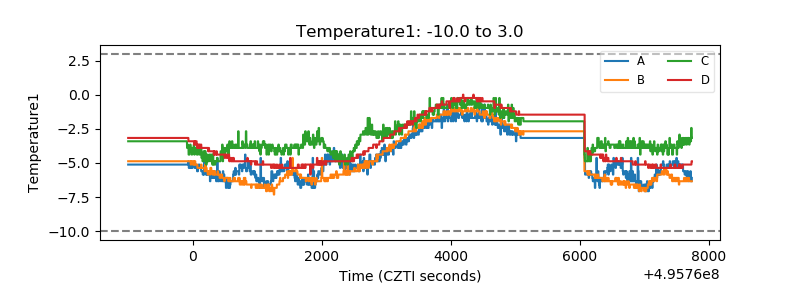 |
| Veto HV Monitor | 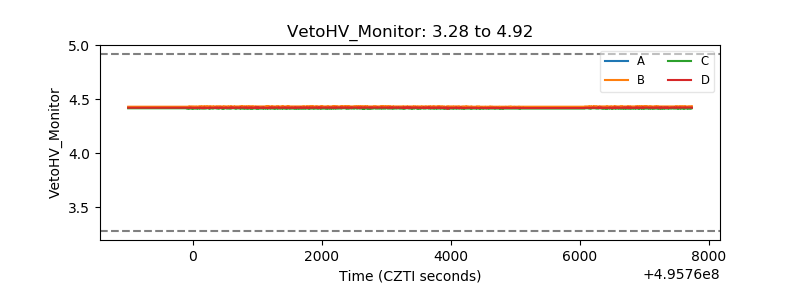 |
| Veto LLD | 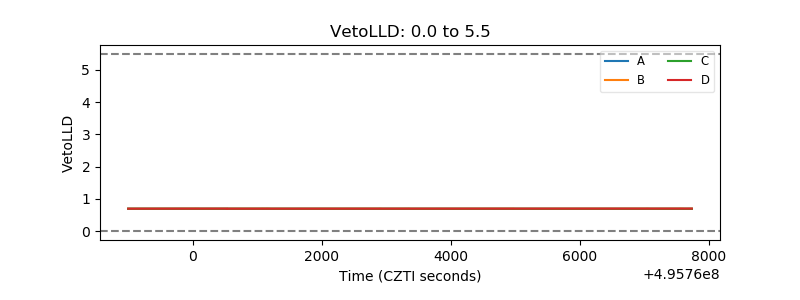 |
| Alpha Counter | 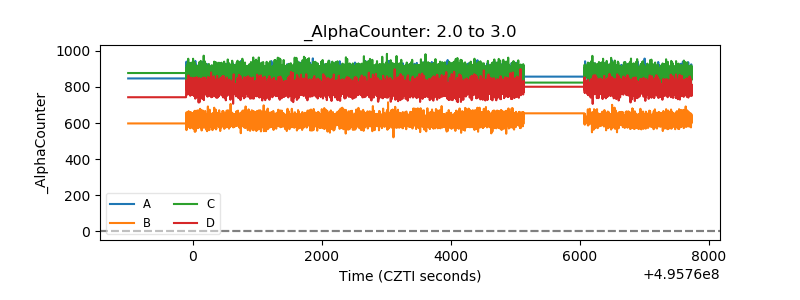 |
| _CPM_Rate | 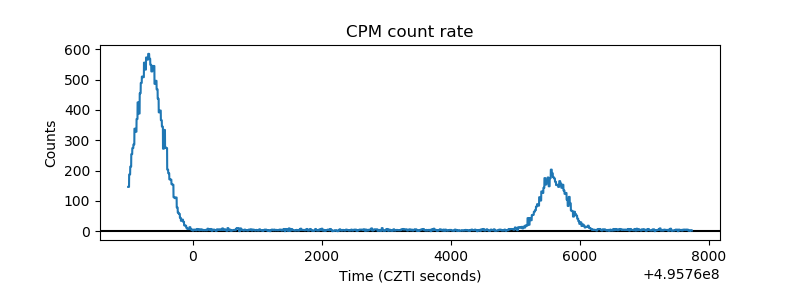 |
| CZT Counter | 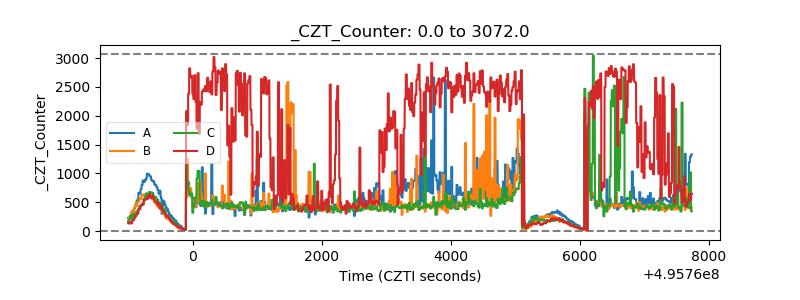 |
| +2.5 Volts monitor | 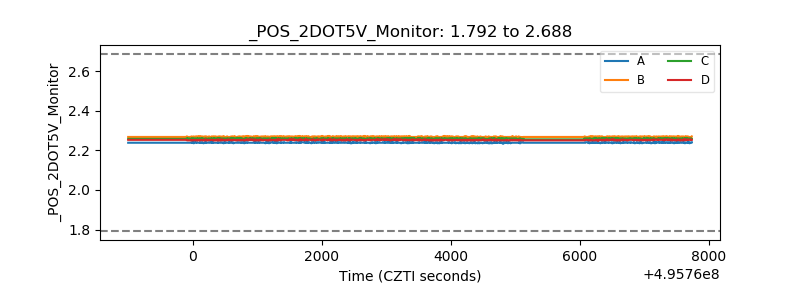 |
| +5 Volts monitor |  |
| _ROLL_ROT | 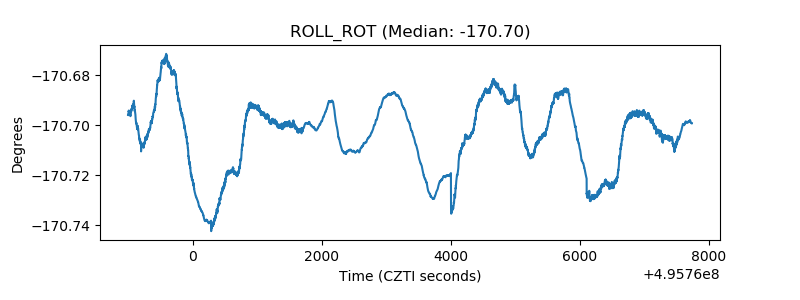 |
| _Roll_DEC | 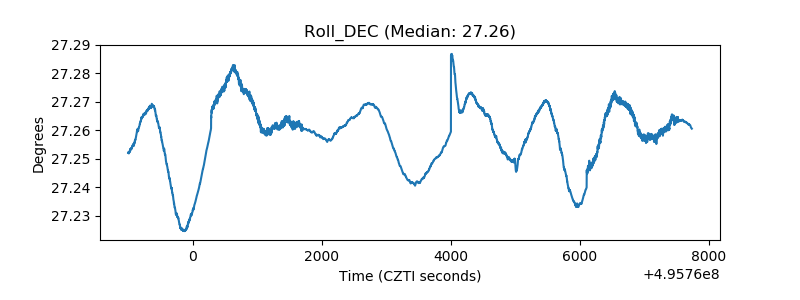 |
| _Roll_RA | 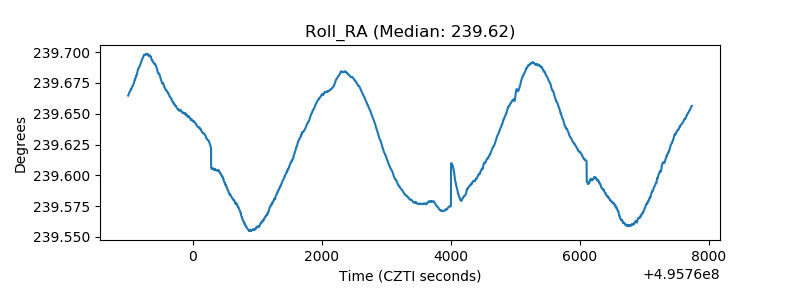 |
| Veto Counter | 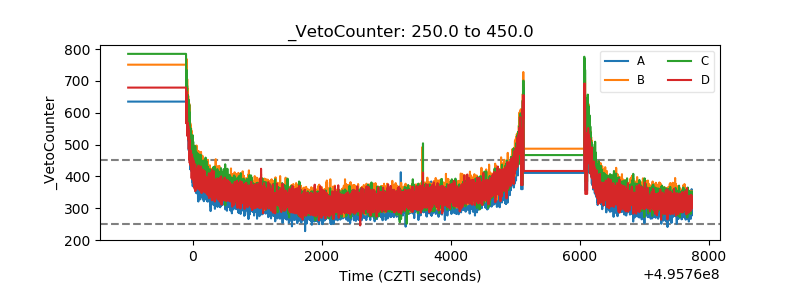 |