| Param | Original file | Final file |
|---|---|---|
| Filename | modeM0/AS1A14_057T04_9000006508_53939cztM0_level2.fits | modeM0/AS1A14_057T04_9000006508_53939cztM0_level2_quad_clean.evt |
| Size (bytes) | 870,877,440 | 104,918,400 |
| Size | 830.5 MB | 100.1 MB |
| Events in quadrant A | 5,262,281 | 781,181 |
| Events in quadrant B | 4,311,853 | 837,839 |
| Events in quadrant C | 3,968,207 | 769,122 |
| Events in quadrant D | 18,037,994 | 201,157 |
| Mode M0 | |||
|---|---|---|---|
| Quadrant | BADHDUFLAG | Total packets | Discarded packets |
| A | 0 | 21651 | 1 |
| B | 0 | 18887 | 1 |
| C | 0 | 18182 | 1 |
| D | 0 | 59390 | 1 |
| Mode SS | |||
|---|---|---|---|
| Quadrant | BADHDUFLAG | Total packets | Discarded packets |
| A | 0 | 172 | 0 |
| B | 0 | 172 | 0 |
| C | 0 | 172 | 0 |
| D | 0 | 172 | 0 |
| Mode M9 | |||
|---|---|---|---|
| Quadrant | BADHDUFLAG | Total packets | Discarded packets |
| A | 0 | 5 | 0 |
| B | 0 | 5 | 0 |
| C | 0 | 5 | 0 |
| D | 0 | 5 | 0 |
| Quadrant | Total seconds | Saturated seconds | Saturation percentage |
|---|---|---|---|
| A | 8452 | 338 | 3.999053% |
| B | 8452 | 338 | 3.999053% |
| C | 8453 | 136 | 1.608896% |
| D | 8453 | 6299 | 74.517923% |
Noise dominated data is calculated using 1-second bins in cleaned event files. If a bin has >2000 counts, and if more than 50% of those come from <1% of pixels, then it is considered to be noise-dominated and hence unusable.
| Quadrant | # 1 sec bins | Bins with >0 counts | Bins with >2000 counts | High rate bins dominated by noise | Noise dominated (total time) | Noise dominated (detector-on time) | Marked lightcurve |
|---|---|---|---|---|---|---|---|
| A | 8967 | 8453 | 93 | 93 | 1.04% | 1.10% | 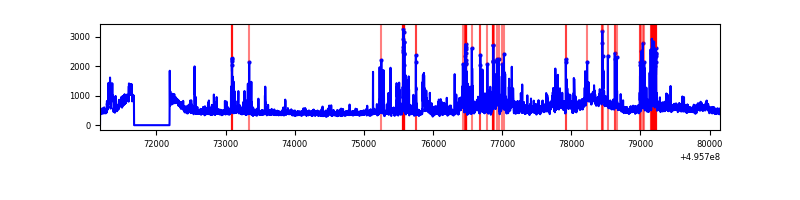 |
| B | 8967 | 8453 | 31 | 31 | 0.35% | 0.37% | 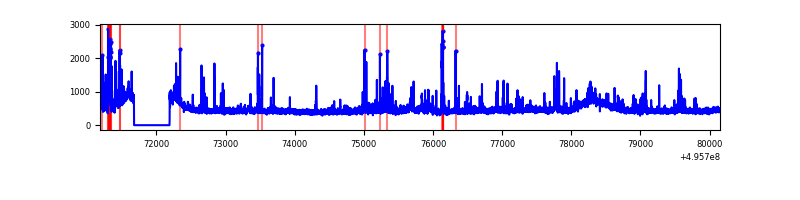 |
| C | 8968 | 8454 | 16 | 16 | 0.18% | 0.19% | 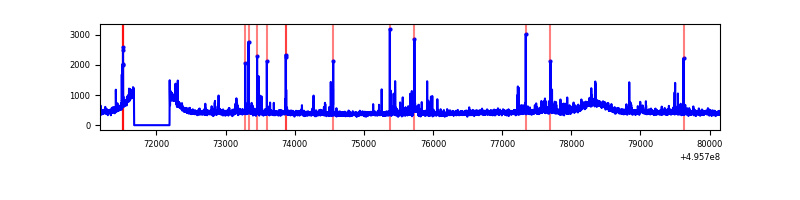 |
| D | 8968 | 8454 | 5375 | 5375 | 59.94% | 63.58% | 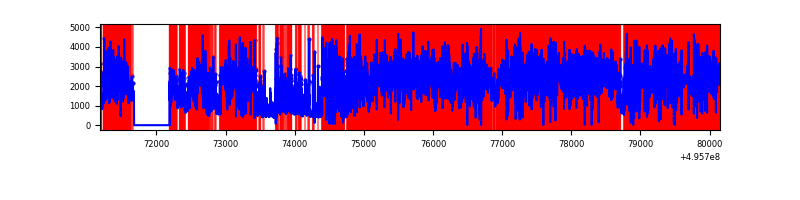 |
Top three noisy pixels from each quadrant. If the there are fewer than three noisy pixels in the level2.evt file, extra rows are filled as -1
| Pixel properties | Quadrant properties | ||||||
|---|---|---|---|---|---|---|---|
| Quadrant | DetID | PixID | Counts | Sigma | Mean | Median | Sigma |
| A | 14 | 235 | 515639 | 2190.71 | 961 | 939 | 234.9 |
| A | 4 | 249 | 356730 | 1514.34 | 961 | 939 | 234.9 |
| A | 15 | 174 | 254736 | 1080.23 | 961 | 939 | 234.9 |
| B | 0 | 213 | 247581 | 1193.49 | 954 | 921 | 206.7 |
| B | 5 | 236 | 99734 | 478.12 | 954 | 921 | 206.7 |
| B | 2 | 249 | 37508 | 177.03 | 954 | 921 | 206.7 |
| C | 12 | 2 | 54145 | 207.64 | 944 | 936 | 256.3 |
| C | 14 | 246 | 51759 | 198.33 | 944 | 936 | 256.3 |
| C | 14 | 254 | 32011 | 121.27 | 944 | 936 | 256.3 |
| D | 8 | 176 | 13532958 | 100771.51 | 462 | 440 | 134.3 |
| D | 10 | 172 | 972115 | 7235.69 | 462 | 440 | 134.3 |
| D | 0 | 129 | 960451 | 7148.83 | 462 | 440 | 134.3 |
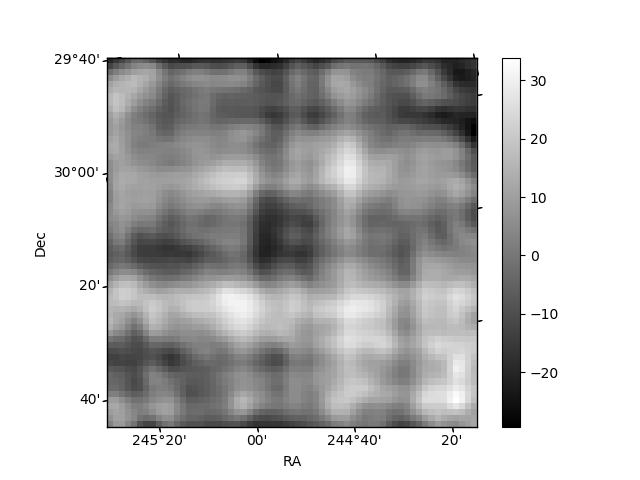
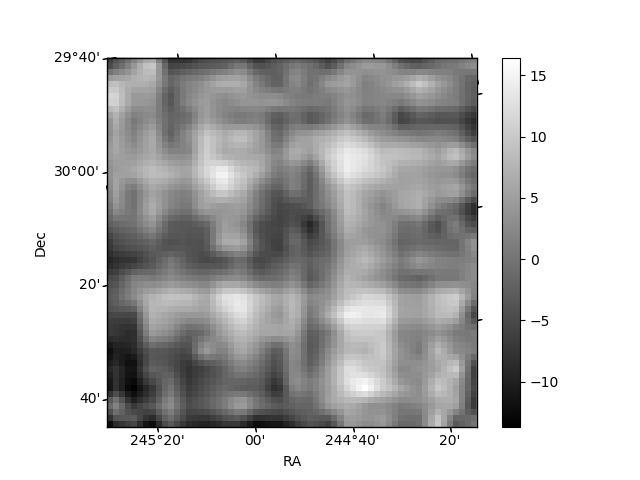
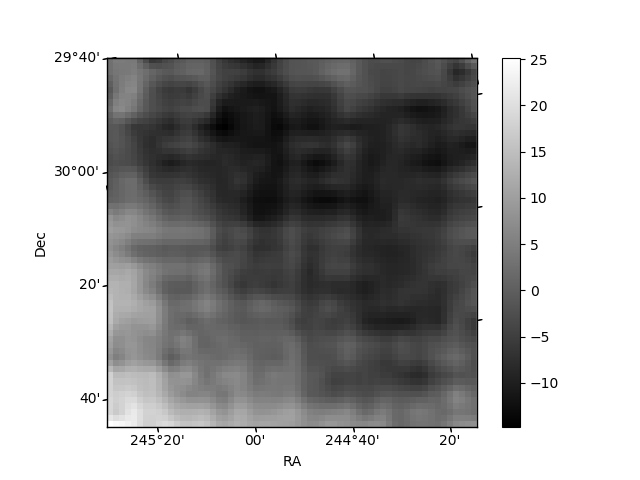
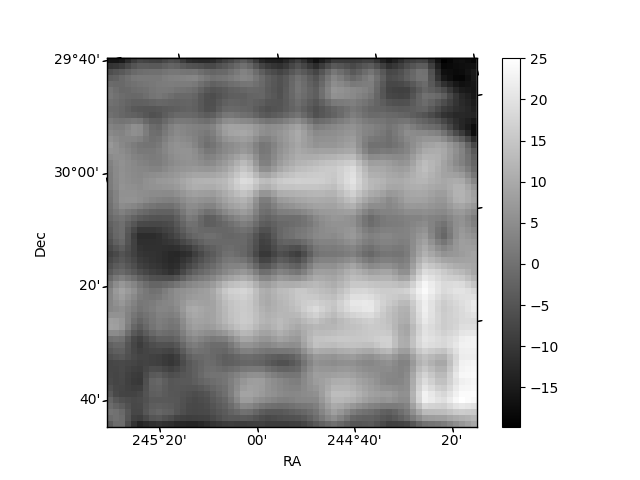
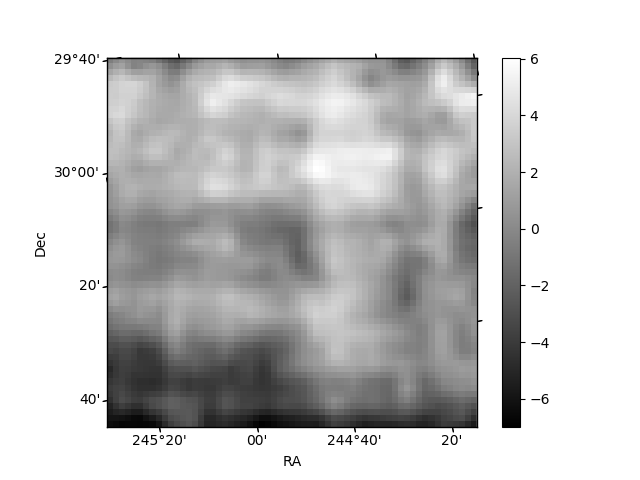
Histogram calculated using DETX and DETY for each event in the final _common_clean file
| Quadrant A | 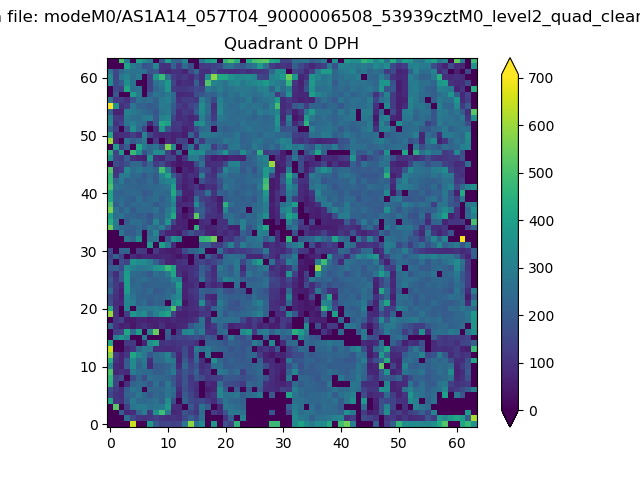 |
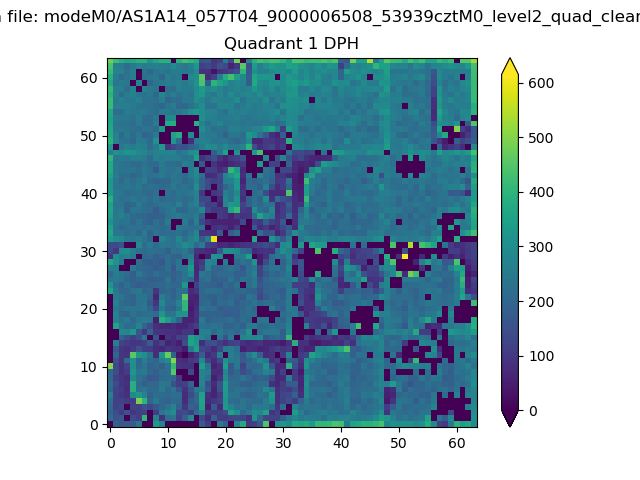 |
Quadrant B |
|---|---|---|---|
| Quadrant D | 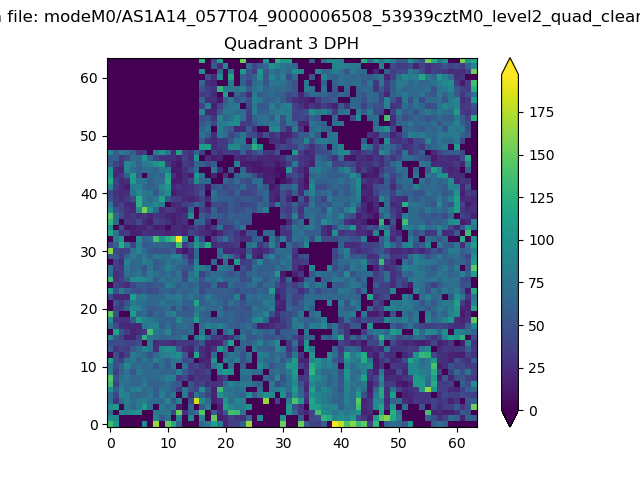 |
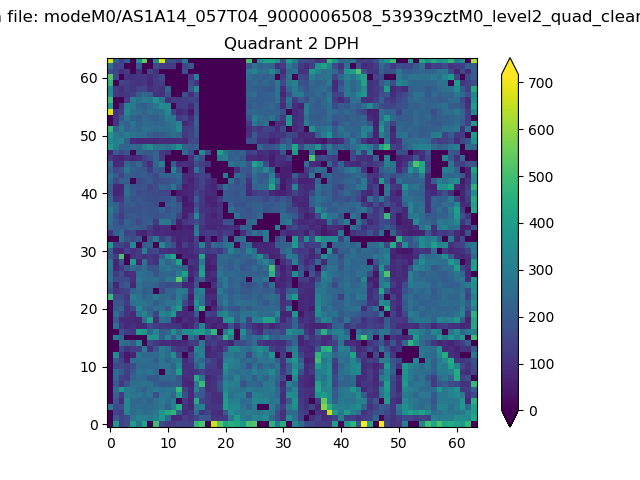 |
Quadrant C |
| Plot type | Count rate plots | Images |
|---|---|---|
| Comparison with Poisson distribution Blue bars denote a histogram of data divided into 1 sec bins. Red curve is a Poisson curve with rate = median count rate of data. |
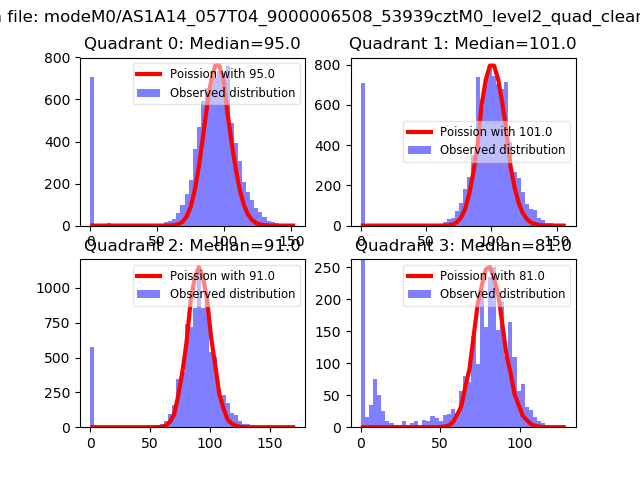 |
 |
| Quadrant-wise count rates Data is divided into 100 sec bins |
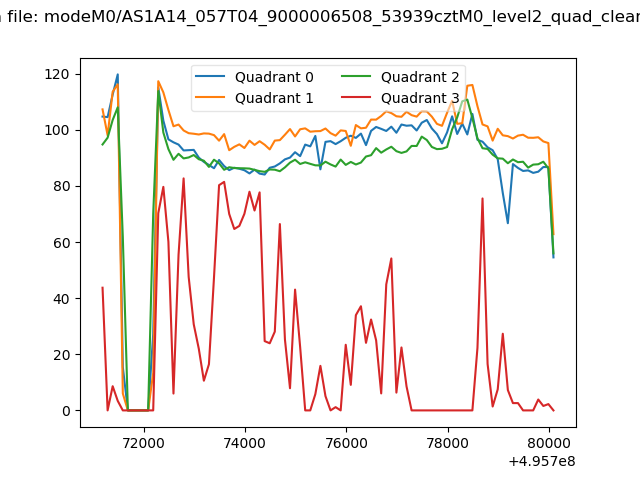 |
|
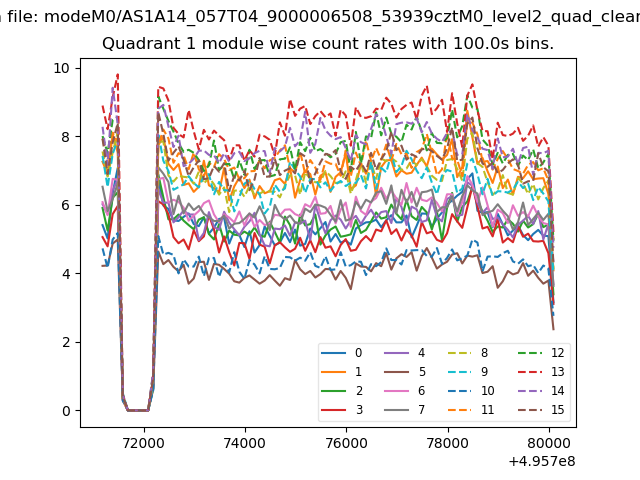
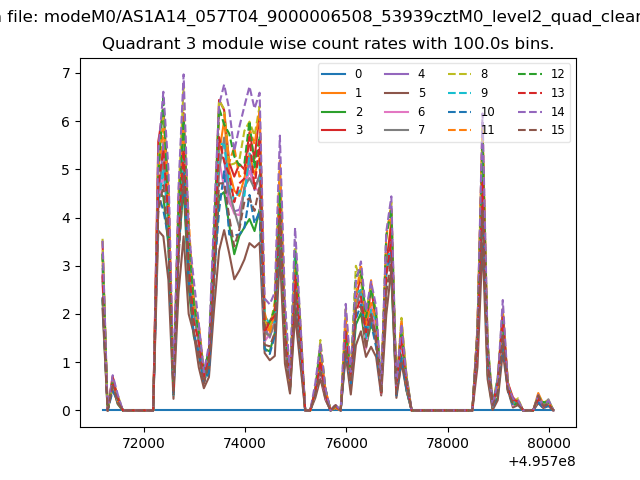
| Module-wise count rates for Quadrant A Data is divided into 100 sec bins |
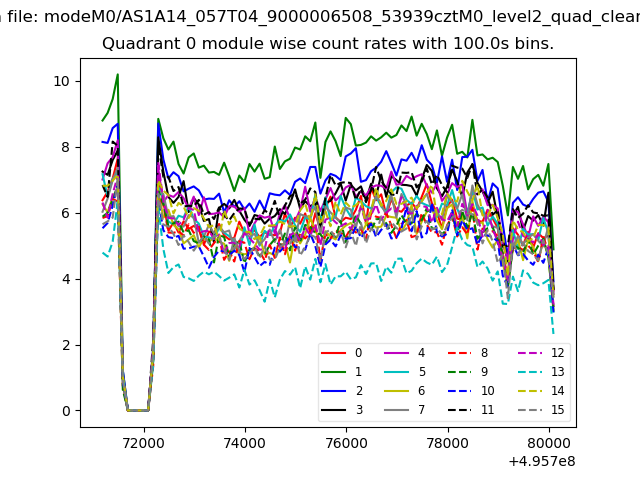 |
 |
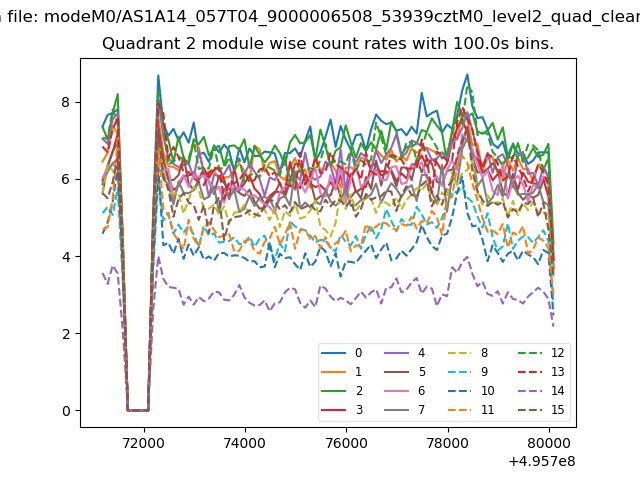
| Module-wise count rates for Quadrant B Data is divided into 100 sec bins |
 |
 |
| Module-wise count rates for Quadrant C Data is divided into 100 sec bins |
 |
 |
| Module-wise count rates for Quadrant D Data is divided into 100 sec bins |
 |
 |
| Parameter | Plot |
|---|---|
| CZT HV Monitor | 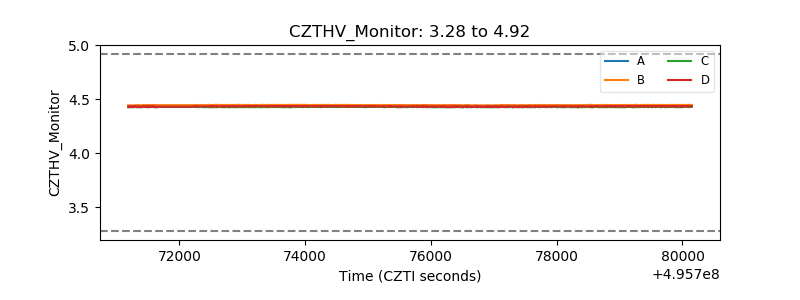 |
| D_VDD | 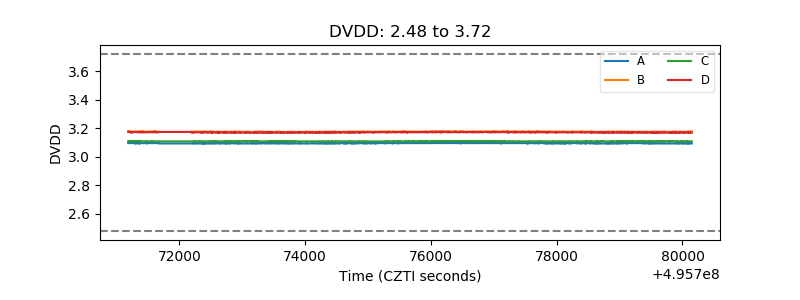 |
| Temperature 1 | 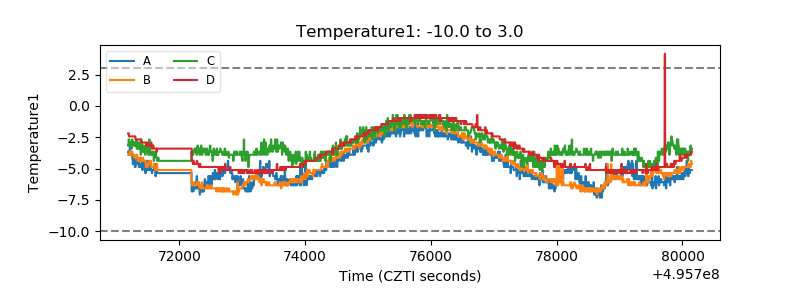 |
| Veto HV Monitor | 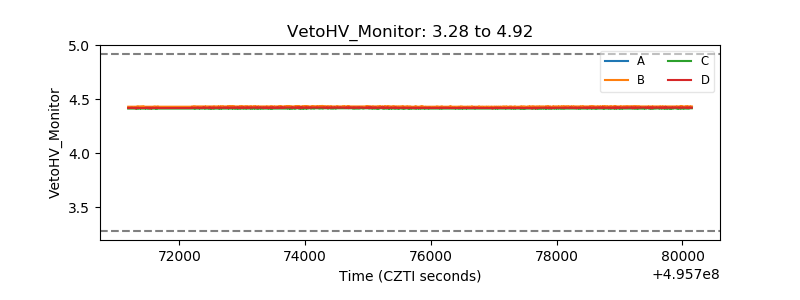 |
| Veto LLD | 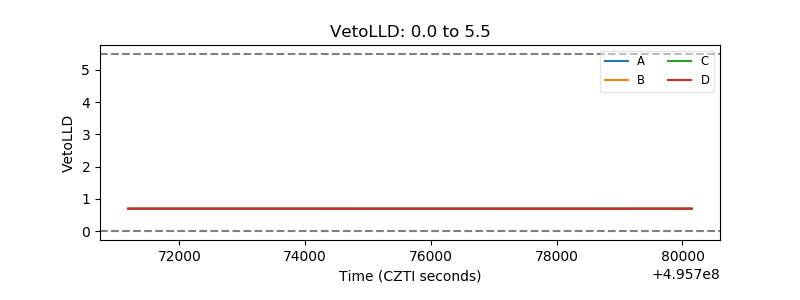 |
| Alpha Counter | 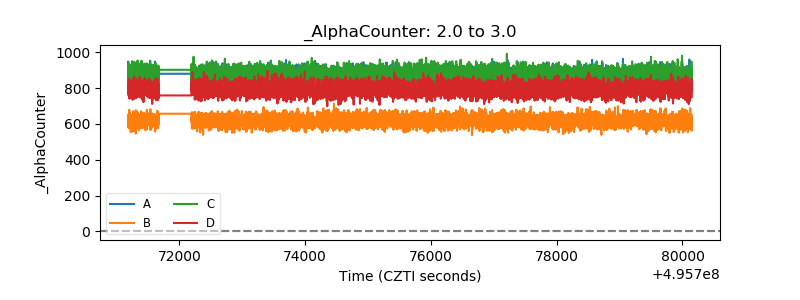 |
| _CPM_Rate | 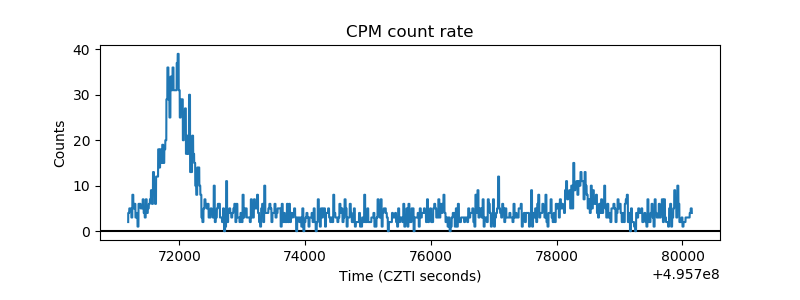 |
| CZT Counter | 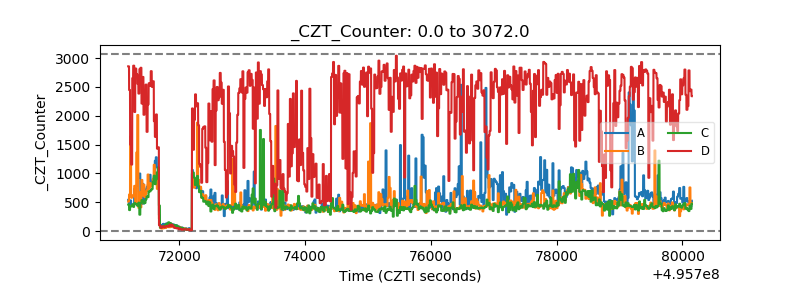 |
| +2.5 Volts monitor | 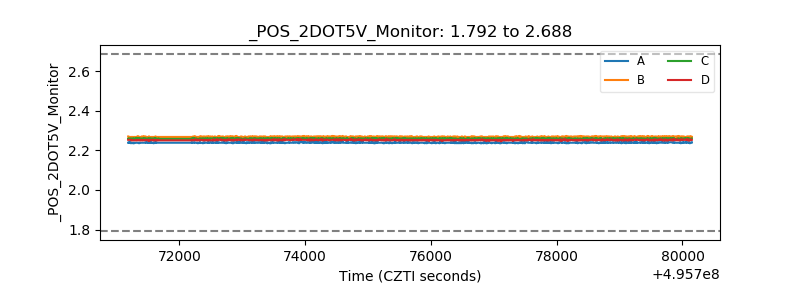 |
| +5 Volts monitor |  |
| _ROLL_ROT | 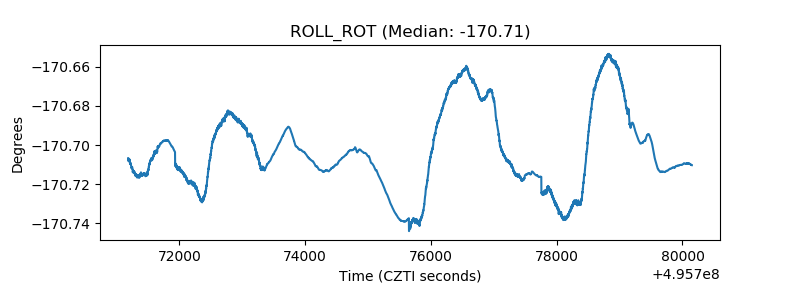 |
| _Roll_DEC | 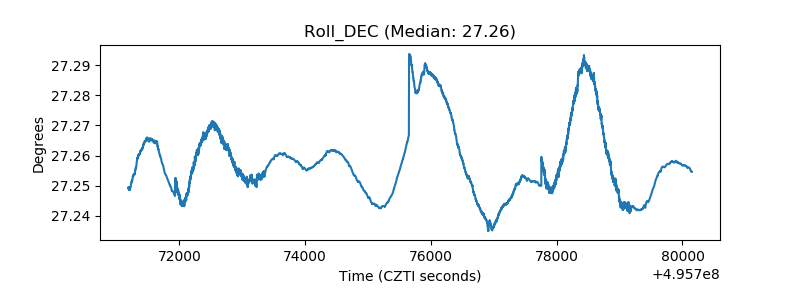 |
| _Roll_RA | 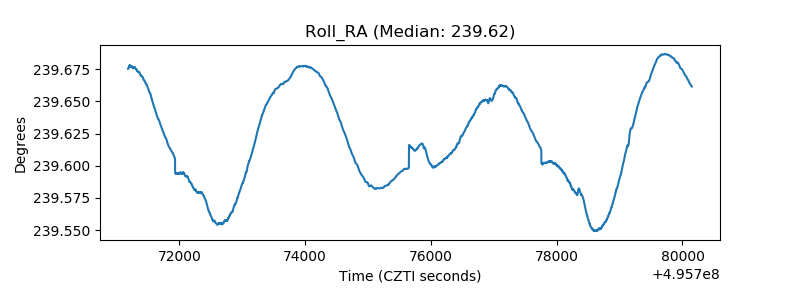 |
| Veto Counter | 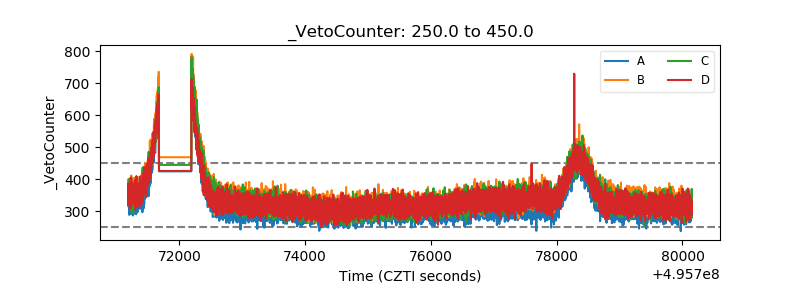 |