| Param | Original file | Final file |
|---|---|---|
| Filename | modeM0/AS1A14_057T04_9000006508_53941cztM0_level2.fits | modeM0/AS1A14_057T04_9000006508_53941cztM0_level2_quad_clean.evt |
| Size (bytes) | 847,517,760 | 94,092,480 |
| Size | 808.3 MB | 89.7 MB |
| Events in quadrant A | 4,350,467 | 728,977 |
| Events in quadrant B | 4,359,227 | 768,045 |
| Events in quadrant C | 5,618,872 | 633,463 |
| Events in quadrant D | 16,437,717 | 175,678 |
| Mode M0 | |||
|---|---|---|---|
| Quadrant | BADHDUFLAG | Total packets | Discarded packets |
| A | 0 | 18310 | 0 |
| B | 0 | 18340 | 0 |
| C | 0 | 22397 | 10 |
| D | 0 | 54300 | 8 |
| Mode SS | |||
|---|---|---|---|
| Quadrant | BADHDUFLAG | Total packets | Discarded packets |
| A | 0 | 156 | 0 |
| B | 0 | 156 | 0 |
| C | 0 | 156 | 0 |
| D | 0 | 156 | 0 |
| Quadrant | Total seconds | Saturated seconds | Saturation percentage |
|---|---|---|---|
| A | 7806 | 103 | 1.319498% |
| B | 7807 | 231 | 2.958883% |
| C | 7804 | 783 | 10.033316% |
| D | 7806 | 5868 | 75.172944% |
Noise dominated data is calculated using 1-second bins in cleaned event files. If a bin has >2000 counts, and if more than 50% of those come from <1% of pixels, then it is considered to be noise-dominated and hence unusable.
| Quadrant | # 1 sec bins | Bins with >0 counts | Bins with >2000 counts | High rate bins dominated by noise | Noise dominated (total time) | Noise dominated (detector-on time) | Marked lightcurve |
|---|---|---|---|---|---|---|---|
| A | 7806 | 7806 | 73 | 73 | 0.94% | 0.94% | 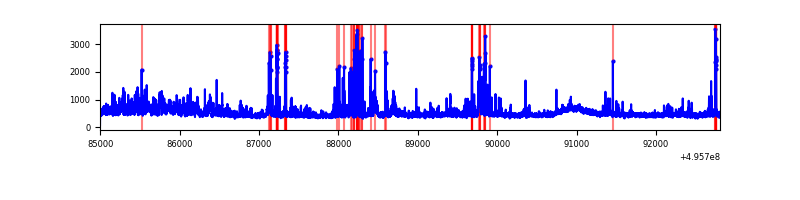 |
| B | 7807 | 7807 | 181 | 181 | 2.32% | 2.32% | 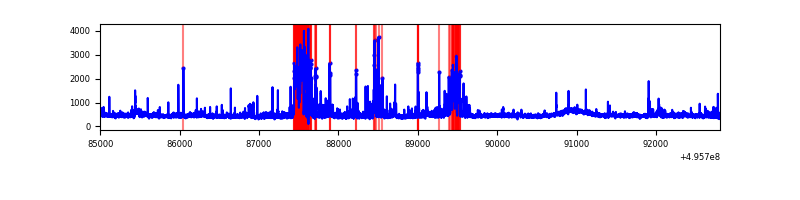 |
| C | 7807 | 7806 | 771 | 771 | 9.88% | 9.88% | 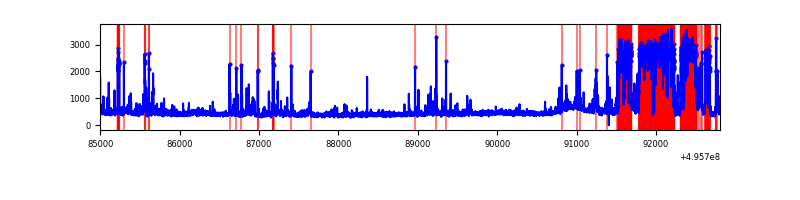 |
| D | 7806 | 7806 | 4858 | 4858 | 62.23% | 62.23% | 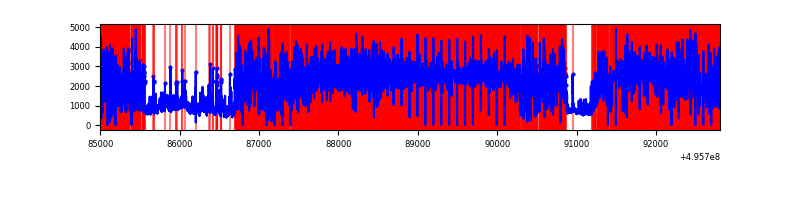 |
Top three noisy pixels from each quadrant. If the there are fewer than three noisy pixels in the level2.evt file, extra rows are filled as -1
| Pixel properties | Quadrant properties | ||||||
|---|---|---|---|---|---|---|---|
| Quadrant | DetID | PixID | Counts | Sigma | Mean | Median | Sigma |
| A | 14 | 235 | 328988 | 1578.55 | 846 | 825 | 207.9 |
| A | 15 | 174 | 275611 | 1321.8 | 846 | 825 | 207.9 |
| A | 4 | 249 | 81357 | 387.38 | 846 | 825 | 207.9 |
| B | 5 | 172 | 305015 | 1695.72 | 832 | 803 | 179.4 |
| B | 0 | 213 | 244605 | 1358.99 | 832 | 803 | 179.4 |
| B | 5 | 185 | 162849 | 903.27 | 832 | 803 | 179.4 |
| C | 1 | 241 | 2154375 | 10158.06 | 777 | 771 | 212.0 |
| C | 12 | 2 | 88295 | 412.83 | 777 | 771 | 212.0 |
| C | 15 | 174 | 45122 | 209.19 | 777 | 771 | 212.0 |
| D | 8 | 176 | 13618165 | 136581.65 | 345 | 329 | 99.7 |
| D | 10 | 172 | 805078 | 8071.32 | 345 | 329 | 99.7 |
| D | 6 | 239 | 141560 | 1416.49 | 345 | 329 | 99.7 |
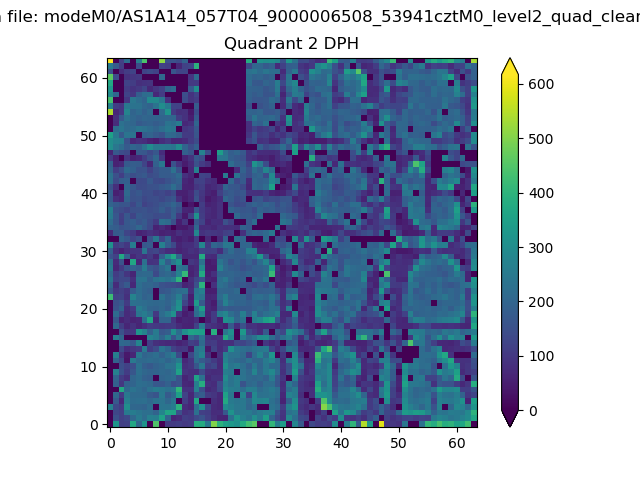
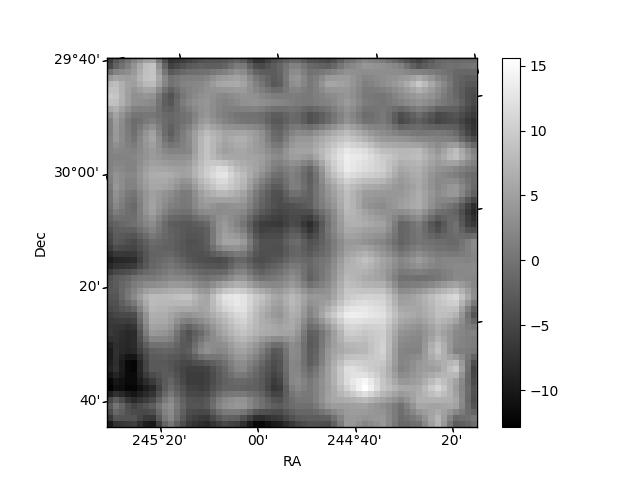
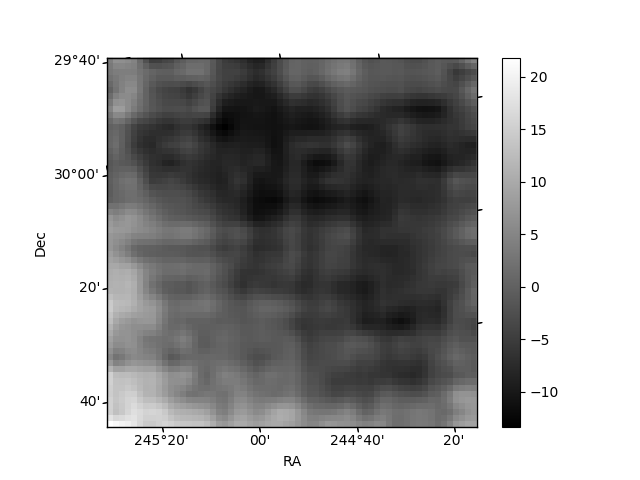
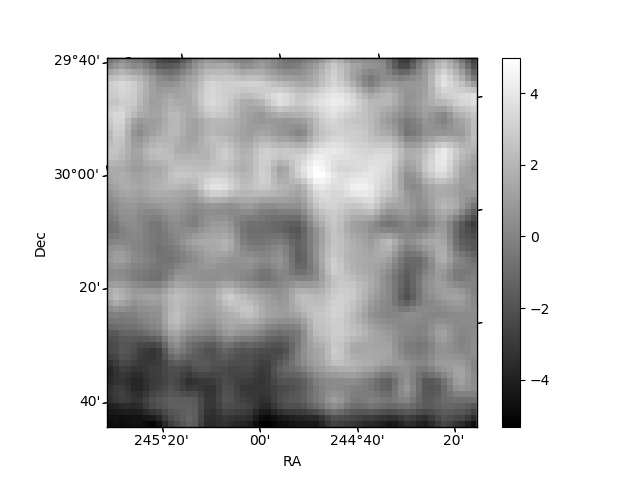
Histogram calculated using DETX and DETY for each event in the final _common_clean file
| Quadrant A | 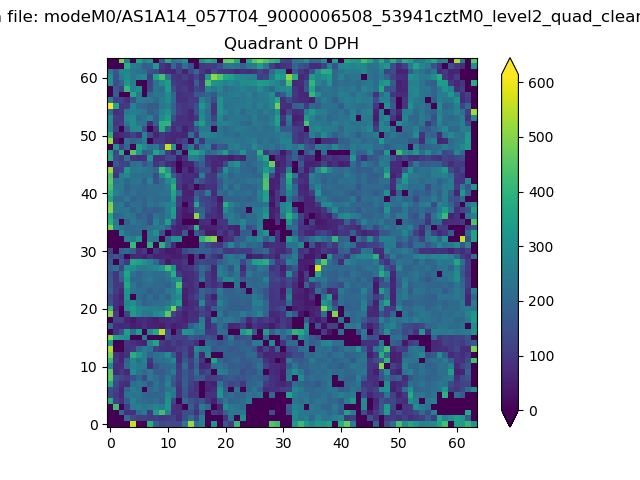 |
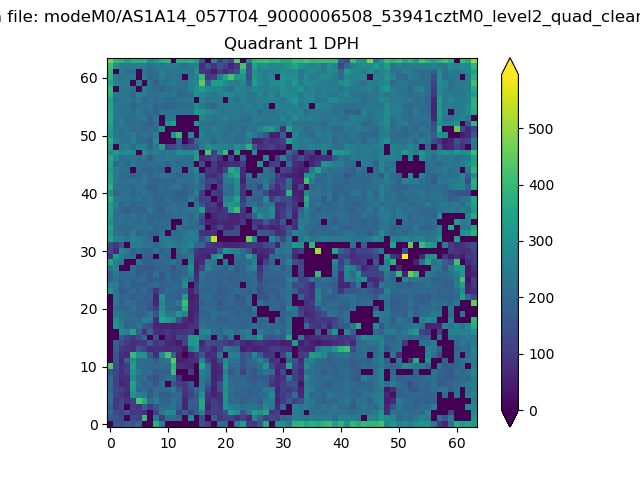 |
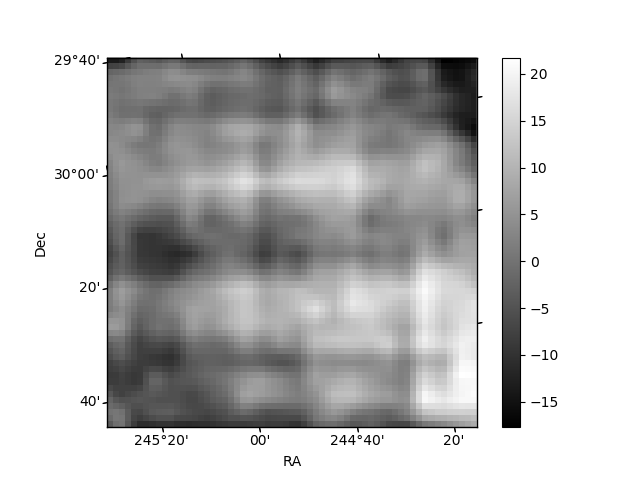
Quadrant B |
|---|---|---|---|
| Quadrant D | 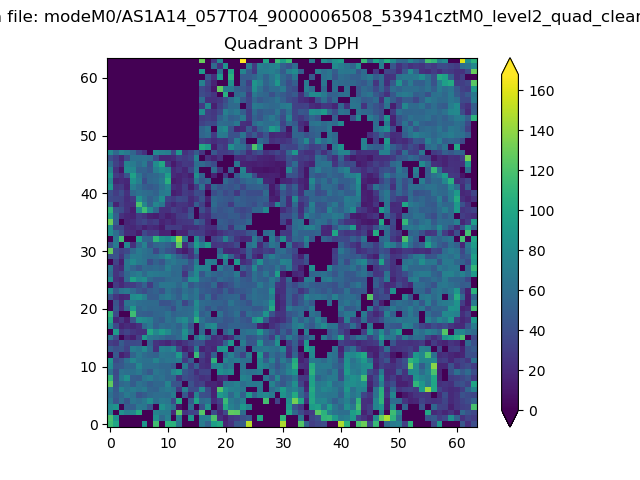 |
 |
Quadrant C |
| Plot type | Count rate plots | Images |
|---|---|---|
| Comparison with Poisson distribution Blue bars denote a histogram of data divided into 1 sec bins. Red curve is a Poisson curve with rate = median count rate of data. |
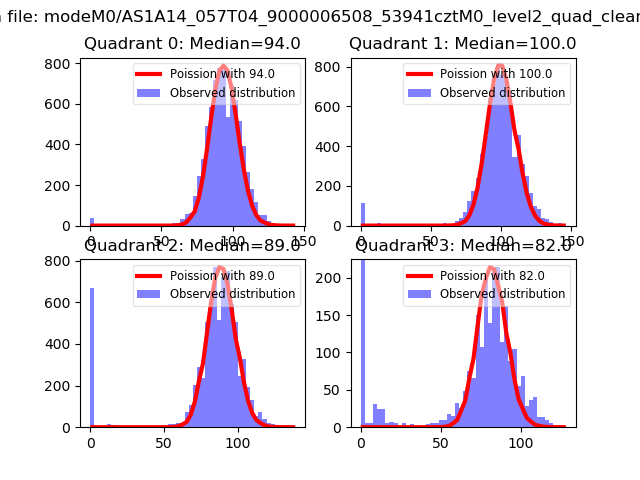 |
 |
| Quadrant-wise count rates Data is divided into 100 sec bins |
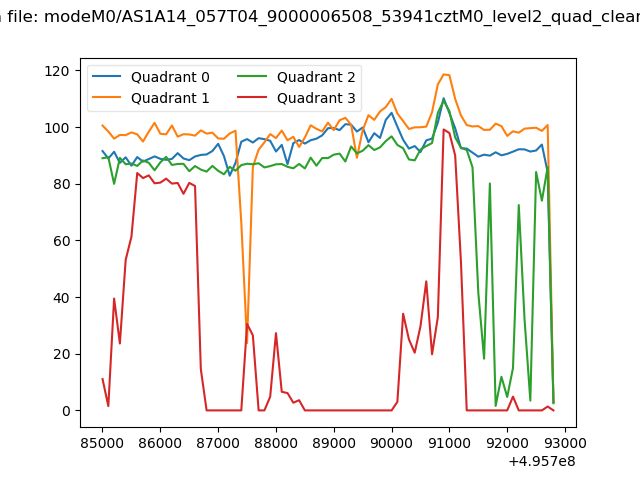 |
|
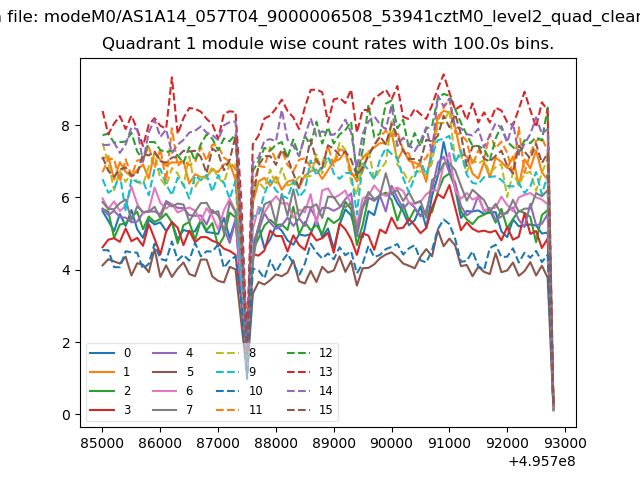
| Module-wise count rates for Quadrant A Data is divided into 100 sec bins |
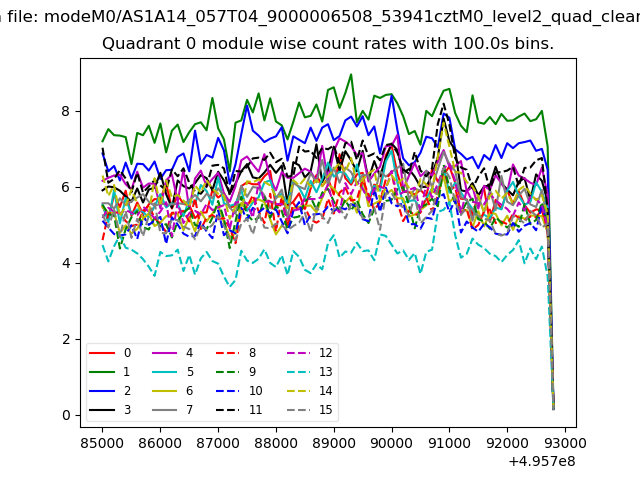 |
 |
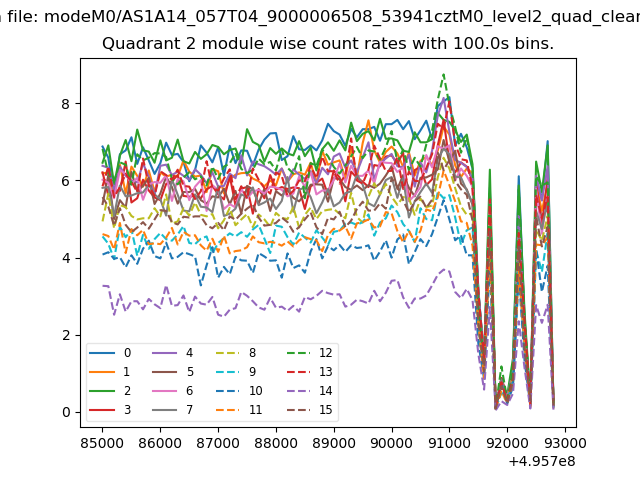
| Module-wise count rates for Quadrant B Data is divided into 100 sec bins |
 |
 |
| Module-wise count rates for Quadrant C Data is divided into 100 sec bins |
 |
 |
| Module-wise count rates for Quadrant D Data is divided into 100 sec bins |
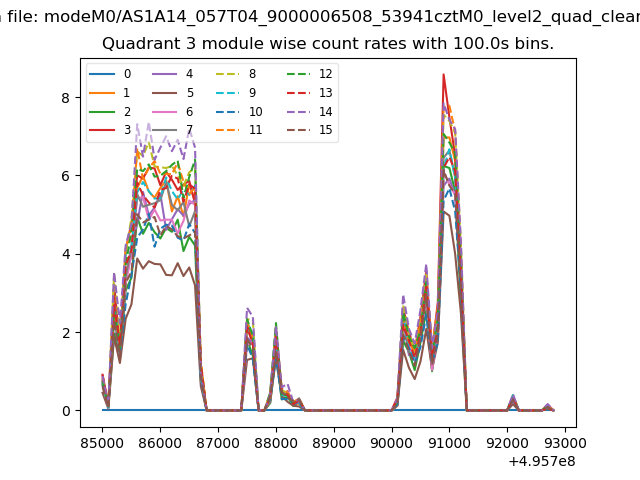 |
 |
| Parameter | Plot |
|---|---|
| CZT HV Monitor | 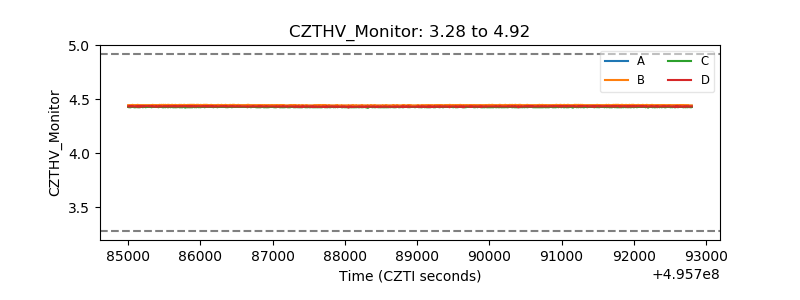 |
| D_VDD | 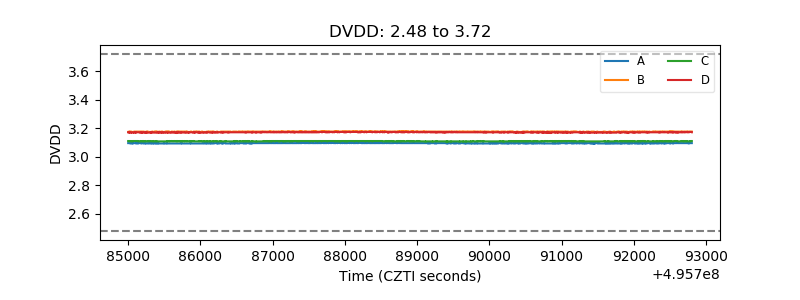 |
| Temperature 1 | 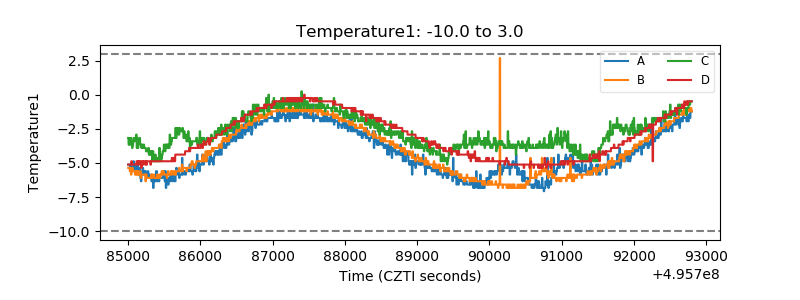 |
| Veto HV Monitor | 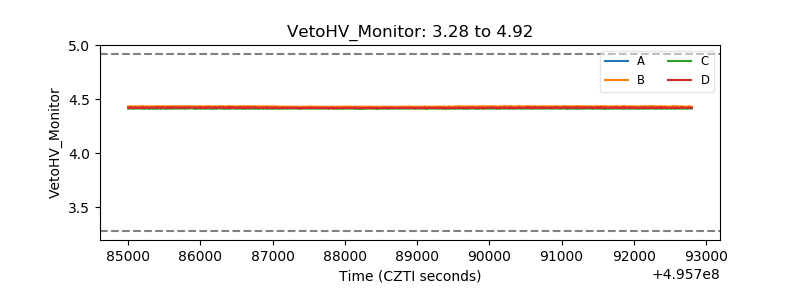 |
| Veto LLD | 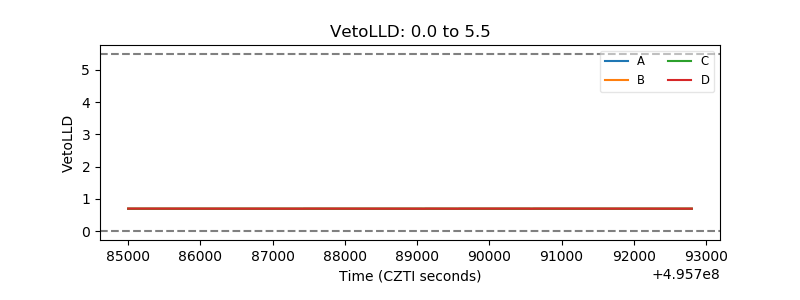 |
| Alpha Counter | 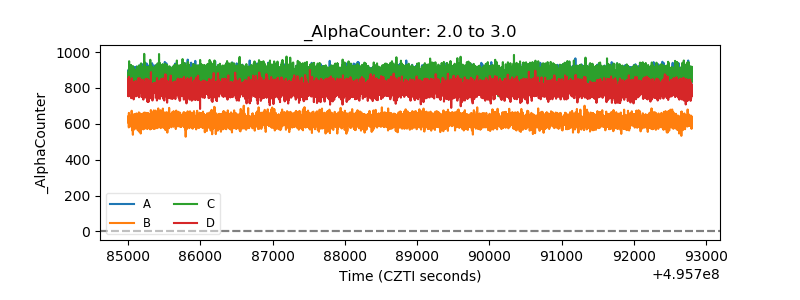 |
| _CPM_Rate | 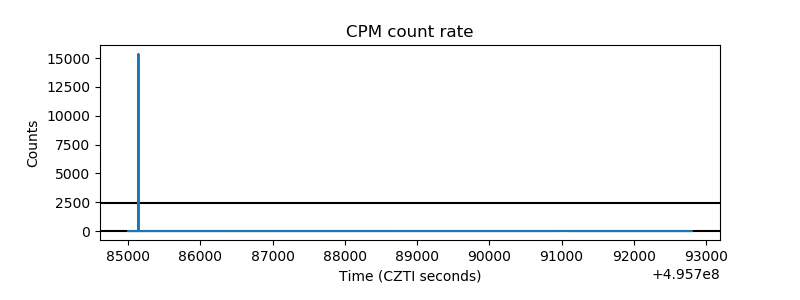 |
| CZT Counter | 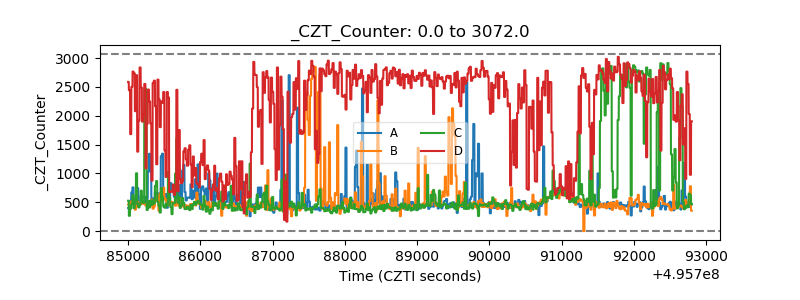 |
| +2.5 Volts monitor |  |
| +5 Volts monitor |  |
| _ROLL_ROT | 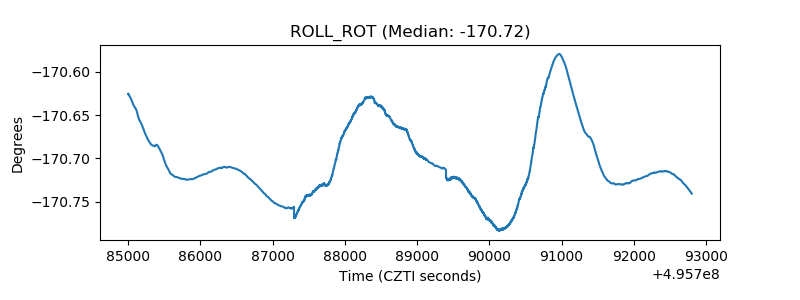 |
| _Roll_DEC | 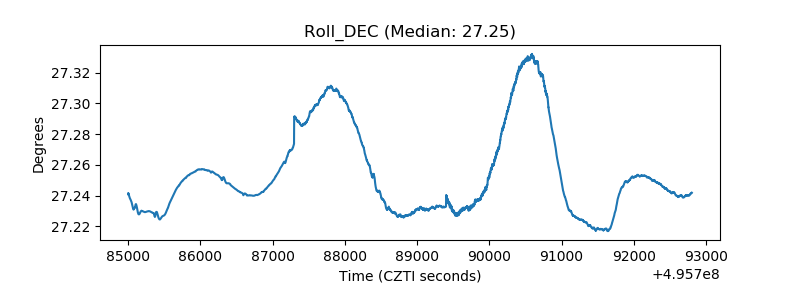 |
| _Roll_RA | 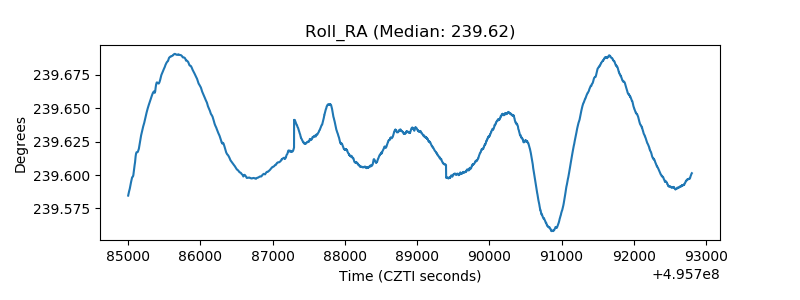 |
| Veto Counter | 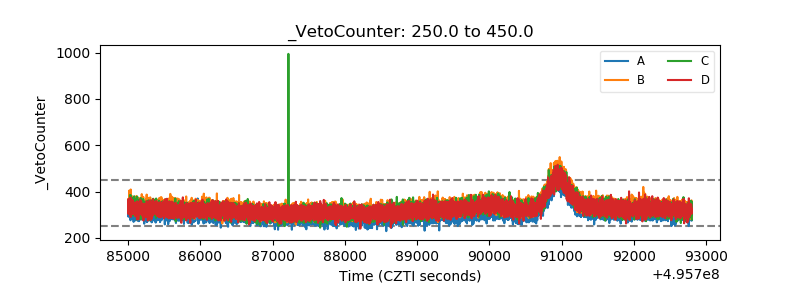 |