| Param | Original file | Final file |
|---|---|---|
| Filename | modeM0/AS1A14_057T04_9000006508_53944cztM0_level2.fits | modeM0/AS1A14_057T04_9000006508_53944cztM0_level2_quad_clean.evt |
| Size (bytes) | 959,235,840 | 66,795,840 |
| Size | 914.8 MB | 63.7 MB |
| Events in quadrant A | 4,616,837 | 473,716 |
| Events in quadrant B | 5,255,832 | 482,620 |
| Events in quadrant C | 7,825,341 | 417,533 |
| Events in quadrant D | 17,154,629 | 61,600 |
| Mode M0 | |||
|---|---|---|---|
| Quadrant | BADHDUFLAG | Total packets | Discarded packets |
| A | 0 | 20542 | 862 |
| B | 0 | 22425 | 858 |
| C | 0 | 30703 | 1232 |
| D | 0 | 60408 | 3675 |
| Mode SS | |||
|---|---|---|---|
| Quadrant | BADHDUFLAG | Total packets | Discarded packets |
| A | 0 | 176 | 2 |
| B | 0 | 174 | 2 |
| C | 0 | 177 | 5 |
| D | 0 | 176 | 4 |
| Mode M9 | |||
|---|---|---|---|
| Quadrant | BADHDUFLAG | Total packets | Discarded packets |
| A | 0 | 5 | 5 |
| B | 1 | 5 | 5 |
| C | 1 | -1 | -1 |
| D | 1 | -1 | -1 |
| Quadrant | Total seconds | Saturated seconds | Saturation percentage |
|---|---|---|---|
| A | 8500 | 202 | 2.376471% |
| B | 8482 | 362 | 4.267861% |
| C | 8456 | 1447 | 17.112110% |
| D | 8302 | 6998 | 84.292941% |
Noise dominated data is calculated using 1-second bins in cleaned event files. If a bin has >2000 counts, and if more than 50% of those come from <1% of pixels, then it is considered to be noise-dominated and hence unusable.
| Quadrant | # 1 sec bins | Bins with >0 counts | Bins with >2000 counts | High rate bins dominated by noise | Noise dominated (total time) | Noise dominated (detector-on time) | Marked lightcurve |
|---|---|---|---|---|---|---|---|
| A | 11999 | 8602 | 183 | 183 | 1.53% | 2.13% | 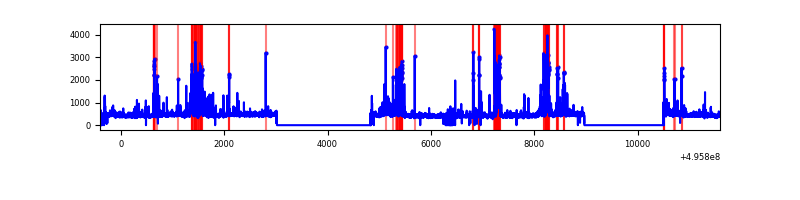 |
| B | 12001 | 8592 | 273 | 273 | 2.27% | 3.18% | 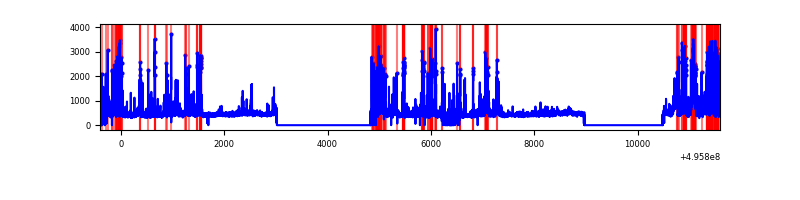 |
| C | 11998 | 8563 | 1276 | 1276 | 10.64% | 14.90% | 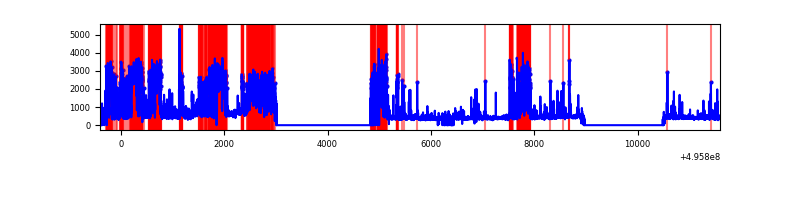 |
| D | 11981 | 8391 | 4704 | 4704 | 39.26% | 56.06% | 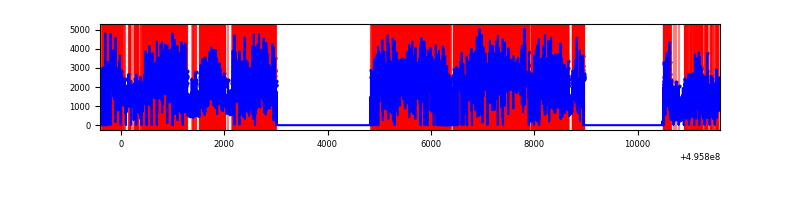 |
Top three noisy pixels from each quadrant. If the there are fewer than three noisy pixels in the level2.evt file, extra rows are filled as -1
| Pixel properties | Quadrant properties | ||||||
|---|---|---|---|---|---|---|---|
| Quadrant | DetID | PixID | Counts | Sigma | Mean | Median | Sigma |
| A | 15 | 174 | 621475 | 2844.77 | 866 | 844 | 218.2 |
| A | 3 | 14 | 111893 | 509.01 | 866 | 844 | 218.2 |
| A | 8 | 6 | 98190 | 446.2 | 866 | 844 | 218.2 |
| B | 0 | 213 | 1076908 | 5944.32 | 852 | 823 | 181.0 |
| B | 1 | 223 | 200020 | 1100.37 | 852 | 823 | 181.0 |
| B | 0 | 155 | 140588 | 772.07 | 852 | 823 | 181.0 |
| C | 1 | 241 | 2966485 | 13686.25 | 780 | 773 | 216.7 |
| C | 15 | 148 | 758206 | 3495.42 | 780 | 773 | 216.7 |
| C | 15 | 157 | 213057 | 979.65 | 780 | 773 | 216.7 |
| D | 8 | 176 | 14087297 | 155886.31 | 298 | 284 | 90.4 |
| D | 10 | 172 | 671918 | 7432.27 | 298 | 284 | 90.4 |
| D | 6 | 239 | 346172 | 3827.58 | 298 | 284 | 90.4 |
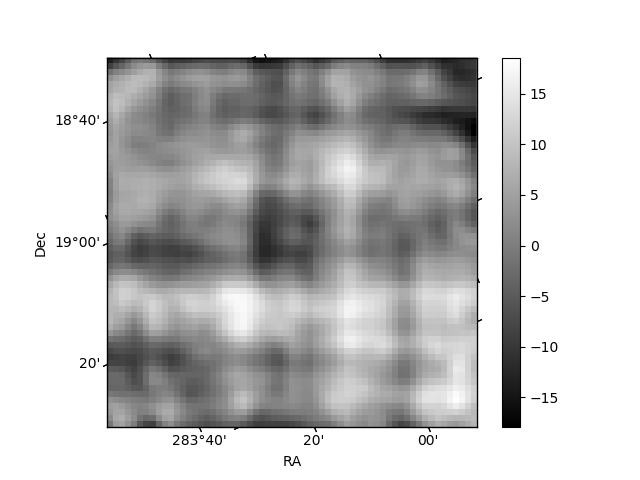
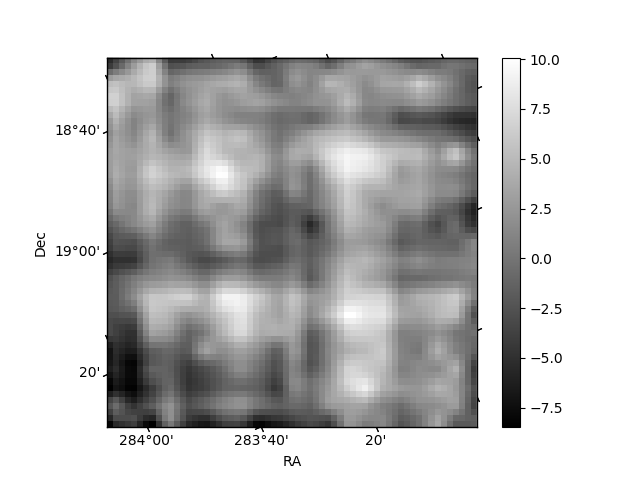
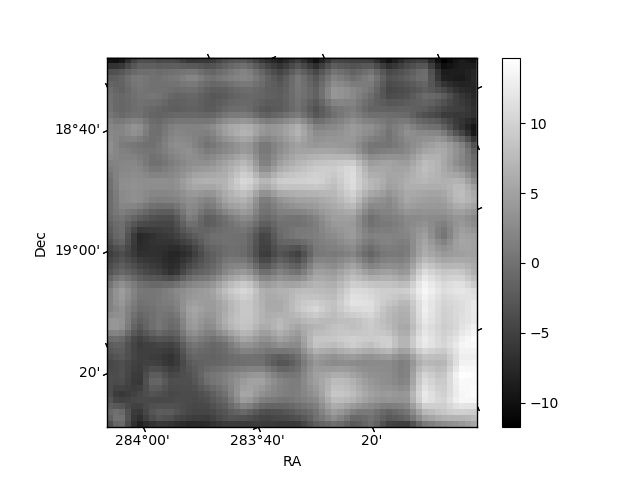
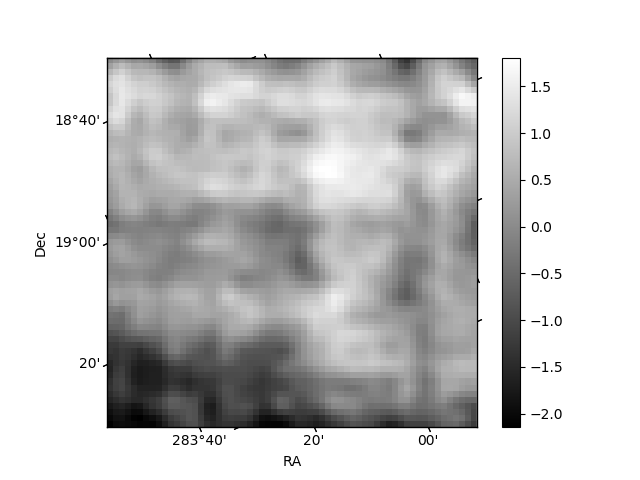
Histogram calculated using DETX and DETY for each event in the final _common_clean file
| Quadrant A | 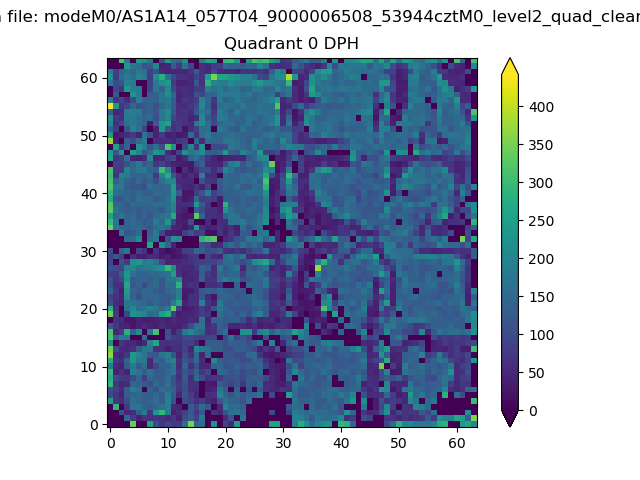 |
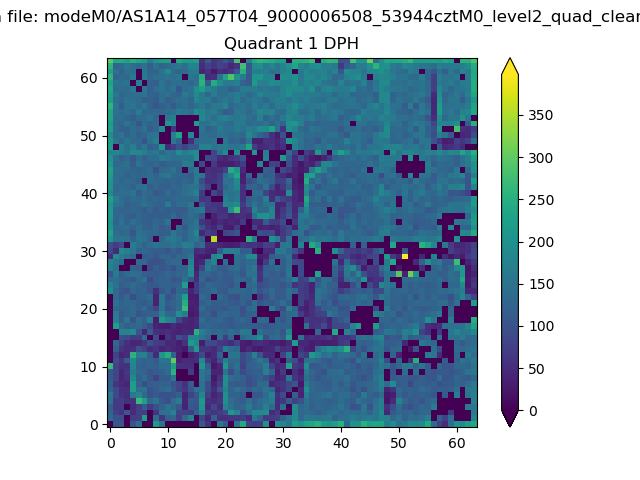 |
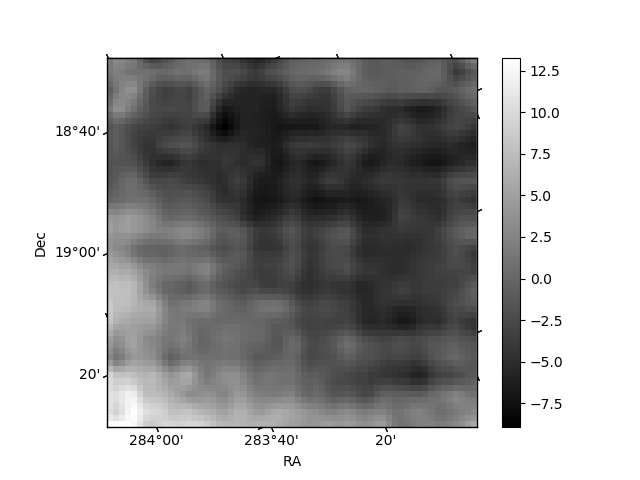
Quadrant B |
|---|---|---|---|
| Quadrant D | 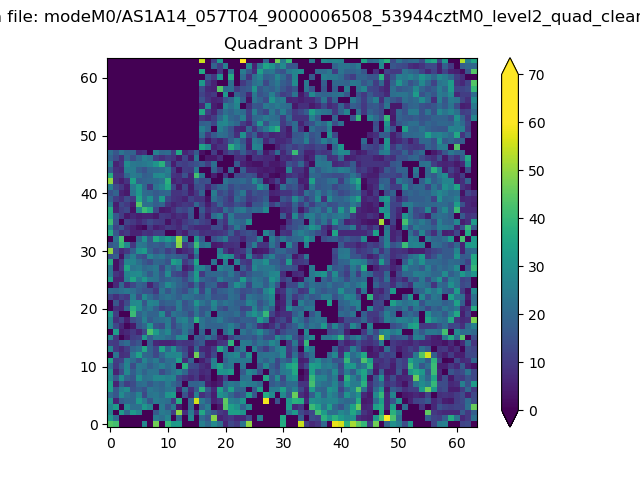 |
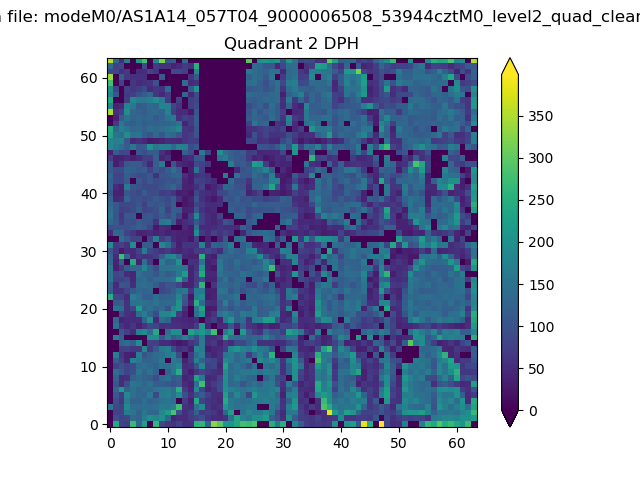 |
Quadrant C |
| Plot type | Count rate plots | Images |
|---|---|---|
| Comparison with Poisson distribution Blue bars denote a histogram of data divided into 1 sec bins. Red curve is a Poisson curve with rate = median count rate of data. |
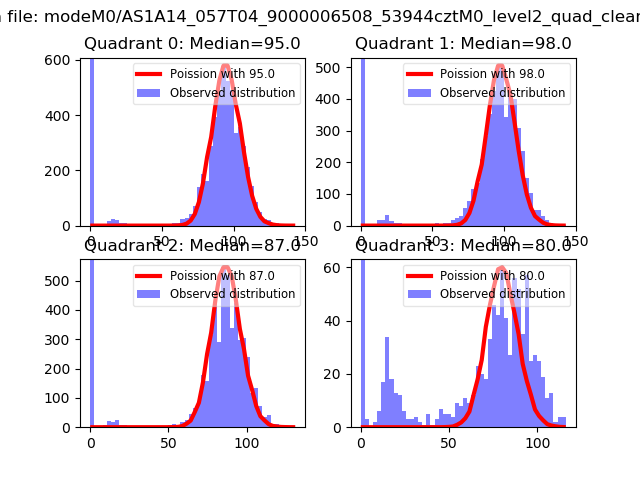 |
 |
| Quadrant-wise count rates Data is divided into 100 sec bins |
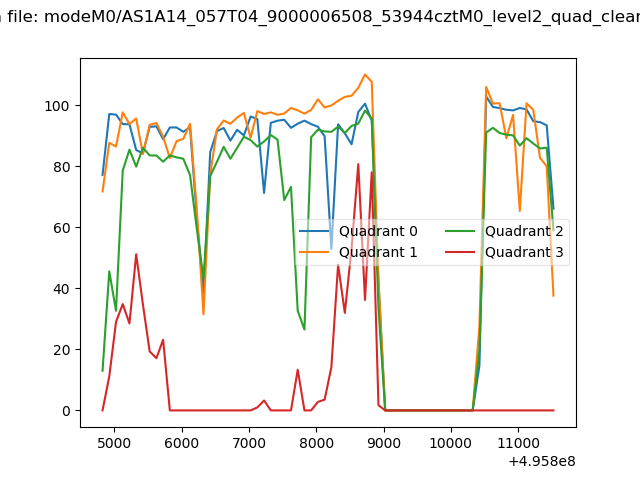 |
|
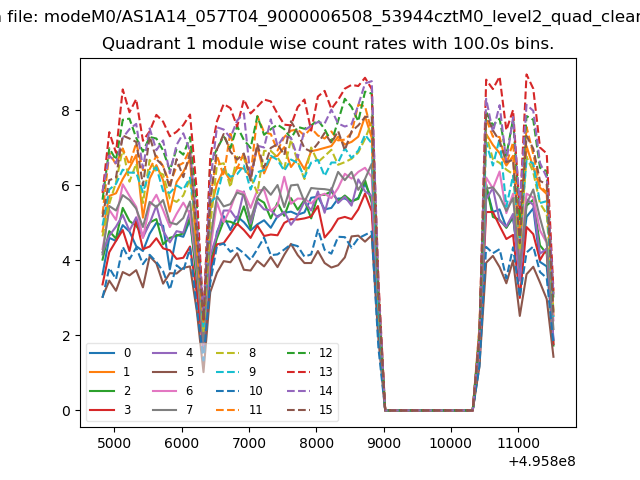
| Module-wise count rates for Quadrant A Data is divided into 100 sec bins |
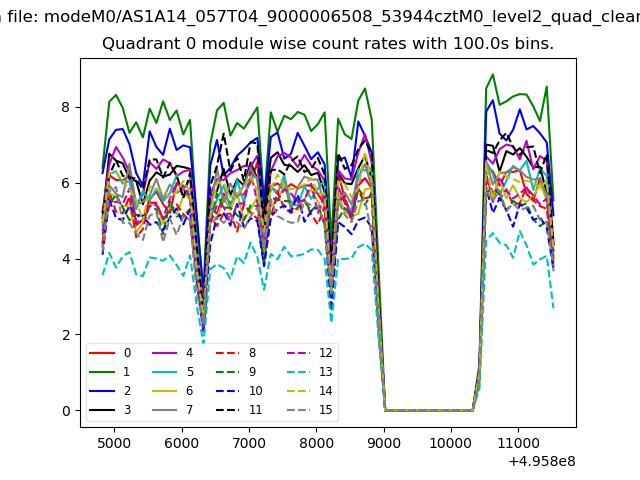 |
 |
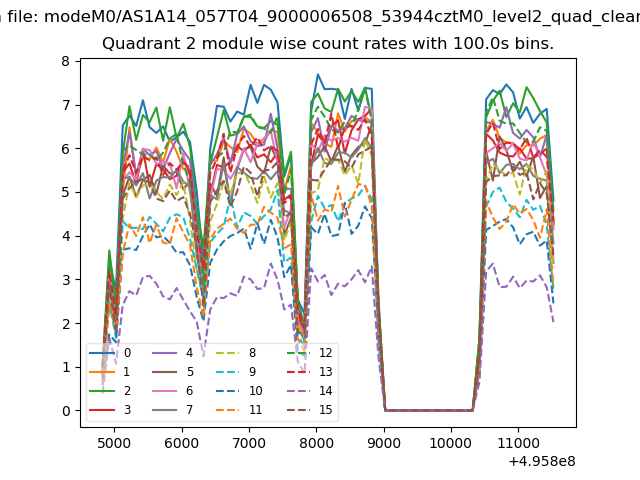
| Module-wise count rates for Quadrant B Data is divided into 100 sec bins |
 |
 |
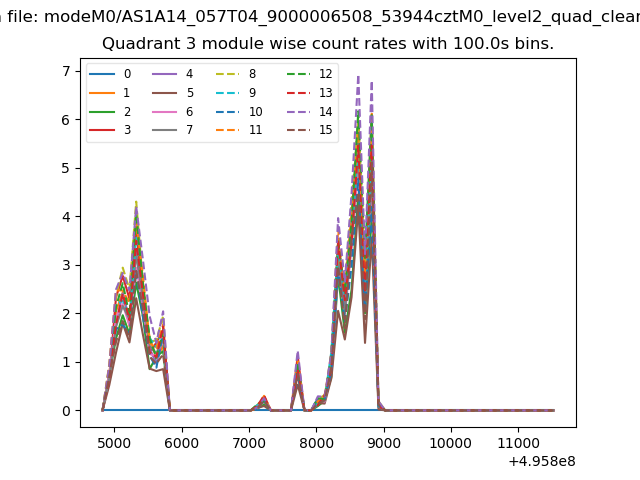
| Module-wise count rates for Quadrant C Data is divided into 100 sec bins |
 |
 |
| Module-wise count rates for Quadrant D Data is divided into 100 sec bins |
 |
 |
| Parameter | Plot |
|---|---|
| CZT HV Monitor | 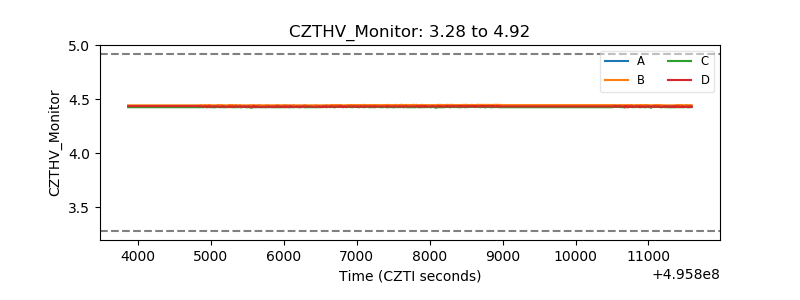 |
| D_VDD | 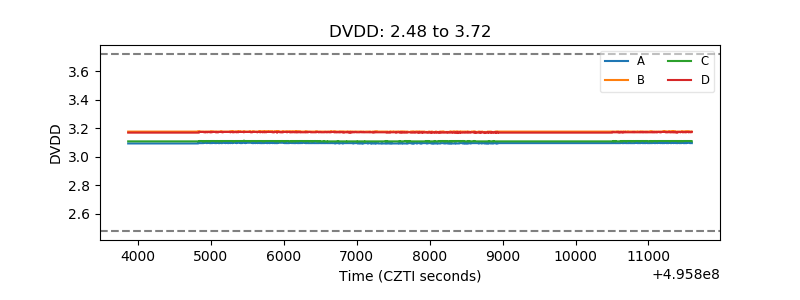 |
| Temperature 1 | 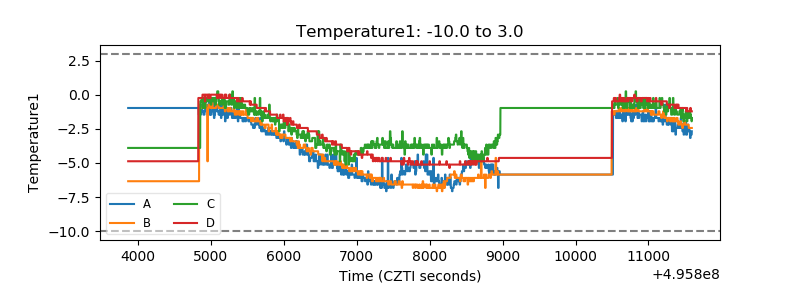 |
| Veto HV Monitor | 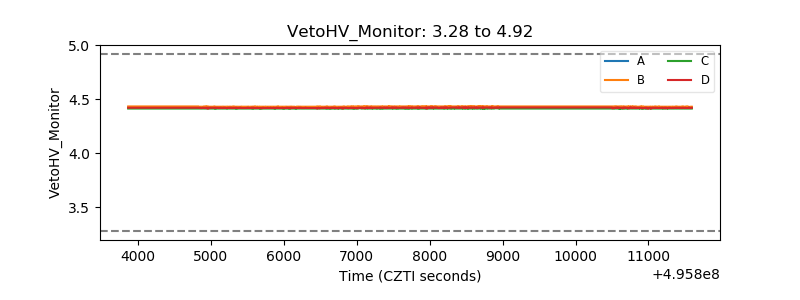 |
| Veto LLD | 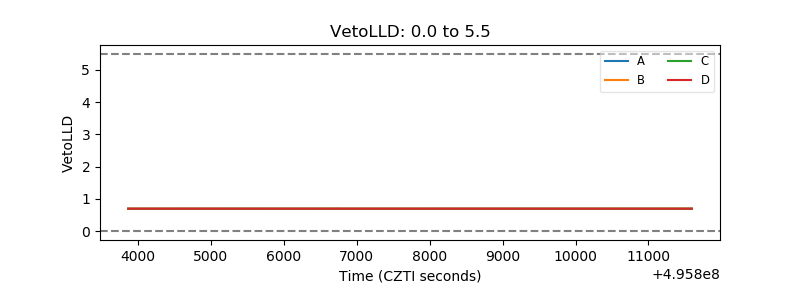 |
| Alpha Counter | 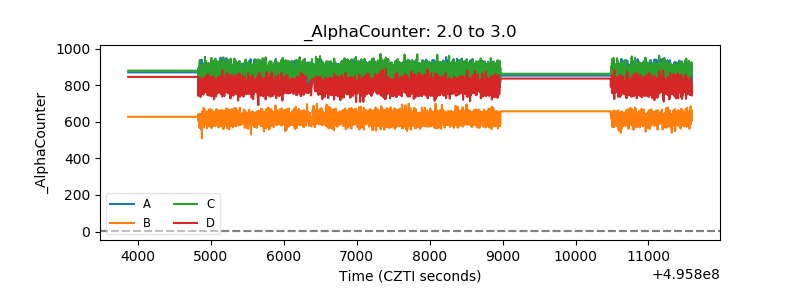 |
| _CPM_Rate | 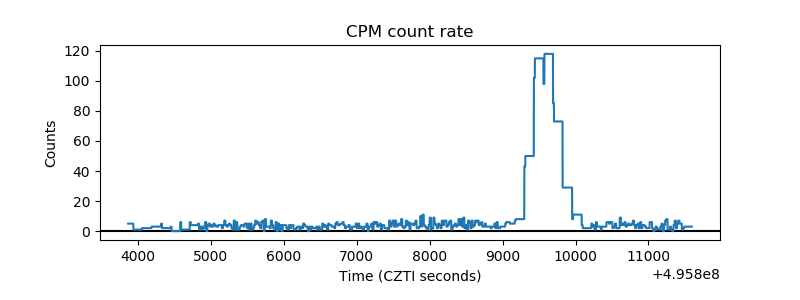 |
| CZT Counter | 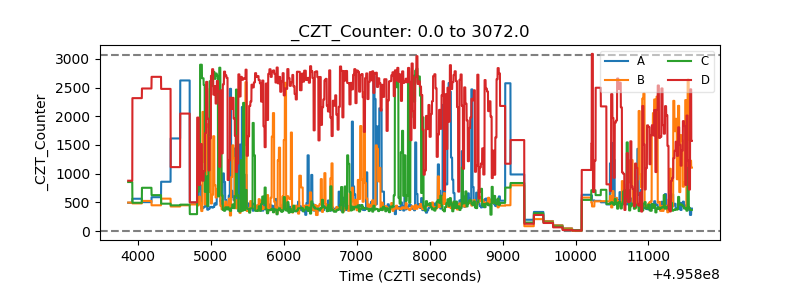 |
| +2.5 Volts monitor | 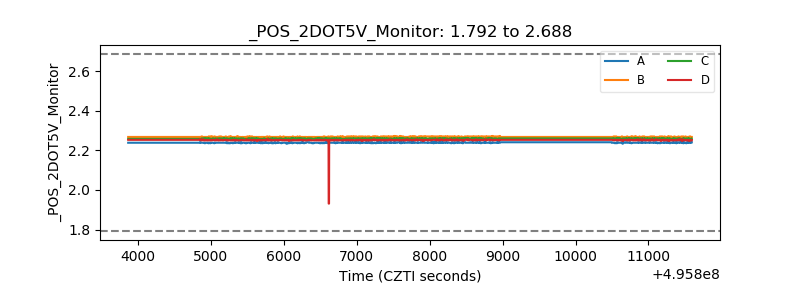 |
| +5 Volts monitor |  |
| _ROLL_ROT | 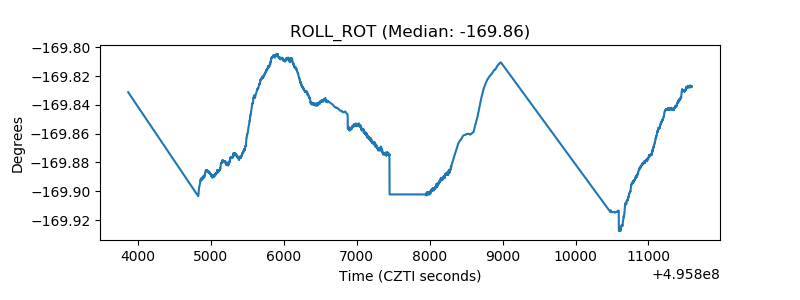 |
| _Roll_DEC | 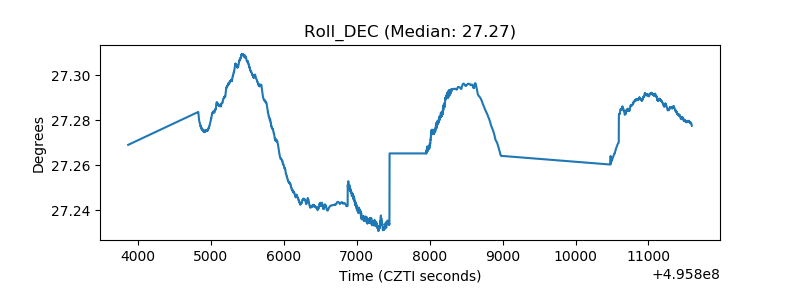 |
| _Roll_RA | 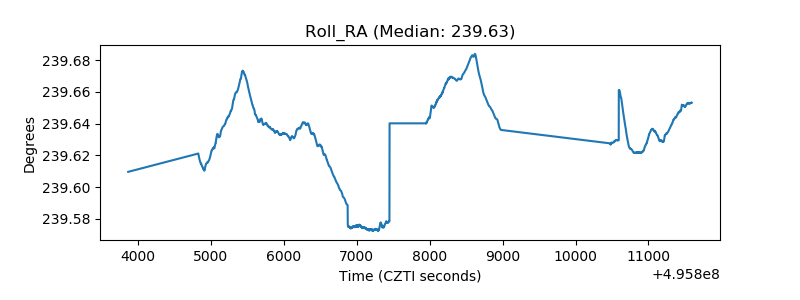 |
| Veto Counter | 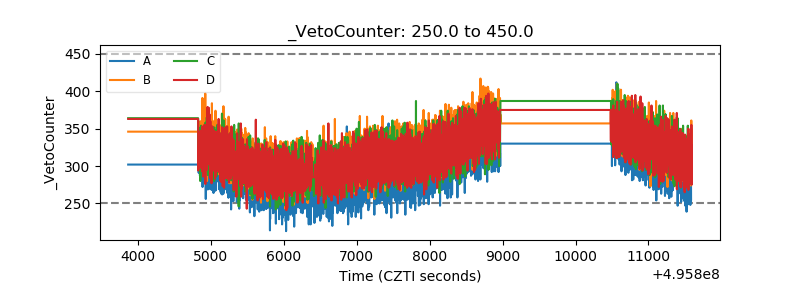 |