| Param | Original file | Final file |
|---|---|---|
| Filename | modeM0/AS1A14_057T04_9000006508_53945cztM0_level2.fits | modeM0/AS1A14_057T04_9000006508_53945cztM0_level2_quad_clean.evt |
| Size (bytes) | 524,545,920 | 51,762,240 |
| Size | 500.2 MB | 49.4 MB |
| Events in quadrant A | 2,294,292 | 434,928 |
| Events in quadrant B | 3,545,631 | 420,077 |
| Events in quadrant C | 3,841,790 | 346,945 |
| Events in quadrant D | 9,371,723 | 37,928 |
| Mode M0 | |||
|---|---|---|---|
| Quadrant | BADHDUFLAG | Total packets | Discarded packets |
| A | 0 | 11076 | 967 |
| B | 0 | 15791 | 2014 |
| C | 0 | 16436 | 1408 |
| D | 0 | 33915 | 2926 |
| Mode SS | |||
|---|---|---|---|
| Quadrant | BADHDUFLAG | Total packets | Discarded packets |
| A | 0 | 107 | 9 |
| B | 0 | 108 | 10 |
| C | 0 | 106 | 8 |
| D | 0 | 108 | 13 |
| Mode M9 | |||
|---|---|---|---|
| Quadrant | BADHDUFLAG | Total packets | Discarded packets |
| A | 0 | 9 | 1 |
| B | 0 | 8 | 0 |
| C | 0 | 8 | 0 |
| D | 0 | 8 | 0 |
| Quadrant | Total seconds | Saturated seconds | Saturation percentage |
|---|---|---|---|
| A | 4684 | 72 | 1.537148% |
| B | 4645 | 481 | 10.355221% |
| C | 4686 | 773 | 16.495945% |
| D | 4591 | 4196 | 91.396210% |
Noise dominated data is calculated using 1-second bins in cleaned event files. If a bin has >2000 counts, and if more than 50% of those come from <1% of pixels, then it is considered to be noise-dominated and hence unusable.
| Quadrant | # 1 sec bins | Bins with >0 counts | Bins with >2000 counts | High rate bins dominated by noise | Noise dominated (total time) | Noise dominated (detector-on time) | Marked lightcurve |
|---|---|---|---|---|---|---|---|
| A | 6662 | 4758 | 32 | 32 | 0.48% | 0.67% | 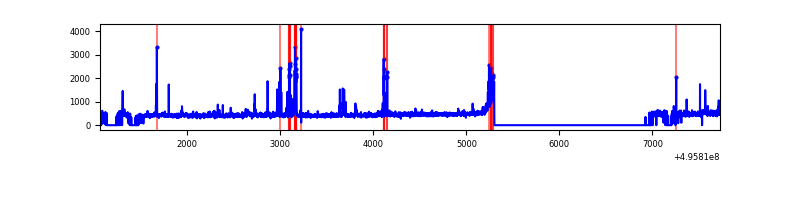 |
| B | 6649 | 4707 | 375 | 375 | 5.64% | 7.97% | 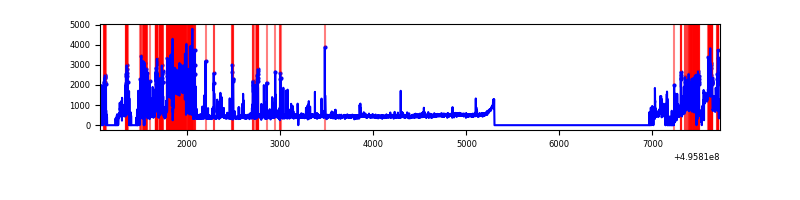 |
| C | 6664 | 4759 | 727 | 727 | 10.91% | 15.28% | 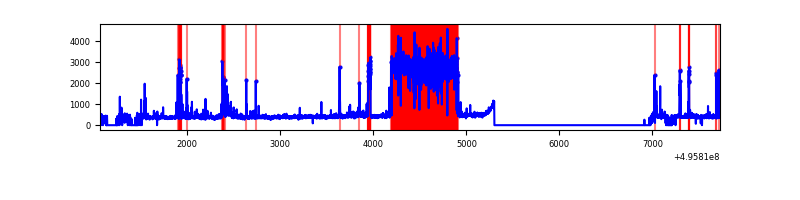 |
| D | 6651 | 4625 | 2521 | 2521 | 37.90% | 54.51% | 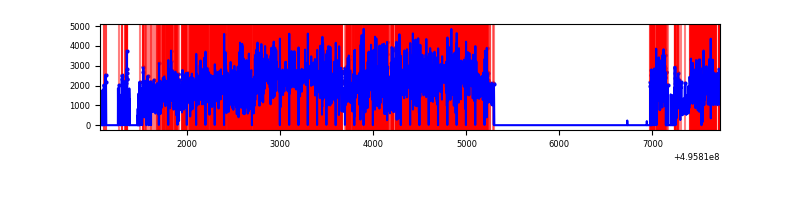 |
Top three noisy pixels from each quadrant. If the there are fewer than three noisy pixels in the level2.evt file, extra rows are filled as -1
| Pixel properties | Quadrant properties | ||||||
|---|---|---|---|---|---|---|---|
| Quadrant | DetID | PixID | Counts | Sigma | Mean | Median | Sigma |
| A | 0 | 8 | 117359 | 973.76 | 482 | 470 | 120.0 |
| A | 3 | 14 | 105971 | 878.89 | 482 | 470 | 120.0 |
| A | 15 | 174 | 89508 | 741.75 | 482 | 470 | 120.0 |
| B | 0 | 213 | 1371240 | 13803.43 | 462 | 447 | 99.3 |
| B | 5 | 236 | 172276 | 1730.26 | 462 | 447 | 99.3 |
| B | 4 | 81 | 39805 | 396.32 | 462 | 447 | 99.3 |
| C | 1 | 241 | 1967883 | 16848.51 | 421 | 417 | 116.8 |
| C | 15 | 148 | 71107 | 605.36 | 421 | 417 | 116.8 |
| C | 14 | 246 | 36093 | 305.51 | 421 | 417 | 116.8 |
| D | 8 | 176 | 6926501 | 225003.43 | 101 | 96 | 30.8 |
| D | 3 | 12 | 1055096 | 34271.55 | 101 | 96 | 30.8 |
| D | 2 | 165 | 675354 | 21935.67 | 101 | 96 | 30.8 |
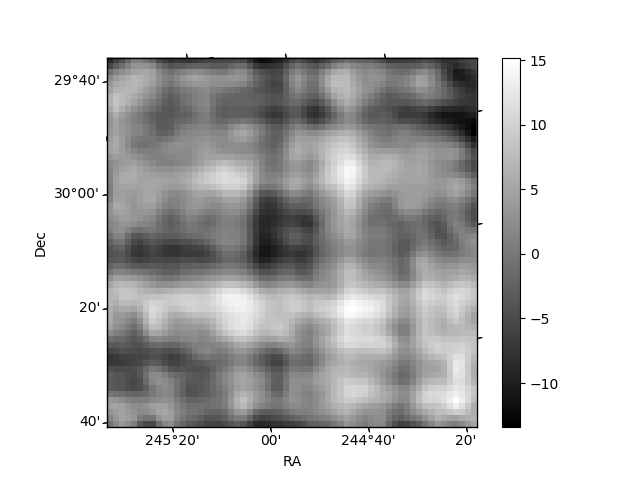
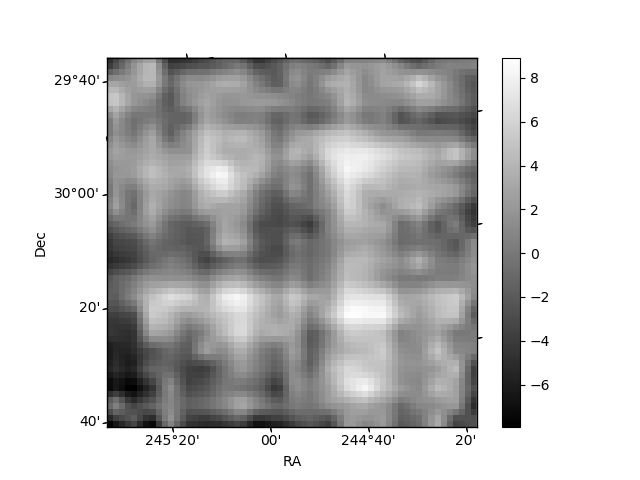
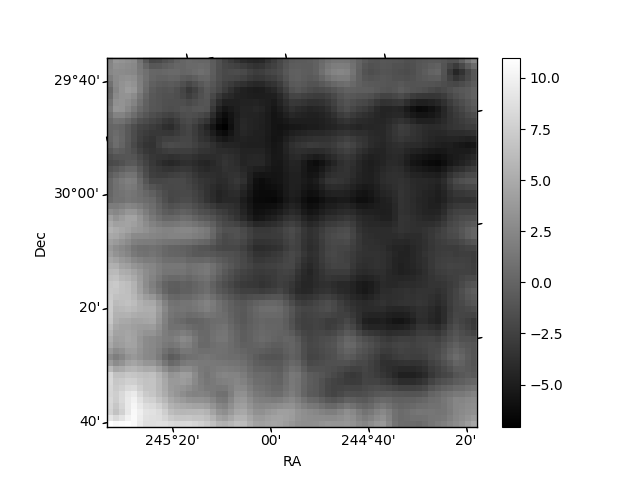
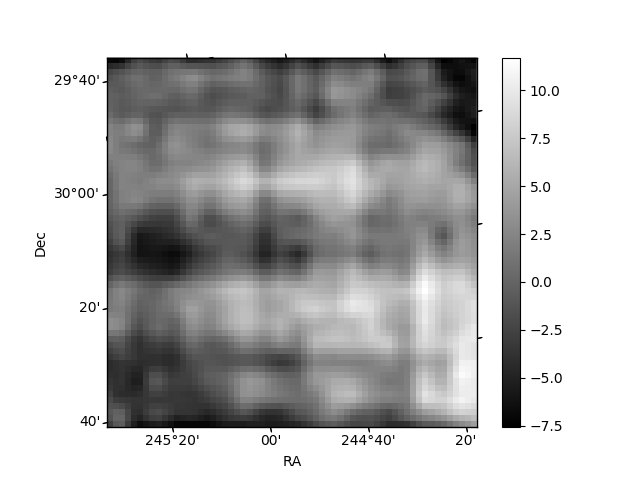
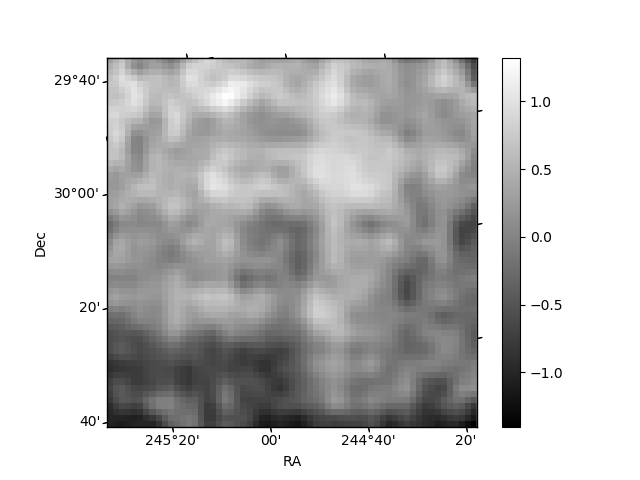
Histogram calculated using DETX and DETY for each event in the final _common_clean file
| Quadrant A | 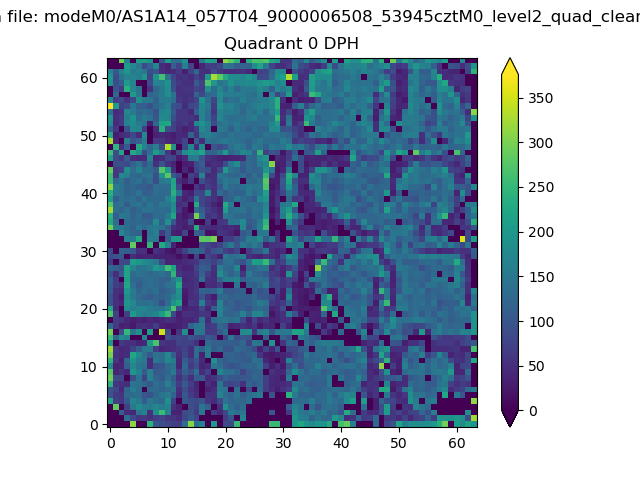 |
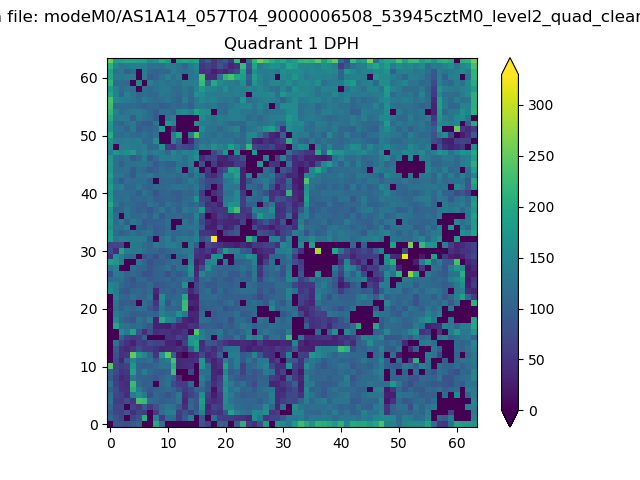 |
Quadrant B |
|---|---|---|---|
| Quadrant D | 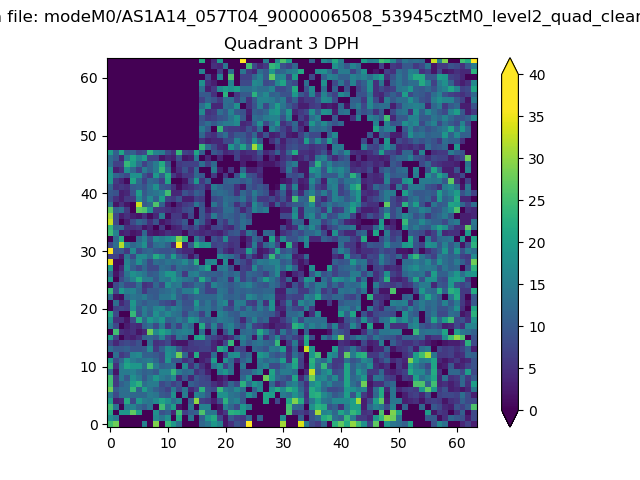 |
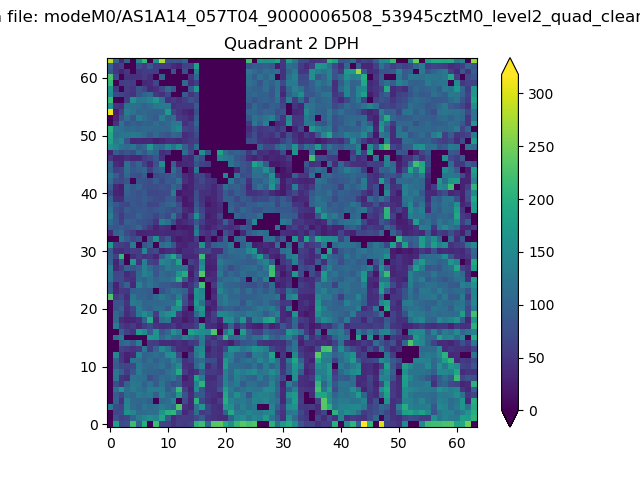 |
Quadrant C |
| Plot type | Count rate plots | Images |
|---|---|---|
| Comparison with Poisson distribution Blue bars denote a histogram of data divided into 1 sec bins. Red curve is a Poisson curve with rate = median count rate of data. |
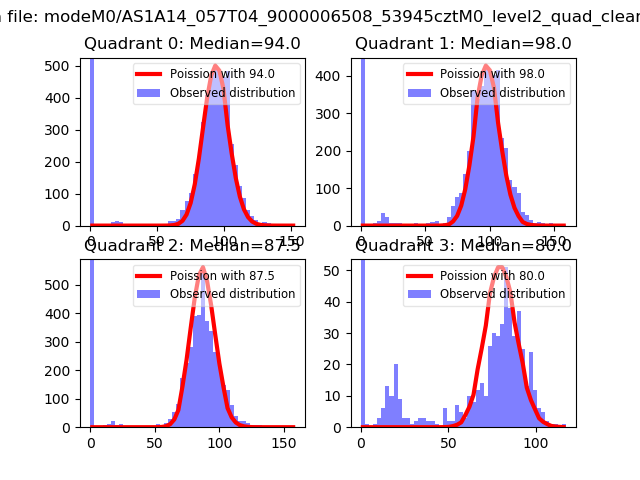 |
 |
| Quadrant-wise count rates Data is divided into 100 sec bins |
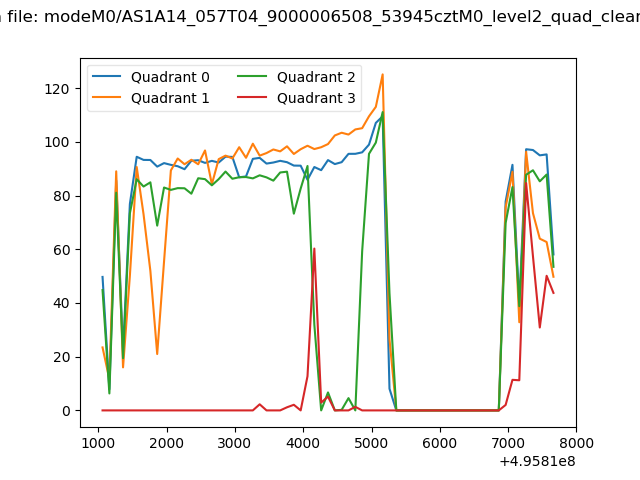 |
|
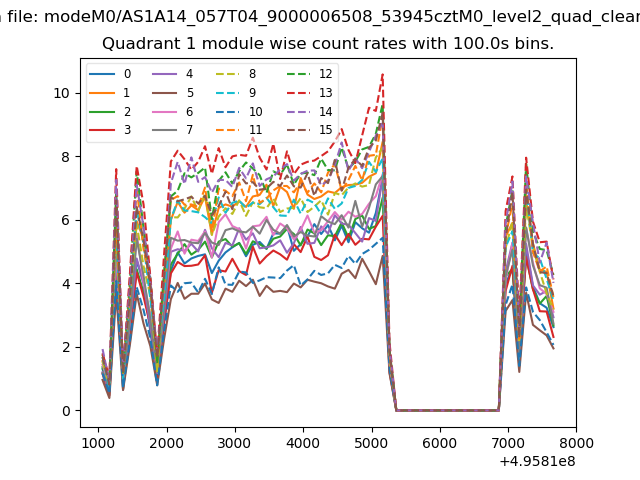
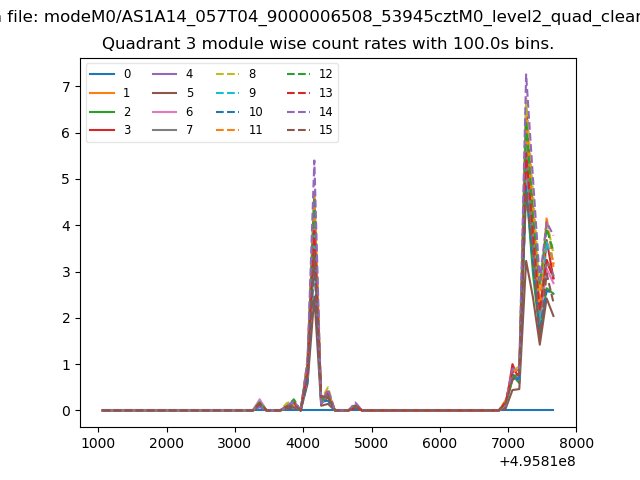
| Module-wise count rates for Quadrant A Data is divided into 100 sec bins |
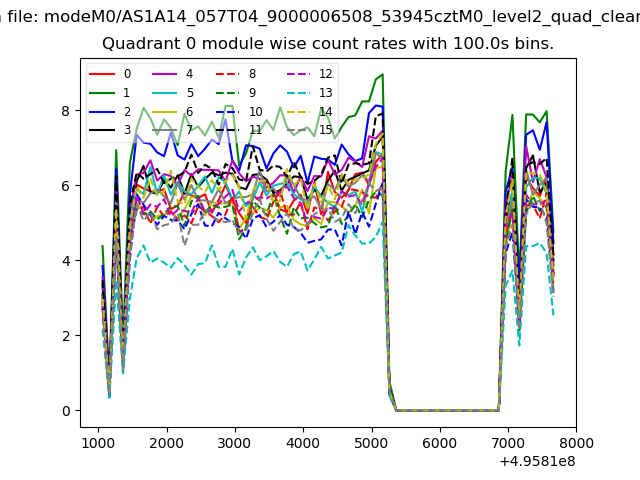 |
 |
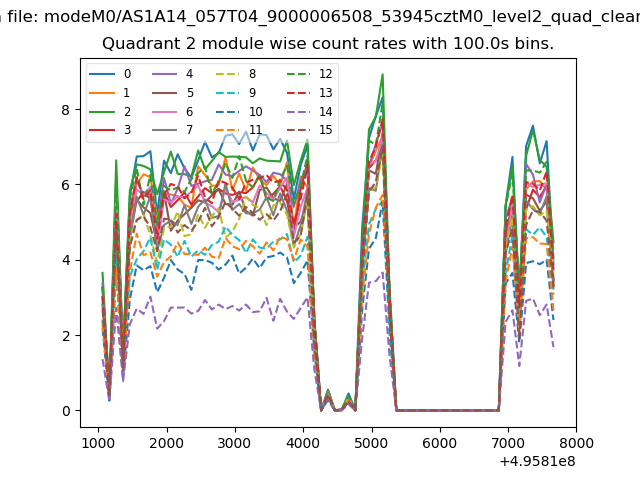
| Module-wise count rates for Quadrant B Data is divided into 100 sec bins |
 |
 |
| Module-wise count rates for Quadrant C Data is divided into 100 sec bins |
 |
 |
| Module-wise count rates for Quadrant D Data is divided into 100 sec bins |
 |
 |
| Parameter | Plot |
|---|---|
| CZT HV Monitor | 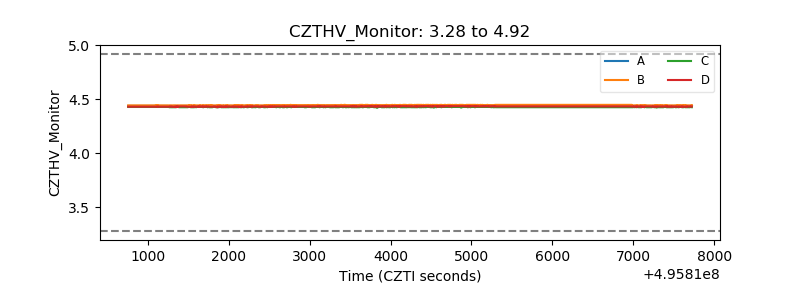 |
| D_VDD | 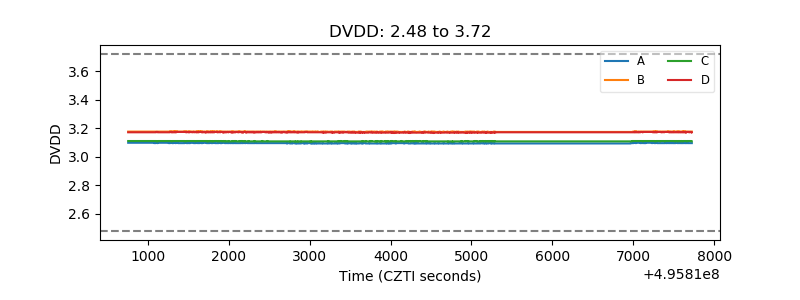 |
| Temperature 1 | 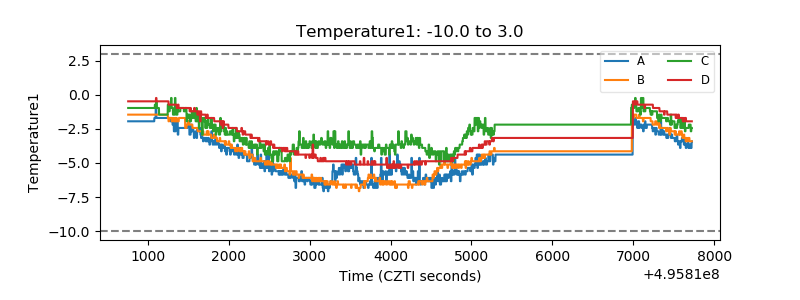 |
| Veto HV Monitor | 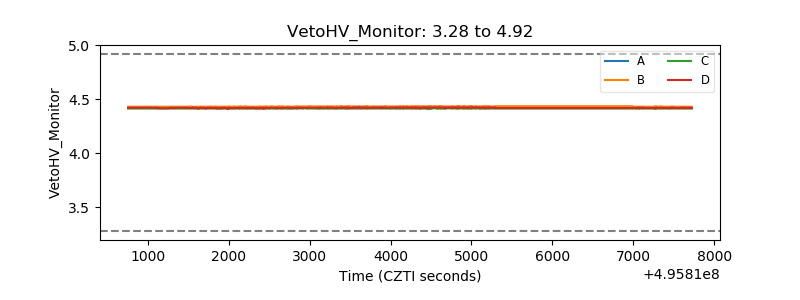 |
| Veto LLD | 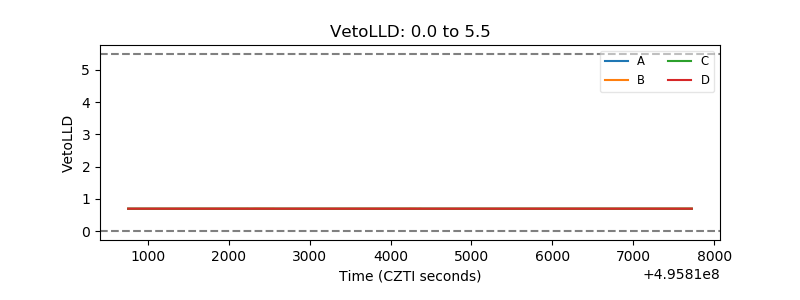 |
| Alpha Counter | 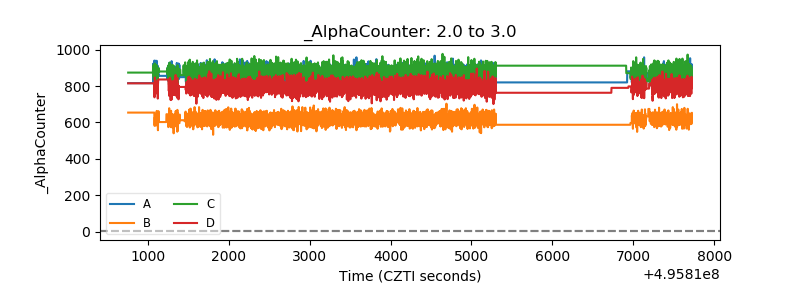 |
| _CPM_Rate | 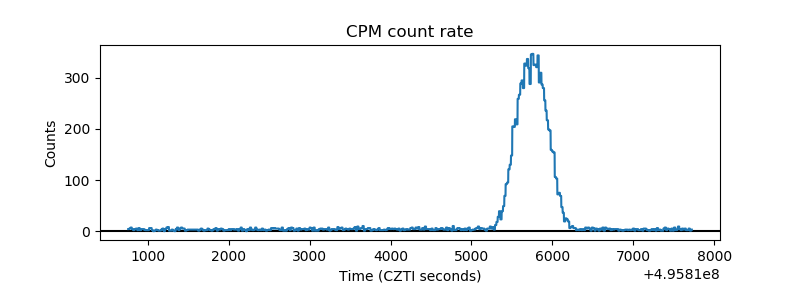 |
| CZT Counter | 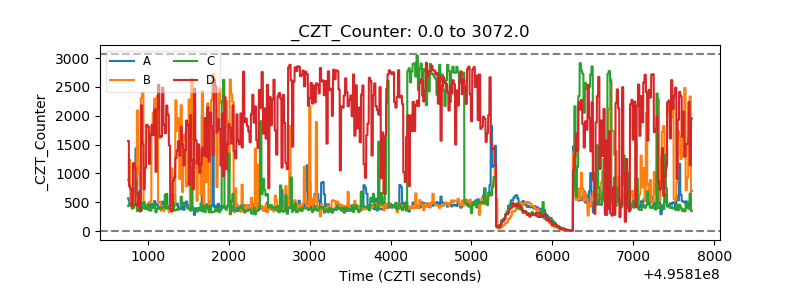 |
| +2.5 Volts monitor |  |
| +5 Volts monitor |  |
| _ROLL_ROT | 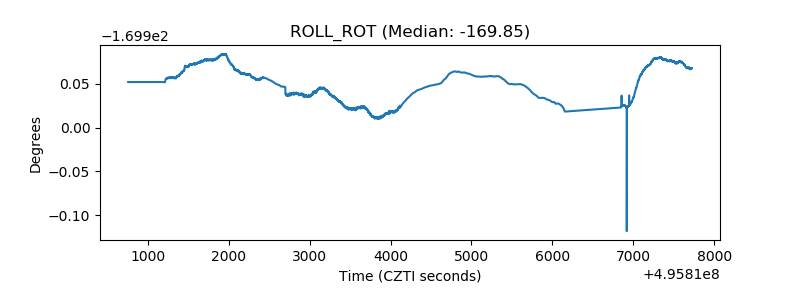 |
| _Roll_DEC | 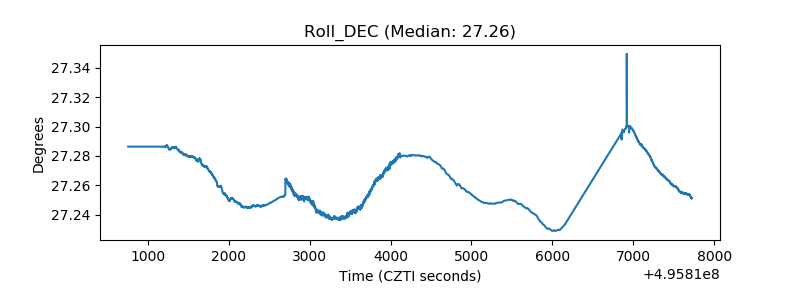 |
| _Roll_RA | 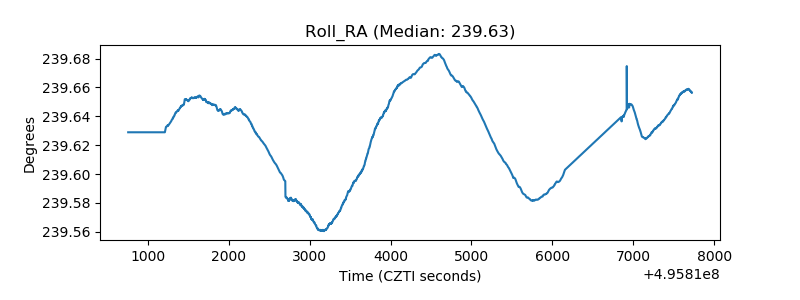 |
| Veto Counter | 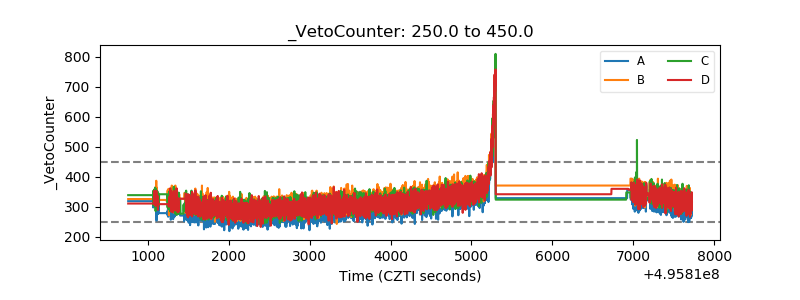 |