| Param | Original file | Final file |
|---|---|---|
| Filename | modeM0/AS1A14_057T04_9000006508_53947cztM0_level2.fits | modeM0/AS1A14_057T04_9000006508_53947cztM0_level2_quad_clean.evt |
| Size (bytes) | 3,296,828,160 | 322,937,280 |
| Size | 3.1 GB | 308.0 MB |
| Events in quadrant A | 15,998,115 | 2,643,534 |
| Events in quadrant B | 17,797,287 | 2,738,016 |
| Events in quadrant C | 29,324,545 | 2,025,529 |
| Events in quadrant D | 56,726,428 | 420,894 |
| Mode M0 | |||
|---|---|---|---|
| Quadrant | BADHDUFLAG | Total packets | Discarded packets |
| A | 0 | 66665 | 4 |
| B | 0 | 72609 | 4 |
| C | 0 | 107468 | 4 |
| D | 0 | 188026 | 29 |
| Mode SS | |||
|---|---|---|---|
| Quadrant | BADHDUFLAG | Total packets | Discarded packets |
| A | 0 | 578 | 0 |
| B | 0 | 578 | 0 |
| C | 0 | 578 | 0 |
| D | 0 | 578 | 0 |
| Mode M9 | |||
|---|---|---|---|
| Quadrant | BADHDUFLAG | Total packets | Discarded packets |
| A | 0 | 31 | 0 |
| B | 0 | 31 | 0 |
| C | 0 | 31 | 0 |
| D | 0 | 31 | 0 |
| Quadrant | Total seconds | Saturated seconds | Saturation percentage |
|---|---|---|---|
| A | 28327 | 1103 | 3.893812% |
| B | 28328 | 1753 | 6.188224% |
| C | 28328 | 6445 | 22.751341% |
| D | 28321 | 23919 | 84.456764% |
Noise dominated data is calculated using 1-second bins in cleaned event files. If a bin has >2000 counts, and if more than 50% of those come from <1% of pixels, then it is considered to be noise-dominated and hence unusable.
| Quadrant | # 1 sec bins | Bins with >0 counts | Bins with >2000 counts | High rate bins dominated by noise | Noise dominated (total time) | Noise dominated (detector-on time) | Marked lightcurve |
|---|---|---|---|---|---|---|---|
| A | 31517 | 28331 | 494 | 494 | 1.57% | 1.74% | 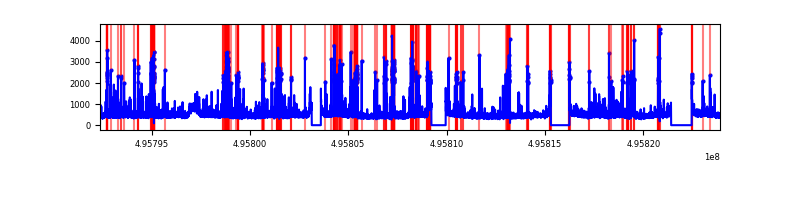 |
| B | 31518 | 28332 | 934 | 934 | 2.96% | 3.30% | 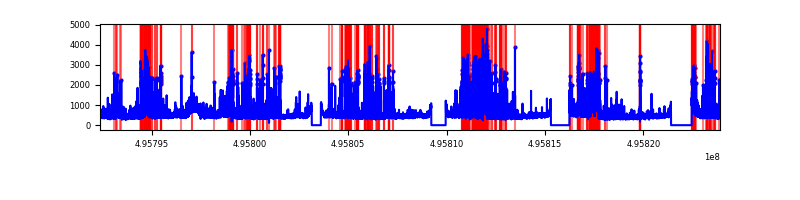 |
| C | 31518 | 28332 | 5722 | 5722 | 18.15% | 20.20% | 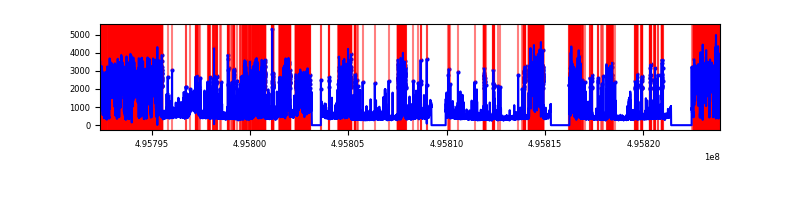 |
| D | 31517 | 28323 | 15417 | 15417 | 48.92% | 54.43% | 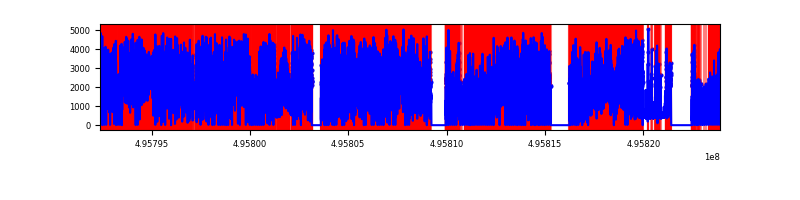 |
Top three noisy pixels from each quadrant. If the there are fewer than three noisy pixels in the level2.evt file, extra rows are filled as -1
| Pixel properties | Quadrant properties | ||||||
|---|---|---|---|---|---|---|---|
| Quadrant | DetID | PixID | Counts | Sigma | Mean | Median | Sigma |
| A | 15 | 174 | 1618189 | 2123.88 | 3064 | 2991 | 760.5 |
| A | 3 | 14 | 556726 | 728.12 | 3064 | 2991 | 760.5 |
| A | 0 | 8 | 508996 | 665.36 | 3064 | 2991 | 760.5 |
| B | 0 | 213 | 3755837 | 5848.38 | 2999 | 2886 | 641.7 |
| B | 0 | 155 | 334063 | 516.09 | 2999 | 2886 | 641.7 |
| B | 1 | 223 | 242677 | 373.68 | 2999 | 2886 | 641.7 |
| C | 1 | 241 | 14585308 | 19813.48 | 2671 | 2643 | 736.0 |
| C | 15 | 148 | 1358159 | 1841.74 | 2671 | 2643 | 736.0 |
| C | 15 | 157 | 489362 | 661.3 | 2671 | 2643 | 736.0 |
| D | 8 | 176 | 44818628 | 145358.4 | 1052 | 1004 | 308.3 |
| D | 2 | 165 | 2378597 | 7711.32 | 1052 | 1004 | 308.3 |
| D | 3 | 12 | 1470040 | 4764.57 | 1052 | 1004 | 308.3 |
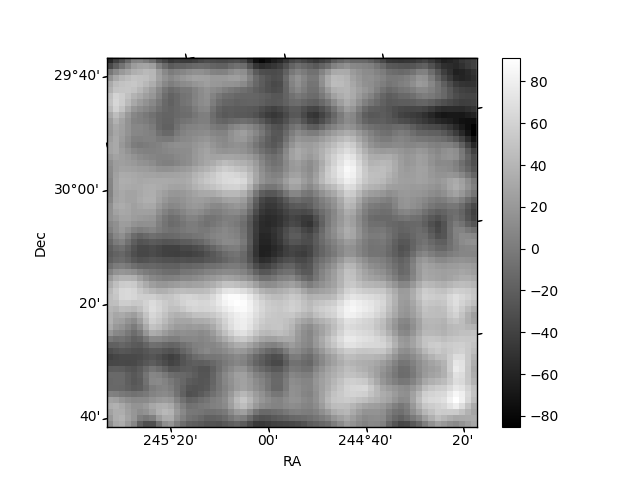
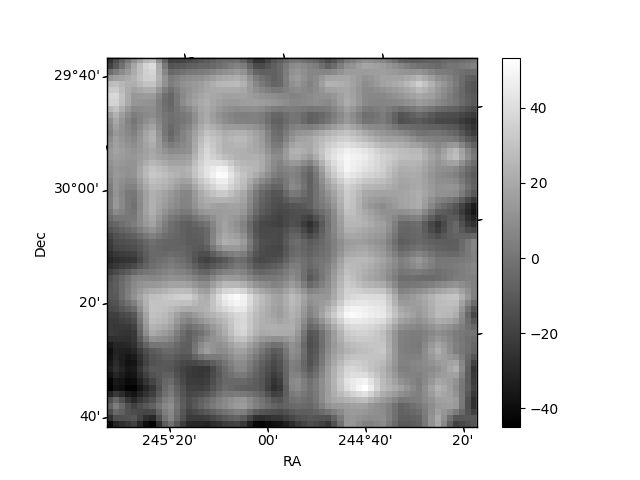
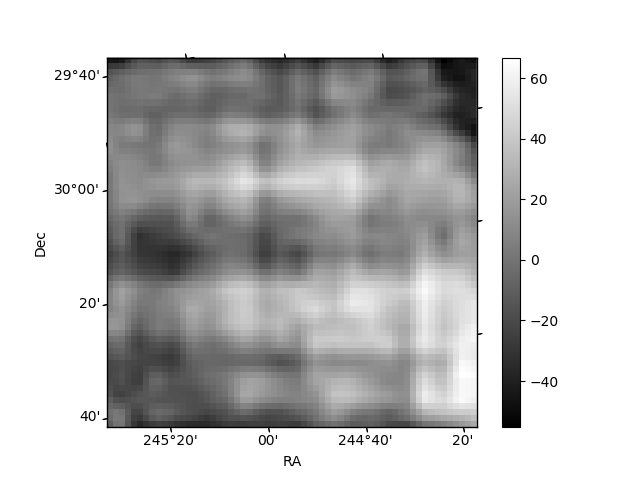
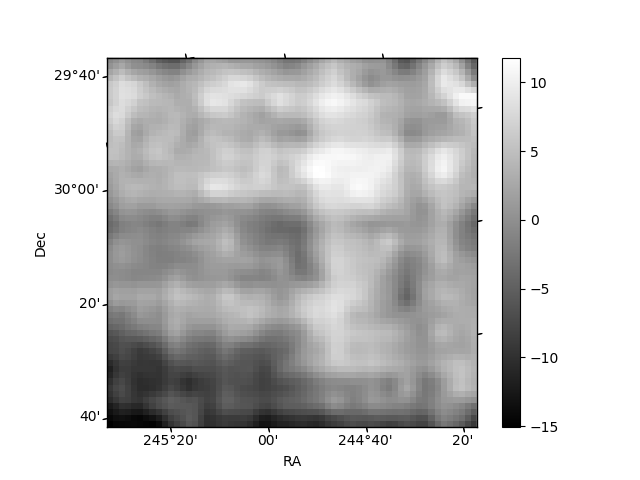
Histogram calculated using DETX and DETY for each event in the final _common_clean file
| Quadrant A | 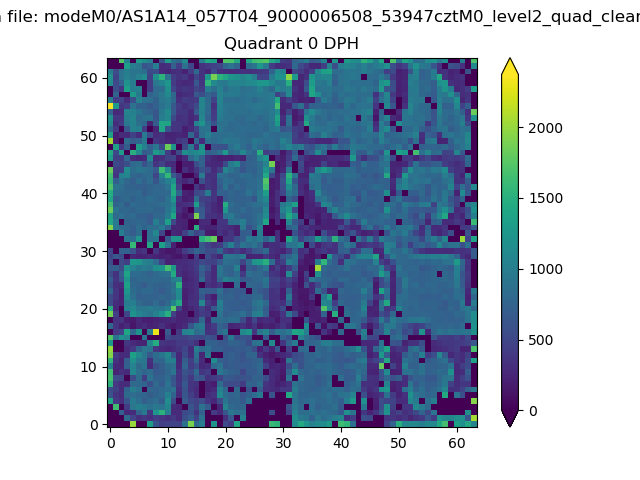 |
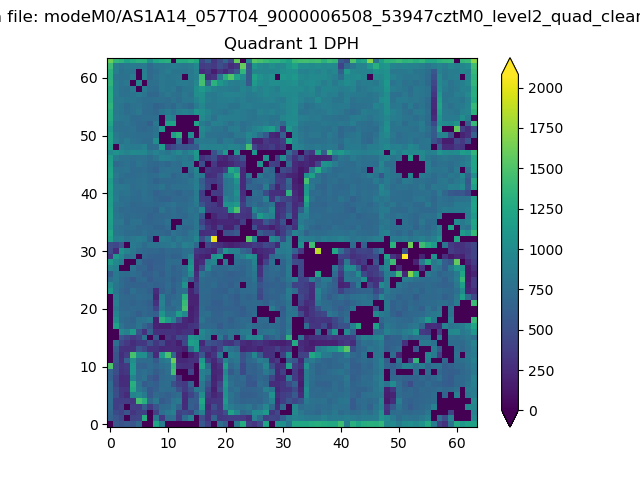 |
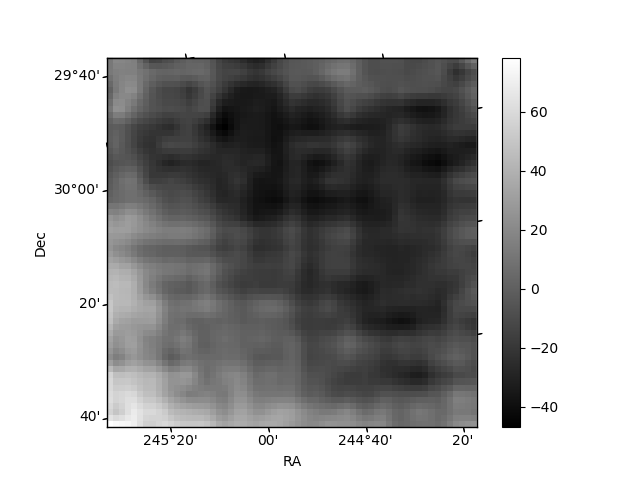
Quadrant B |
|---|---|---|---|
| Quadrant D | 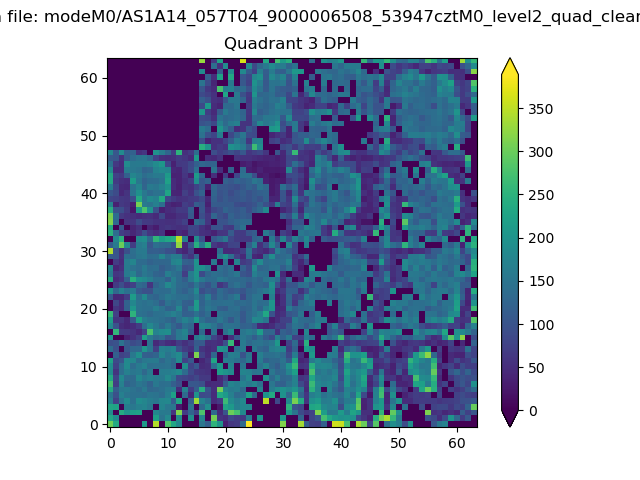 |
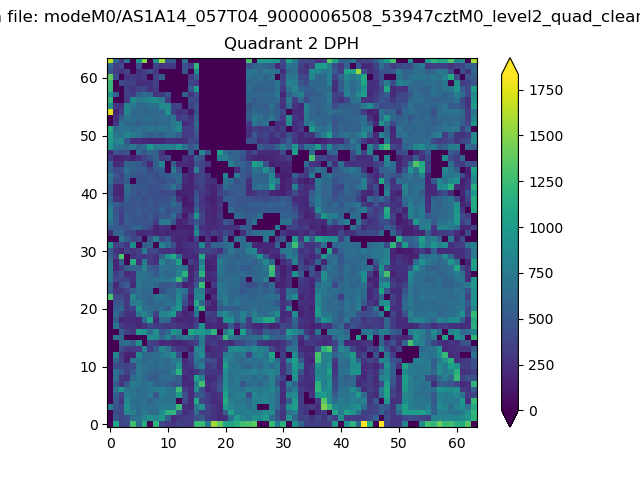 |
Quadrant C |
| Plot type | Count rate plots | Images |
|---|---|---|
| Comparison with Poisson distribution Blue bars denote a histogram of data divided into 1 sec bins. Red curve is a Poisson curve with rate = median count rate of data. |
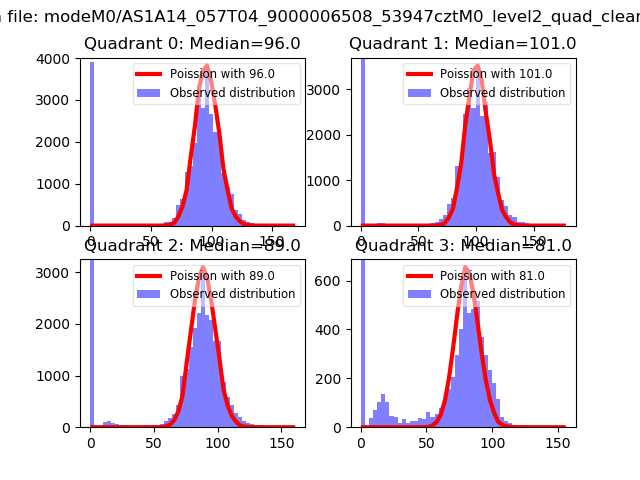 |
 |
| Quadrant-wise count rates Data is divided into 100 sec bins |
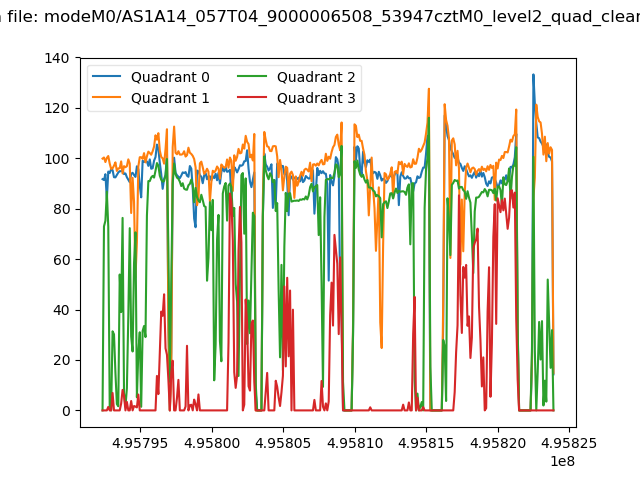 |
|
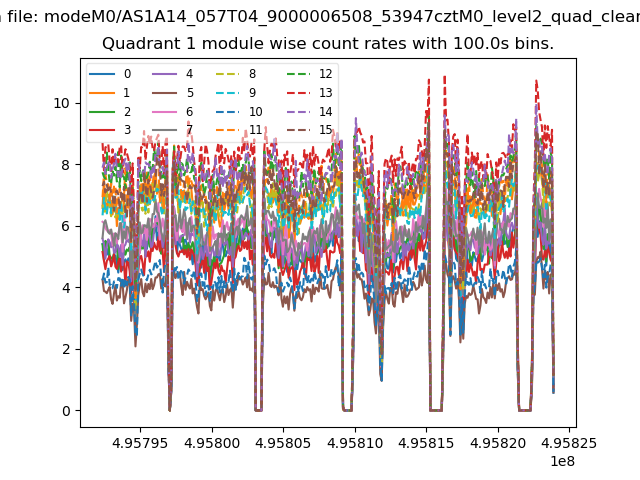
| Module-wise count rates for Quadrant A Data is divided into 100 sec bins |
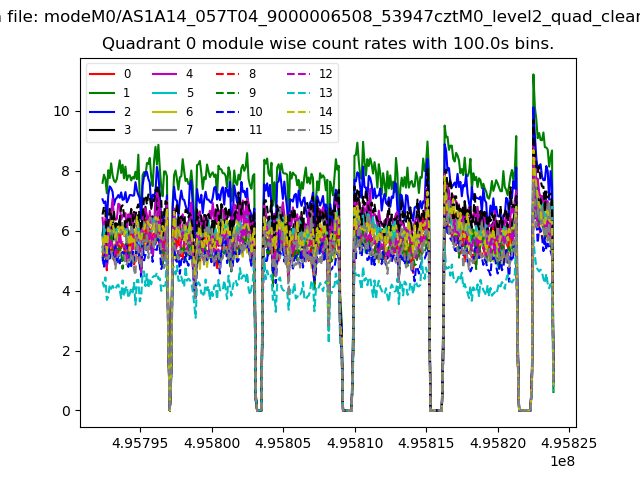 |
 |
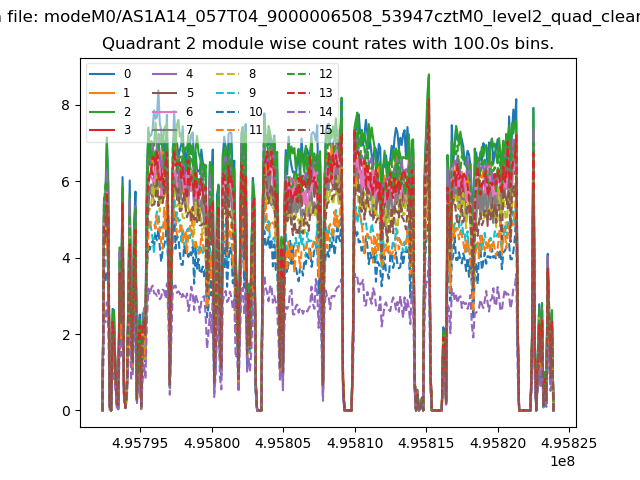
| Module-wise count rates for Quadrant B Data is divided into 100 sec bins |
 |
 |
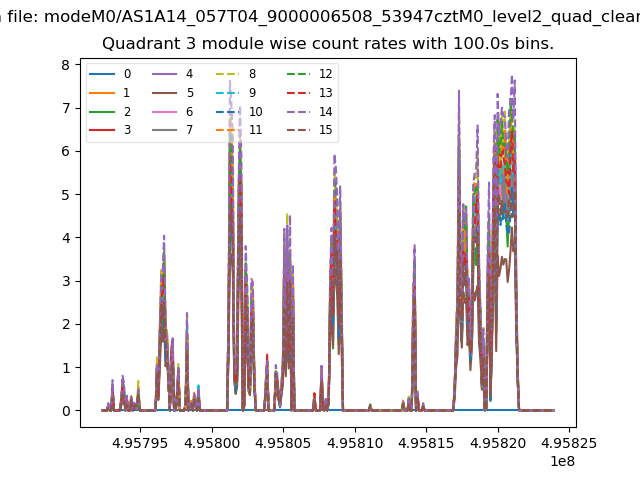
| Module-wise count rates for Quadrant C Data is divided into 100 sec bins |
 |
 |
| Module-wise count rates for Quadrant D Data is divided into 100 sec bins |
 |
 |
| Parameter | Plot |
|---|---|
| CZT HV Monitor | 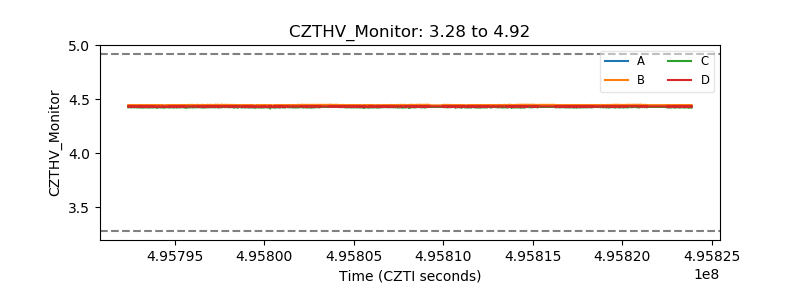 |
| D_VDD |  |
| Temperature 1 | 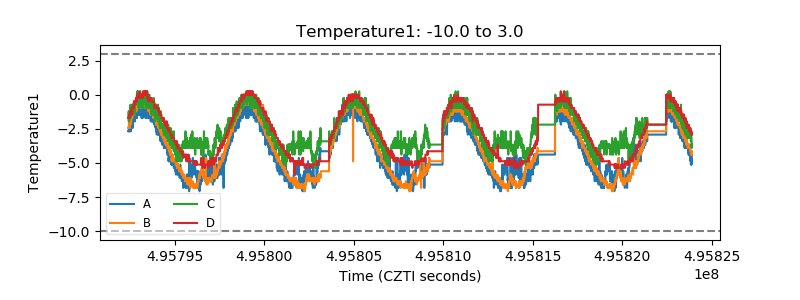 |
| Veto HV Monitor | 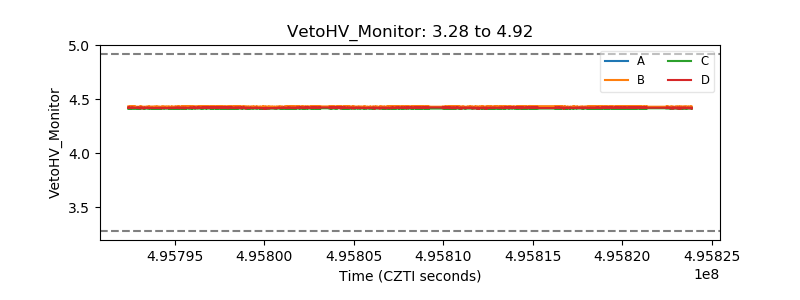 |
| Veto LLD | 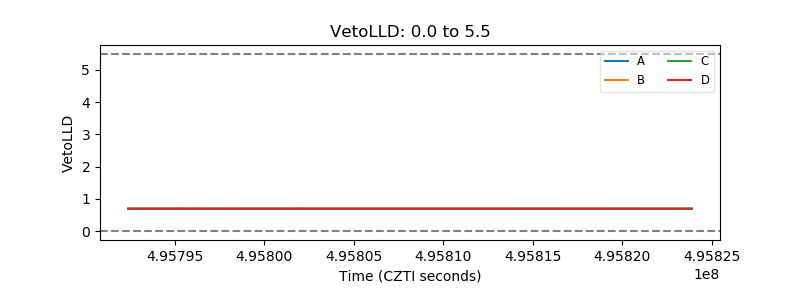 |
| Alpha Counter | 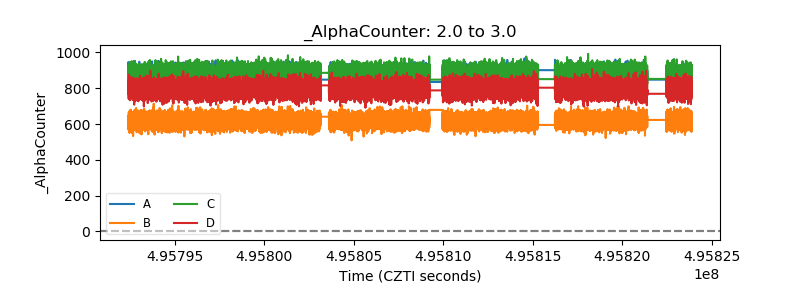 |
| _CPM_Rate | 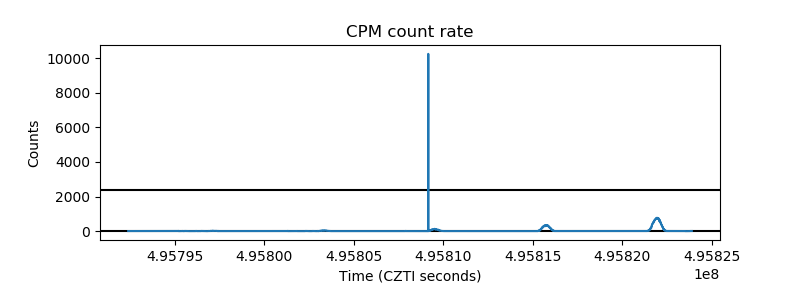 |
| CZT Counter | 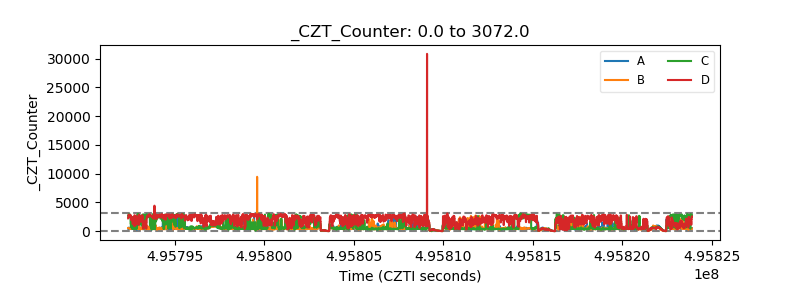 |
| +2.5 Volts monitor | 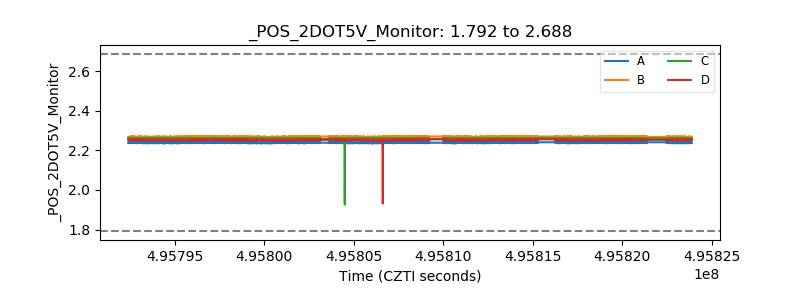 |
| +5 Volts monitor | 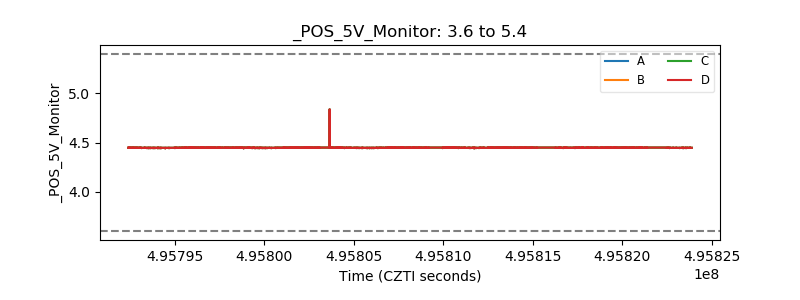 |
| _ROLL_ROT | 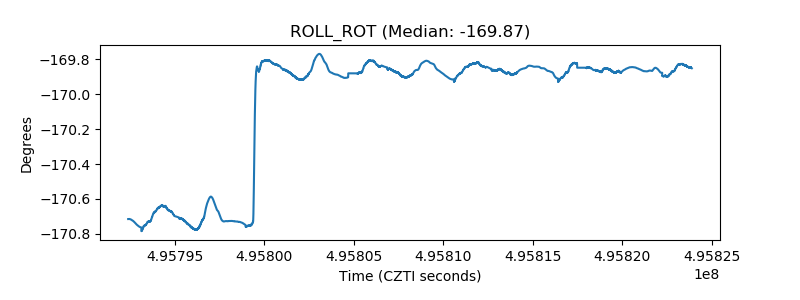 |
| _Roll_DEC | 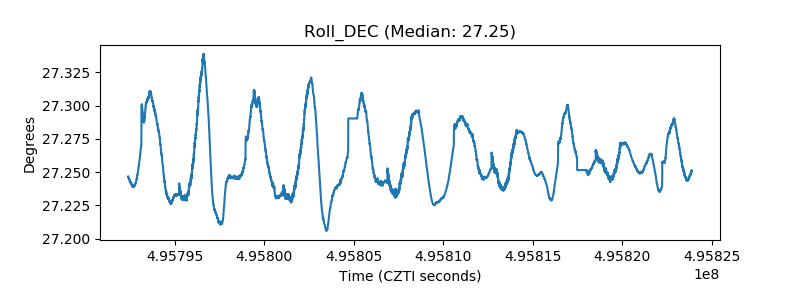 |
| _Roll_RA | 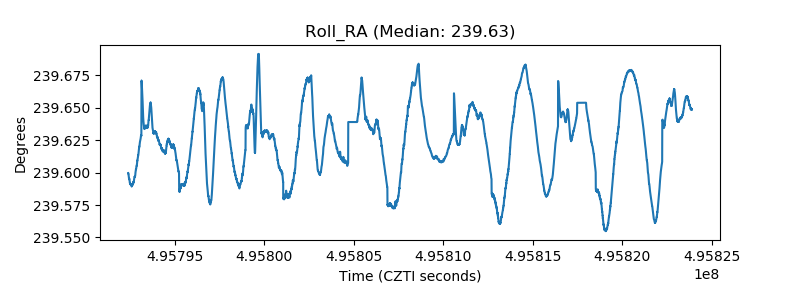 |
| Veto Counter | 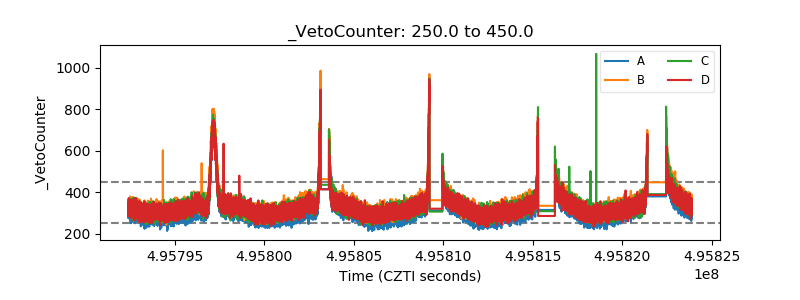 |